Gold Trend Analysis August 7, 2025Market Overview
- Gold prices rose slightly in the first trading session of the week due to geopolitical concerns in the Middle East and weak US employment data
- However, selling pressure returned in the early morning today as the USD recovered and US bond yields rose slightly again
- The market is waiting for the speech of the Fed officials later today, which is expected to be hawkish
Factors that pressured gold down
- DXY index rose again, putting pressure on gold prices, which are priced in USD
- US 10-year bond yields increased
- FED said it was not in a hurry to cut interest rates
- Money flows shifted to stocks
XAUUSD trade ideas
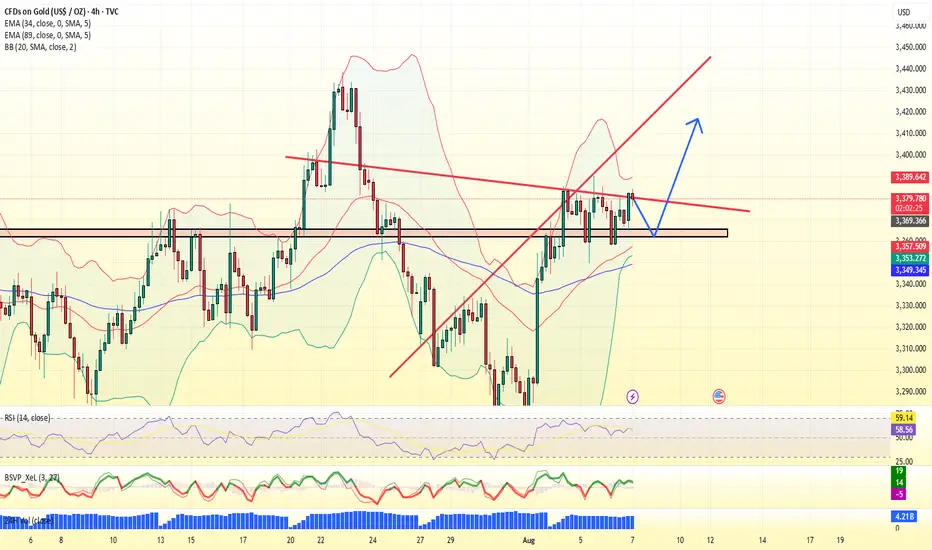

Gold Price Trend Analysis and Trading Guidance (Exclusive)📣📣📣A technical analysis of gold's recent performance reveals that it has formed a four-day winning streak, demonstrating the strength of the upward trend and indicating that short-term upside potential has not yet been exhausted. Of note, the upper Bollinger Band at 3430 on the daily chart is acting as a key resistance level, and this level is likely to be tested this week. However, when it comes to a sharp rise in the market, there is no clear signal at present. We need to wait for the opening pattern of the daily Bollinger band to be confirmed before we can open up a new round of upward space.🧐🧐🧐🤔🤔🤔
Switching to the H4 cycle for observation, the unilateral upward trend continues to consolidate, the moving average system shows a perfect upward divergent arrangement, the Bollinger Bands simultaneously maintain an open state, and a short-term high pressure is formed near the upper rail of 3415. Based on this, the bullish logic for gold remains unchanged on Wednesday, with the intraday high range likely to be between 3415 and 3430. There's no need to overestimate whether the price will break through previous highs at this point, and trading strategies should be adjusted dynamically based on real-time market performance. From a short-term perspective, intraday support should focus on two key levels: 3360 and 3350.
👊👊👊On the operational level, it is recommended to adopt a strategy of placing long orders in batches when the price falls back to the 3365-3360 range, relying on the support level to seize the opportunity of trend continuation.⭐️⭐️⭐️
⚠️⚠️⚠️The market is risky, so participate rationally. If you need real-time trading references and trading advice, please leave a message to Charlie.🛫🛫🛫 FOREXCOM:XAUUSD VELOCITY:GOLD PEPPERSTONE:XAUUSD CMCMARKETS:GOLD ICMARKETS:XAUUSD CMCMARKETS:GOLD FXOPEN:XAUUSD
Gold (XAU/USD) 4H Institutional Analysis — August 6, 2025As of August 6, 2025 (12:23 UTC), Gold (XAU/USD) is trading around 3,367.60, according to Kitco’s live spot price feed. After a sustained bullish recovery from the 3,320–3,330 demand zone, gold finds itself at a structural inflection point. Institutional footprints across the board — from order blocks to liquidity maps — are signaling one dominant message: the bulls are setting the stage.
In today’s breakdown, we deliver a high-conviction execution plan using a fusion of Smart Money Concepts (SMC), ICT methodology, and 4H structural dynamics — isolating only the strongest Primary Buy and Sell zones, along with their fallback counterparts. At the center of this framework is our Golden Zone, the most institutionally-aligned, high-probability area of the day.
🔍 Market Structure & Directional Bias
The 4-hour chart has shown a clear Change of Character (CHoCH) to the upside after a bullish Break of Structure (BOS) above the 3,355 level. This signals a phase shift from consolidation into accumulation and potential expansion, likely aiming toward the 3,400 psychological magnet and beyond.
The presence of volume imbalances, fair value gaps, and unmitigated order blocks across multiple structural layers further supports a bullish directional bias. Liquidity has been swept below previous equal lows (EQL), creating an environment ripe for institutional accumulation.
Directional Bias: Transitional → Bullish
🎯 Primary Execution Zones
✅ Primary Buy Zone (Golden Zone) — 3,355 to 3,360
This zone represents the highest-quality long opportunity on the chart today. Sitting in the discount array (below 50% of recent swing), the zone is built on a fresh Rally-Base-Rally (RBR) demand structure formed after a decisive CHoCH.
The 3,355–3,360 range aligns with a valid unmitigated Order Block, an embedded Fair Value Gap, and an OTE retracement between 0.705–0.79 Fib levels. Beneath this zone lies a sweepable liquidity pocket just under 3,350, further increasing the magnetism of the area.
Entry: 3,355–3,360
Stop Loss: Below 3,350 (liquidity invalidation)
Take Profits:
TP1: 3,395–3,400 (1.272 extension)
TP2: 3,420 (1.618 extension)
Confluences: RBR Demand, OB, FVG, OTE, Volume Imbalance, EQL Sweep, Discount Array, Structural Support
Kill Zone Timing: London-NY Overlap
✅ Golden Zone of the Day
✅ Primary Sell Zone — 3,395 to 3,400
While the broader bias is bullish, gold remains capped by a strong Drop-Base-Drop (DBD) supply zone around 3,400 — also the 1.272 fib extension from prior bullish legs. A pocket of equal highs (EQH) just above 3,405 serves as a liquidity magnet and stop-loss hunting zone — making this supply level extremely attractive for short-term reversion plays.
Entry: 3,395–3,400
Stop Loss: Above 3,405
Take Profits:
TP1: 3,360
TP2: 3,350
Confluences: DBD Supply, OB, FVG, OTE Retrace, EQH Sweep, Premium Array, Structural Resistance
⚠️ Secondary Execution Zones (If Primary Fails)
🟢 Fallback Buy Zone — 3,325 to 3,330
If the market manipulates lower and invalidates the primary buy zone with a deep liquidity sweep, this deeper zone offers a second chance. It contains a secondary demand block, a valid FVG, and lies cleanly within a deep discount retracement.
SL: Below 3,320
TPs: 3,360 and 3,380
🔴 Fallback Sell Zone — 3,445 to 3,450
If gold breaks cleanly above 3,405, likely invalidating the primary sell idea, the next institutional level of interest is 3,445–3,450 — sitting on a higher timeframe premium OB and major liquidity shelf.
SL: Above 3,455
TPs: 3,395 and 3,370
🌐 Institutional Consensus: Bullish Convergence
Institutional analysts across major platforms confirm a bullish bias, with targets hovering around the 3,400–3,420 area:
Reuters reports that gold is near a one-week high, supported by weaker U.S. data and increased rate-cut bets.
MarketPulse highlights the “return of the bulls” amid sustained momentum and light CPI expectations.
Citi has raised its medium-term gold target to $3,500, citing negative U.S. macro headwinds.
TradersUnion confirms support at 3,320 and resistance at 3,400 — mirroring our execution levels.
There is no significant divergence in sentiment or structure, validating today's trade zones with confidence.
📌 Final Thoughts
In a liquidity-driven market, price is engineered — not discovered. Today, that engineering points to one thing: 3,355–3,360 is the Golden Zone — the strongest execution area, supported by eight institutional confluences, favorable structure, and widespread sentiment confirmation.
Gold has re-entered its institutional kill-box. The next move? Likely engineered to deliver smart money profits while trapping the uninformed. Don’t chase price. Let it come to your zone. Execute with discipline.

Gold (XAU/USD) Technical Analysis:Gold is currently trading around $3,365, after a failed attempt to hold above resistance, suggesting further consolidation or potential downside.
🔹 Bearish Scenario:
If price breaks below $3,350 and holds, the decline may extend toward the $3,310 support area.
🔹 Bullish Scenario:
If price pushes back above $3,370 and holds, we may see an upside continuation toward $3,390, and possibly $3,430 if bullish momentum sustains.
⚠️ Disclaimer:
This analysis is not financial advice. It is recommended to monitor the markets and carefully analyze the data before making any investment decisions.

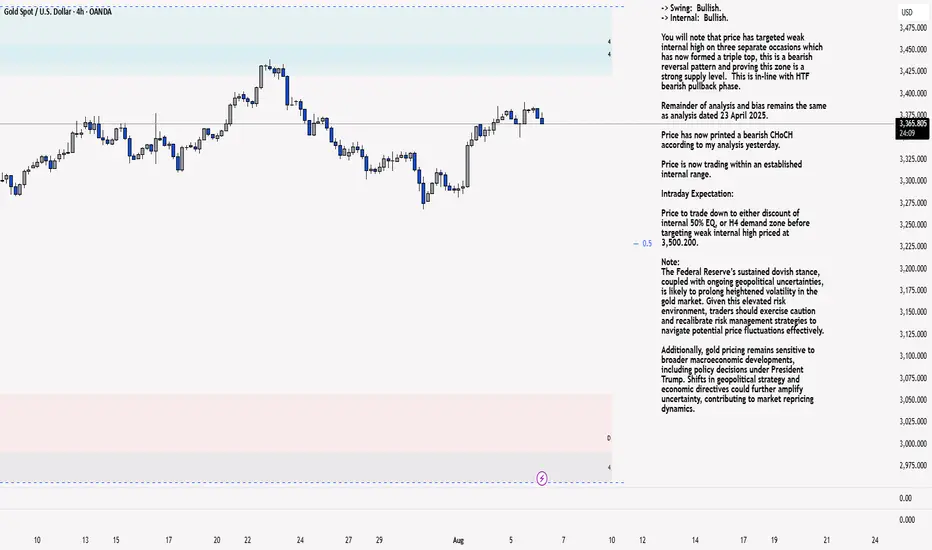
XAU/USD 06 August 2025 Intraday AnalysisH4 Analysis:
-> Swing: Bullish.
-> Internal: Bullish.
You will note that price has targeted weak internal high on three separate occasions which has now formed a triple top, this is a bearish reversal pattern and proving this zone is a strong supply level. This is in-line with HTF bearish pullback phase.
Remainder of analysis and bias remains the same as analysis dated 23 April 2025.
Price has now printed a bearish CHoCH according to my analysis yesterday.
Price is now trading within an established internal range.
Intraday Expectation:
Price to trade down to either discount of internal 50% EQ, or H4 demand zone before targeting weak internal high priced at 3,500.200.
Note:
The Federal Reserve’s sustained dovish stance, coupled with ongoing geopolitical uncertainties, is likely to prolong heightened volatility in the gold market. Given this elevated risk environment, traders should exercise caution and recalibrate risk management strategies to navigate potential price fluctuations effectively.
Additionally, gold pricing remains sensitive to broader macroeconomic developments, including policy decisions under President Trump. Shifts in geopolitical strategy and economic directives could further amplify uncertainty, contributing to market repricing dynamics.
H4 Chart:
M15 Analysis:
-> Swing: Bullish.
-> Internal: Bullish.
H4 Timeframe - Price has failed to target weak internal high, therefore, it would not be unrealistic if price printed a bearish iBOS.
The remainder of my analysis shall remain the same as analysis dated 13 June 2025, apart from target price.
As per my analysis dated 22 May 2025 whereby I mentioned price can be seen to be reacting at discount of 50% EQ on H4 timeframe, therefore, it is a viable alternative that price could potentially print a bullish iBOS on M15 timeframe despite internal structure being bearish.
Price has printed a bullish iBOS followed by a bearish CHoCH, which indicates, but does not confirm, bearish pullback phase initiation. I will however continue to monitor, with respect to depth of pullback.
Intraday Expectation:
Price to continue bearish, react at either M15 supply zone, or discount of 50% internal EQ before targeting weak internal high priced at 3,451.375.
Note:
Gold remains highly volatile amid the Federal Reserve's continued dovish stance, persistent and escalating geopolitical uncertainties. Traders should implement robust risk management strategies and remain vigilant, as price swings may become more pronounced in this elevated volatility environment.
Additionally, President Trump’s recent tariff announcements are expected to further amplify market turbulence, potentially triggering sharp price fluctuations and whipsaws.
M15 Chart:
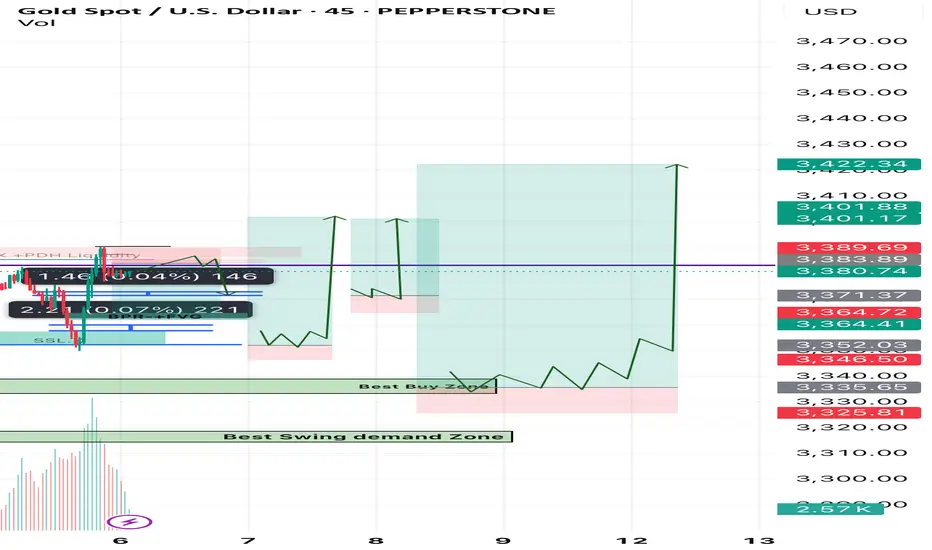
Gold h4 Based Setups Short Gold and Long analysis Market tapped above previous high (BSL + PDH Liquidity), then rejected → classic liquidity sweep
• Formed FVG + BPR zone (red box) and price consolidated below it
• You’re in a short trade targeting ~3365 (blue/green zone) where a new BPR + FVG block is formed (possible demand zone)
If price holds below 3383–3387 zone (FVG + BPR) and breaks 3375 support zone clearly
• We might see a drop toward:
• 3365 (1st TP – already marked)
• 3356–3352 (next demand & SSL area)
🟡 Bullish Rejection Possibility:
• If price reclaims 3387 with a strong candle close
• Then:
• Stops above 3388–3390 may get swept
• Upside potential = 3396–3402 (but less likely unless fundamentals support)
Golden Buying zone for Swing trade 3335-3330 zone
Second buy Golden Zone 3315-3318
Sl Below 3295 For Swing trader
Mange your Risk Alwayse use strick Stoploss
Happy Trading Best Of Luck
Gold- key technical analysis **key technical analysis**
### 📊 **1. Current Price & Trend**
* **Current Price:** **\$3,380.50**
* Price is **above the 50% Fibonacci level** (\$3,347.11) and **approaching 61.8% Fib** (\$3,371.15), a **key resistance level**.
* **Short-term uptrend** confirmed by price moving inside a rising **parallel channel** (light green zone).
* Candles show **bullish momentum** from late July.
---
### 📐 **2. Fibonacci Retracement Levels**
* **Key Support & Resistance Levels:**
* 🔼 **Resistance:**
* **61.8% Fib:** \$3,371.15 (currently being tested)
* **78.6% Fib:** \$3,405.38
* **100% Fib/Top:** \$3,448.98
* 🔽 **Support:**
* **50% Fib:** \$3,347.11
* **38.2% Fib:** \$3,323.07
* **23.6% Fib:** \$3,293.33
* **Bottom/0% Fib:** \$3,245.25
---
### 🔁 **3. Candlestick Pattern Observations**
* Series of **higher lows and higher highs**, classic uptrend formation.
* Recent candles show **strong bullish rejection from the lower channel**, suggesting buyers are in control.
---
### 🟩 **4. Channel Trend**
* Price is **respecting the ascending channel** boundaries well.
* Possible target near **upper channel line** (\~\$3,420–\$3,440) if breakout above 61.8% Fib sustains.
---
### 🌩️ **5. News/Event Marker**
* **Purple lightning bolt & US flag** indicate a **major U.S. economic event** (e.g., NFP, CPI, Fed announcement).
* Could cause **high volatility**, especially if price is near resistance.
---
### 🔍 **6. Summary / Strategic Levels**
| Level | Type | Action |
| ---------- | --------- | ---------------------------------- |
| \$3,448.98 | 100% Fib | **Major Resistance / Target** |
| \$3,405.38 | 78.6% Fib | Resistance |
| \$3,371.15 | 61.8% Fib | **Immediate Resistance** |
| \$3,347.11 | 50% Fib | **Key Support** (watch for retest) |
| \$3,323.07 | 38.2% Fib | Support |
| \$3,293.33 | 23.6% Fib | Lower Support |
| \$3,245.25 | 0% Fib | Strong Base / Last Support |
---
### 💡 **Trading Outlook**
* ✅ **Bullish Bias** above \$3,347, especially if price holds above 61.8%.
* ⚠️ Watch for breakout confirmation above \$3,405–\$3,448 for continuation.
* ❌ **Bearish reversal** if price breaks below \$3,347 and exits the rising channel.

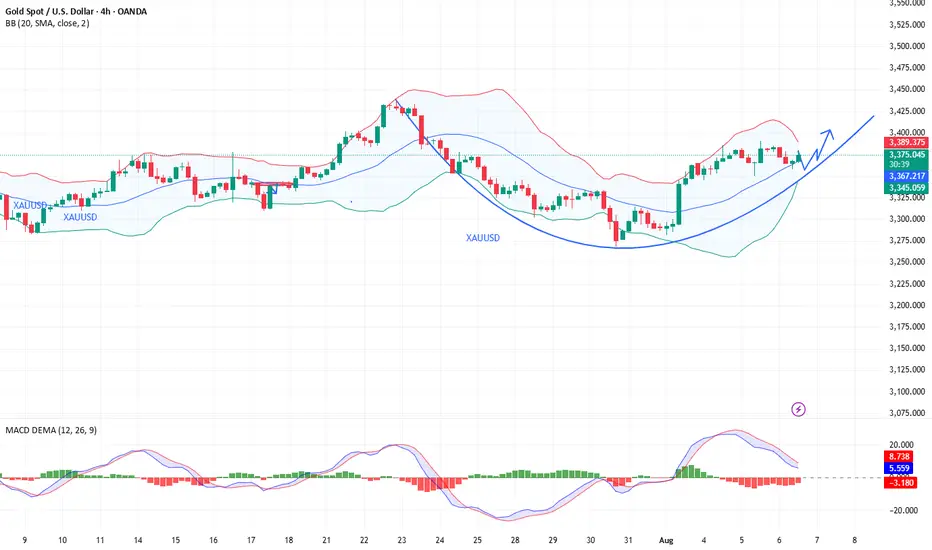
Gold rebounded near the key support level of $3,350.Spot gold edged higher during the US trading session after finding strong support near $3,350, reversing an earlier pullback. During the European trading session, gold prices briefly dipped due to improved risk appetite and a slight rise in US Treasury yields, failing to extend Monday's rebound. However, buyers stepped in near the 50-day simple moving average (SMA), pushing prices back from the day's low. The continued weakness of the US dollar, fueled by market confidence in a September Federal Reserve rate cut, supported gold's rebound.
Spot gold struggled to extend last week's rebound and is currently hovering around $3,350.
Last week, gold broke below an ascending triangle pattern, briefly hitting a one-month low, before finding support above the 100-day simple moving average (SMA), suggesting continued bearishness.
Currently, gold is trading slightly above the 50-day SMA, providing immediate support, followed by the 100-day SMA. Further declines could lead to targets near $3,275 and $3,200.
The Relative Strength Index (RSI) on the daily chart is in neutral territory around 55, indicating a lack of clear momentum. Meanwhile, the MACD indicator shows a golden cross with the DIFF crossing the DEA, and the MACD-histogram is positive, indicating accumulating bullish momentum. However, the overall reading is low, and further upward momentum is needed. A sustained golden cross and a larger candlestick pattern would be bullish.
On the upside, if bulls can reclaim the bottom of the broken triangle and decisively push above $3,380, the market could potentially move towards $3,450, or even revisit the all-time high. PEPPERSTONE:XAUUSD VELOCITY:GOLD FXOPEN:XAUUSD CMCMARKETS:GOLD VANTAGE:XAUUSD ACTIVTRADES:GOLD ACTIVTRADES:GOLD ICMARKETS:XAUUSD

BULLISH XAUUSD SETUPClean breakout setup with multiple confluences:
✅ Trendline Breakout (blue)
✅ 50 SMA Reclaim (yellow)
✅ Successful Retest (green circle)
✅ Momentum Push Through TP1, TP2
🔜 Approaching TP3, heading towards FINAL TP @ 3433.06
📌 This move was anticipated after structure shifted bullish with strong volume. As long as price holds above 3373.69, I'm maintaining a bullish bias.
🔔 Key Levels:
TP1: 3332.34 ✅
TP2: 3373.69 ✅
TP3: 3401.96
Final TP: 3433.06
Let’s see if the bulls have the strength to push all the way!

Mechanical vs. Anticipation Trades: The Fine LineWhen traders talk about discipline, they often refer to following rules — sticking to a plan, being methodical, and avoiding emotional decisions. But there's a subtle and powerful difference between being rule-based and being blindly mechanical. And even more, there's a moment in every trader’s process where discipline demands adaptation.
Let’s look at a recent trade on Gold to understand this better.
On Thursday, I published an analysis on Gold stating that the recent breakdown of support had turned that zone into resistance. A short entry from that level made sense.
It was mechanical, clean, and aligned with what the chart was showing at the time.
And, at first, it worked. Price rose into the resistance area and dropped. Perfect reaction. Textbook setup. Confirmation. The kind of trade you want to see when following a rule-based system.
But then something changed.
Price came back. Quickly.(I'm talking about initial 3315-3293 drop and the quick recover)
So, the very next rally pushed straight back into the same resistance area, hmmm...too simple, is the market giving us a second chance to sell?
That was the first sign that the market might not respect the previous structure anymore.
It dipped again after, but the second drop was different: slower, weaker, choppier.
That told me one thing: the selling pressure was fading.
So I shifted. From mechanical execution to anticipatory mindset.
This is where many traders struggle — not because they don’t have a system, but because they don’t know when to let go of it. Or worse: they abandon it too quickly without cause.
In this case, the evidence was building. The failed follow-through. The loss of momentum. The compression in structure. All signs that a reversal was brewing.
Rather than continuing to blindly short, referring to a zone that no longer held the same weight, I started looking for the opposite: an upside breakout and momentum acceleration.
That transition wasn’t based on emotion. It was based on market behavior.
________________________________________
Mechanical vs. Anticipation: What’s the Real Difference?
A mechanical trade is rule-based:
• If X happens, and Y confirms, then enter.
• No need for interpretation, no second guessing.
• It can (in theory) be automated.
An anticipatory trade is different:
• It’s about reading intent in price action before confirmation.
• Higher risk usually, but higher reward if you’re right.
• Can’t be automated. It requires presence, experience, and context.
And the tricky part? Often, we lie to ourselves. We say we’re "mechanical" while actually guessing. Or we think we’re being smart and intuitive, when in fact, we’re being impulsive.
The key is awareness.
In my Gold ideas, the initial short was mechanical. But the invalidation came quickly — and I was alert enough to switch gears. That shift is not a betrayal of discipline. It’s an upgrade of it.
________________________________________
Final Thoughts:
Discipline is not doing the same thing no matter what. Discipline is doing what the market requires you to do, without emotional distortion.
And that, often, means walking the fine line between the setup you planned for, and the reality that just showed up.
Disclosure: I am part of TradeNation's Influencer program and receive a monthly fee for using their TradingView charts in my analyses and educational articles.

Gold still Trading in Bullish territoryTechnical analysis: No strong Bullish impulse regarding yesterday's U.S. session opening, as Gold didn’t extended recovery candles and finally invalidated both Resistances in one hit / try (I cannot treat #3,382.80 as an breakout since strong Volatility Gold is Trading under). This is a typical sign that the market should continue consolidating, waiting for a catalyst to extend Buying motion. Since Gold is Buying every Bottom since #2023 Year as fractal which is repeated #3 times statistically, every variance that Gold repeats #3 times or more, it becomes a cycle which every Gold Trader should take into consideration. As Fed commentary usually arise Buyers on the aftermath - Gold continues the Buying sentiment, engages the consolidation Rectangle (lately #5-session consecutive run of #20 point Trading on average), then engages the steeper decline. Regarding all mentioned above, I can expect Trading to be performed above #3,377.80 - #3,382.80 hard Resistance zone where Gold can engage the consolidation Rectangle above (Stabilization area as I prefer calling it), and then again deliver Lower High’s extension once local High's are Priced in. Fundamentally, the Risk-off sentiment that DX Investors had these past few sessions should fade away after this result as Investors will remove capital from riskier assets such as DX and Bond Yields, and can go back to safe-haven metals such as Gold with confidence. Meaning that if DX continues to lose value after NFP debacle, Bond Yields should benefit along with the Stock markets, which can kick-start the Buying sequence on Gold, and vice-versa.
My position: I will keep Buying every dip on Gold from my key entry points / #3,357.80 is one of them expecting final push above the Resistance zone towards #3,400.80 benchmark.

BUY XAUUSD 5.8.2025Confluence order: BUY at M15
Type of order: Limit order
Reason:
- The current top is not touching anything, expected to rise to the H1 above.
- M15~FIBO 0,5-0,618 (same position)
Note:
- Management of money carefully at the last bottom (3,370)
Set up entry:
- Entry buy at 3,364
- SL at 3,360
- TP1: 3,370 (~1R)
- TP2: 3,383 (~4R)
- TP3: 3,391 (~6R)
Trading Method: Price action (No indicator, only trend and candles)

XAUUSD Live Trade with 11,641 USD ProfitsI managed to ride the momentum last night on XAUUSD and made over 11,641 usd profit on a live trading account. Gold usually create a range. It will create a top and a bottom then it will spend most of its time inside that range. That is pretty much how XAUUSD moves. If you can identify the top and the bottom then you can short it from the top and do a long trade on the bottom. The price will just travel from bottom to top and top to bottom. You can scalp your way to profits on this move if you can time it properly. Once in a while, a break from the top or the bottom happens. This is where you switch from trading the range to trading breakouts.
When you trade breakouts, you must trade it with the knowledge that less than 15 percent of breakouts are successful. Failed breakouts are very common. You need to have some form of stoploss below your breakout levels. You will know that the breakout fails once your stoploss is hit. If the breakout is successful then ride it. Do not put some TP (target price or take profit price) rather just trail your profits. Move your stops a few pips behind the price. Just enough distance to let the price breathe. If the price reverses then it will hit your stops. If the breakout is strong then you will ride it for a while until it reverses.
It will form another top and bottom again and move inside that range. Switch your approach again in trading long trades near the bottom and short trades near the top.
Just remember to always have some stoploss on every trade and never try to predict what the market will do or how the price will move. Let the market do its thing and just react to its movements.
Goodluck on your trades.

XAUUSD 4H Analysis – Bullish Reversal OpportunityGold is currently trading around $3,336, retesting a key demand zone near $3,334 – $3,340 (green box). This zone has acted as strong support in the past, aligning with a major horizontal level and previous breakout retests.
🔍 Key Levels:
Support Zone: $3,334 – $3,340 (green box)
Resistance 1: $3,361
Resistance 2: $3,394
Major Demand Zone Below: $3,223
📊 Technical Outlook:
Price has pulled back into a strong demand area after failing to break above the $3,394 resistance. If bulls defend this green zone, we could see a bounce toward $3,361 and potentially $3,394. A clean break above $3,394 could open the door for a retest of the $3,420+ zone.
However, if this demand zone breaks, sellers could push price lower toward $3,223.
💡 Trading Plan:
Buy Entry: Around $3,334 – $3,340 (on bullish confirmation)
Stop Loss: Below $3,323
Take Profit 1: $3,361
Take Profit 2: $3,394
⚠ Disclaimer: This is not financial advice. Always conduct your own analysis and manage risk properly before trading.
#XAUUSD #Gold #Forex #Trading #PriceAction #TechnicalAnalysis #SwingTrade #SmartMoneyConcepts #SupportAndResistance #CommodityTrading

XAUUSD BUY AT 3320.5 and Target at 3466.2 Before 25th AugustXAUUSD BUY AT 3320.5 and Target at 3466.2 Before 25th August 2025, This Gann Method, Do your analysis and check according to your analysis,
XAUUSD BUY

XAUUSD – Key Support Break TestGold has been consolidating after failing to reclaim the 3,358.25 resistance zone. Price is now testing the 3,340.00 support, with further downside pressure targeting 3,320.11 if sellers maintain momentum.
Support: 3,340.00 🔽, 3,320.11, 3,300.00, 3,270.00
Resistance: 3,358.25 🔼, 3,380.00, 3,400.00
🔎 Bias:
🔼 Bullish: If price holds above 3,340.00 and reclaims 3,358.25.
🔽 Bearish: If price closes below 3,340.00, opening the path to 3,320.11 or even lower to 3,300.00.
📛 Disclaimer: This is not financial advice. Trade at your own risk.

XAU / USD 30 Minute ChartHello traders. Looking at my area of interest on a lower time frame, my 4 hour chart analysis was pretty spot on. I missed the move up, but I am watching to see if we move back down to take out anyone in Longs that are in profit when the NY session starts in 30 minutes. Big G gets shout out. Be well and trade the trend.

XAU/USD 12 August 2025 Intraday AnalysisH4 Analysis:
-> Swing: Bullish.
-> Internal: Bullish.
You will note that price has targeted weak internal high on three separate occasions which has now formed a triple top, this is a bearish reversal pattern and proving this zone is a strong supply level. This is in-line with HTF bearish pullback phase.
Remainder of analysis and bias remains the same as analysis dated 23 April 2025.
Price has now printed a bearish CHoCH according to my analysis yesterday.
Price is now trading within an established internal range.
Intraday Expectation:
Price to trade down to either discount of internal 50% EQ, or H4 demand zone before targeting weak internal high priced at 3,500.200.
Note:
The Federal Reserve’s sustained dovish stance, coupled with ongoing geopolitical uncertainties, is likely to prolong heightened volatility in the gold market. Given this elevated risk environment, traders should exercise caution and recalibrate risk management strategies to navigate potential price fluctuations effectively.
Additionally, gold pricing remains sensitive to broader macroeconomic developments, including policy decisions under President Trump. Shifts in geopolitical strategy and economic directives could further amplify uncertainty, contributing to market repricing dynamics.
H4 Chart:
M15 Analysis:
-> Swing: Bullish.
-> Internal: Bullish.
H4 Timeframe - Price has failed to target weak internal high, therefore, it would not be unrealistic if price printed a bearish iBOS.
The remainder of my analysis shall remain the same as analysis dated 13 June 2025, apart from target price.
As per my analysis dated 22 May 2025 whereby I mentioned price can be seen to be reacting at discount of 50% EQ on H4 timeframe, therefore, it is a viable alternative that price could potentially print a bullish iBOS on M15 timeframe despite internal structure being bearish.
Price has printed a bullish iBOS followed by a bearish CHoCH, which indicates, but does not confirm, bearish pullback phase initiation. I will however continue to monitor, with respect to depth of pullback.
Intraday Expectation:
Price to continue bearish, react at either M15 supply zone, or discount of 50% internal EQ before targeting weak internal high priced at 3,451.375.
Note:
Gold remains highly volatile amid the Federal Reserve's continued dovish stance, persistent and escalating geopolitical uncertainties. Traders should implement robust risk management strategies and remain vigilant, as price swings may become more pronounced in this elevated volatility environment.
Additionally, President Trump’s recent tariff announcements are expected to further amplify market turbulence, potentially triggering sharp price fluctuations and whipsaws.
M15 Chart:

Gold Sell OpportunityThe 4H chart for Gold CFDs shows selling pressure after breaking below support, with a short trade setup as follows:
Entry Price: 3,354.716
Stop Loss: 3,384.766 (30.393 points – 0.91%)
Target: 3,269.266 (85.107 points – 2.54%)
Risk/Reward Ratio: 1 : 2.8
Expected Time to Target: ~3 days 4 hours (August 15, 2025 – 14:00).
Technical Indicators:
MACD: Currently in negative territory with a bearish crossover, suggesting potential continuation of the downtrend.
Momentum Histogram: Red bars expanding, confirming selling pressure.
Volume Profile: Strong liquidity above the current price, acting as an additional resistance zone.
📌 Conclusion: The outlook remains bearish while price stays below the 3,384.7 resistance, with a potential move toward the 3,269 area if bearish momentum continues.

Reasons for gold price plunge in today's trading session 11/8Gold prices fell 1% on Monday as markets focused on upcoming talks between the United States and Russia over the Ukraine conflict, along with July data that could bring more concerns about the Federal Reserve's interest rate outlook.
Gold was trading at $3,363.31 an ounce at 0703 GMT, having hit its highest since July 23 on Friday. US gold futures for December delivery fell 2% to $3,423.10 an ounce.
"Easing geopolitical tensions over the Ukraine war sent gold prices lower, following Friday's announcement that US President Donald Trump will meet Russian President Vladimir Putin on US soil"
Meanwhile, US consumer price data is due on Tuesday, with recent tariffs expected to push the core index up 0.3%, taking the annual rate of growth to 3%, above the Federal Reserve’s 2% target.
“If inflation is high, the US dollar could strengthen and make it difficult for gold to rise. However, I think gold prices will still be supported as investors buy on dips.”
The recent weaker-than-expected US jobs report has increased expectations that the Fed will cut interest rates in September. Markets are pricing in about a 90% chance of easing in September and at least one more cut before the end of the year.

GOLD still pushing up? TVC:GOLD from last week price has been extremely bullish as for this week it's still on that bullish trend not much of change. What could this mean for the Dolla TVC:DXY 🤔? Because anything can happen during week. What are your predictions traders let me know on the comment session 💯.
