XAUUSD trade ideas

XAUUSD BUYWatching how price is reacting here. Few hours early from NY open but if this 4 hour zone holds as support, could see a bull move to test the break.

Trading Idea XAUUSD 🎯 Trade Ideas Based on Structure
1. Long Reversal Play (Buy)
📍 Entry: If price retests the support zone around 3,356–3,366 and shows bullish confirmation (e.g. bullish engulfing, pin bar)
🎯 Target: 3,390–3,402 (resistance zone)
🛡️ Stop Loss: Just below 3,355
💡 Why? Buying into support with confirmation aligns with the projected rebound idea
2. Sell into Resistance
📍 Entry: If price rallies to 3,390–3,402 and stalls with weak candles or bearish divergence
🎯 Target: Back to support zone (~3,366 or lower)
🛡️ Stop Loss: Above 3,405
💡 Why? Fading into resistance follows the broader trend while using the shaded zone for timing
3. Breakout Trade (Buy)
📍 Trigger: If price breaks cleanly above 3,402 and closes with strong momentum
🎯 Target: Look toward next resistance (~3,410+)
🛡️ Stop Loss: Below breakout candle (~3,390)
💡 Why? Signals a trend shift or strong bullish move against the recent downtrend
🧠 Smart Trading Tips
Let the candles lead the decision—watch for confirmation before jumping in
Stick to the higher probability zones and avoid overtrading in the middle
Use volume or RSI to filter false breakouts or weak entries

Gold Exhibiting Weak Bearish Momentum – Is a Rebound Imminent?Gold Exhibiting Weak Bearish Momentum – Is a Rebound Imminent?
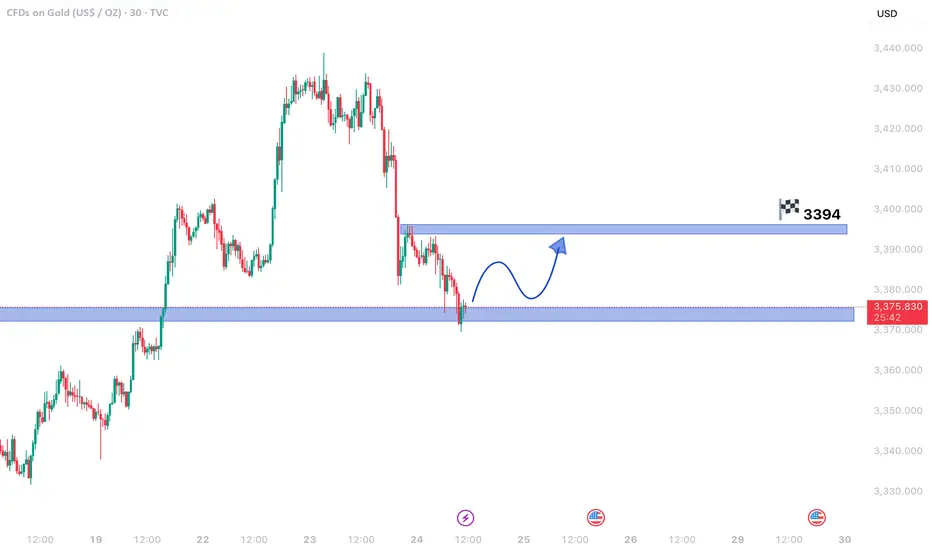
The 30-minute chart reveals gold prices in a mild downtrend, but the sluggish decline hints at weakening bearish pressure. This could set the stage for a temporary price recovery before any further downward movement.
Critical Insights:
- Fading Bearish Strength: The downtrend persists, but its slowing pace suggests seller exhaustion.
- Key Support Zone: With prices hovering near a major support area, a bullish reversal becomes plausible.
- Upside Potential: A resurgence in buying momentum may propel gold toward 3,394.60, a significant resistance level.
Market Dynamics:
1. Possible Short-Term Reversal: Shallow bearish trends near support often precede upward corrections.
2. Bullish Opportunity: A breakout past nearby resistance could fuel a rally toward 3,394.60, creating a swing trade setup.
3. Downside Risk: If support fails, the bearish trend may extend, though weak selling pressure limits immediate declines.
Strategic Approach:
- Entry Consideration: Long positions near current support levels could capitalize on a rebound.
- Risk Management: A drop below support would negate the bullish outlook, warranting a stop loss.
- Confirmation Signals: Bullish candlestick formations or increasing volume would strengthen reversal prospects.
Concluding Thoughts:
Gold’s tepid bearish momentum near a crucial support level raises the likelihood of a short-term bounce. Traders should watch for confirmation—if the recovery gains traction, 3,394.60 may come into play. Conversely, a support breakdown could renew downward pressure.
GOLD IN A WEAK BEARISH MOVE IN 30M TIME FRAME CHARTGold in a Weak Bearish Move – Temporary Rebound Ahead?
Gold prices are currently displaying a weak bearish momentum on the 30-minute chart, suggesting that the downtrend may be losing steam. Despite the downward movement, the sluggish pace indicates that sellers lack strong conviction, which could lead to a short-term price recovery before any further decline.
Key Observations:
- Weak Bearish Trend: The price is falling, but with decreasing momentum, often a sign of exhaustion among sellers.
- Critical Support Level: Gold is trading near a major support zone, where buying interest could emerge, triggering a bounce.
- Potential Rebound Target: If buyers step in, the price could rise toward 3,394.60, a key resistance level.
Market Implications:
1. Short-Term Reversal Likely: Weak bearish moves often precede temporary rallies, especially near strong support levels.
2. Bullish Scenario: A breakout above immediate resistance could push gold toward 3,394.60, offering a swing trading opportunity.
3. Bearish Continuation Risk: If support breaks, the downtrend may resume, but the current lack of strong selling pressure reduces immediate downside risks.
Trading Strategy:
- Buying Opportunity: Traders might consider long positions near support, targeting 3,394.60.
- Stop Loss: A break below the current support level would invalidate the rebound setup.
- Confirmation Needed: Watch for bullish candlestick patterns or rising volume to confirm the reversal.
Final Thoughts:
While gold remains in a short-term bearish phase, the weak downside momentum and proximity to support suggest a possible pullback. Traders should monitor price action closely—if the rebound holds, 3,394.60 could be the next target. However, a failure to hold support may extend the decline.
*Disclaimer: This analysis is for informational purposes only. Trade with proper risk management.*

XAUUSD| Smart Money Confirmations LoadingBias: Bullish
HTF Overview: Price has just tapped into the 30-minute order flow zone after clearing out sell-side liquidity. This area aligns cleanly with bullish intent and prior structure.
LTF Focus: Currently waiting for lower timeframe confirmation — ideally a clear CHoCH or internal flip. Once smart money confirms this zone with a shift, I’ll look to enter and ride the momentum.
Target: Initial focus is on the 5-minute highs as a short-term objective. While price could continue toward 30-minute highs, structure suggests the recent 5M high is a more immediate and realistic target, making it a smarter move to secure profit around that level.
Mindset Note: Not in a rush — letting price speak first. The confirmation is what separates a guess from a smart move.

Bullish Momentum Fading? Key Correction Levels Ahead XAUUSD – Bullish Momentum Fading? Key Correction Levels Ahead (23 July)
📰 Market Overview
Gold surged strongly overnight, driven by:
A speech from Fed Chair Jerome Powell, with no hints of resignation or major policy shift.
Rising geopolitical tensions between the US, China, and the EU — with the 1st of August marked as a key deadline.
A notable drop in US bond yields and the US Dollar, triggering increased demand for safe-haven assets like gold.
While today’s economic calendar is quiet, the market remains sensitive to sudden volatility.
📉 Technical Analysis
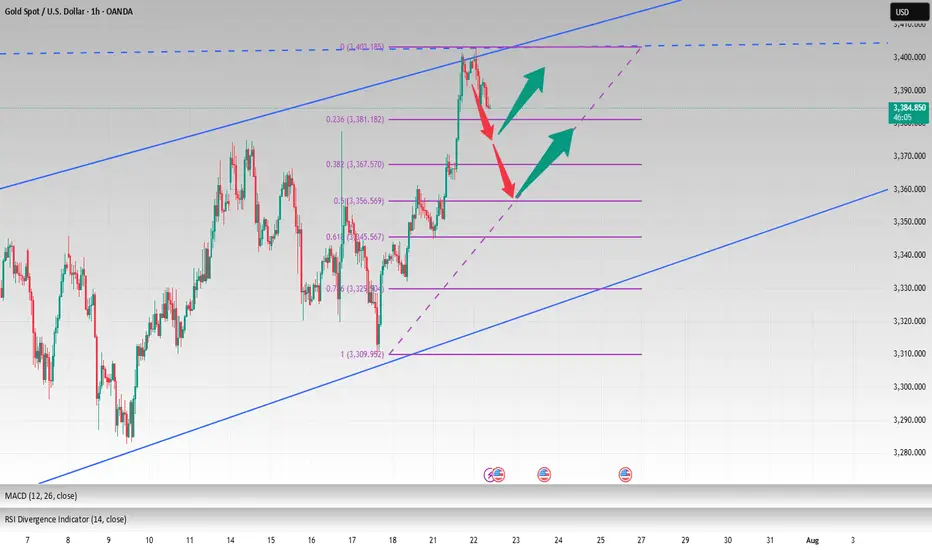
On the H4 chart, the recent bullish wave shows signs of exhaustion. Reversal candles are now forming on the H1 and M30 timeframes — suggesting a potential correction in the short term.
The 3412 – 3410 support zone will be critical. If price breaks below and invalidates the ascending trendline, we may see a deeper pullback toward lower liquidity zones (FVGs).
Below that, the 335x region offers strong confluence (Fibonacci 0.618 + previous demand zone), making it a prime area for potential long entries if price action confirms a bounce.
📌 Trade Setups to Watch
🔻 SELL ZONE: 3469 – 3471
Stop Loss: 3475
Take Profit Targets: 3465, 3460, 3455, 3450, 3445, 3440, 3430, 3420
→ Wait for a breakout and retest before shorting.
🔸 BUY SCALP: 3385 – 3383
Stop Loss: 3379
TP Targets: 3390, 3394, 3398, 3402, 3406, 3410
→ Ideal for intraday pullback entries with clear structure.
🔹 STRONG BUY ZONE: 3356 – 3354
Stop Loss: 3350
TP Targets: 3360, 3364, 3368, 3372, 3376, 3380, 3390, 3400
→ Great long-term entry zone with technical alignment (liquidity + fib levels).
⚠️ Risk Management Reminder
Even in low-news sessions, markets may spike unexpectedly due to political statements or liquidity sweeps.
Always respect your TP/SL levels — smart trading is protected trading.
💬 Patience breeds precision. Wait for the zone, trust the plan, and manage the trade.

Daily Analysis- XAUUSD (Thursday, 24th July 2024)Bias: Bearish
USD News(Red Folder):
-Flash Manufacturing PMI
Notes:
- Strong bearish closure, tariffs ease
- Looking for retracement to the downside
- Potential SELL if there's
confirmation on lower timeframe
- Pivot point: 3430
Disclaimer:
This analysis is from a personal point of view, always conduct on your own research before making any trading decisions as the analysis do not guarantee complete accuracy.

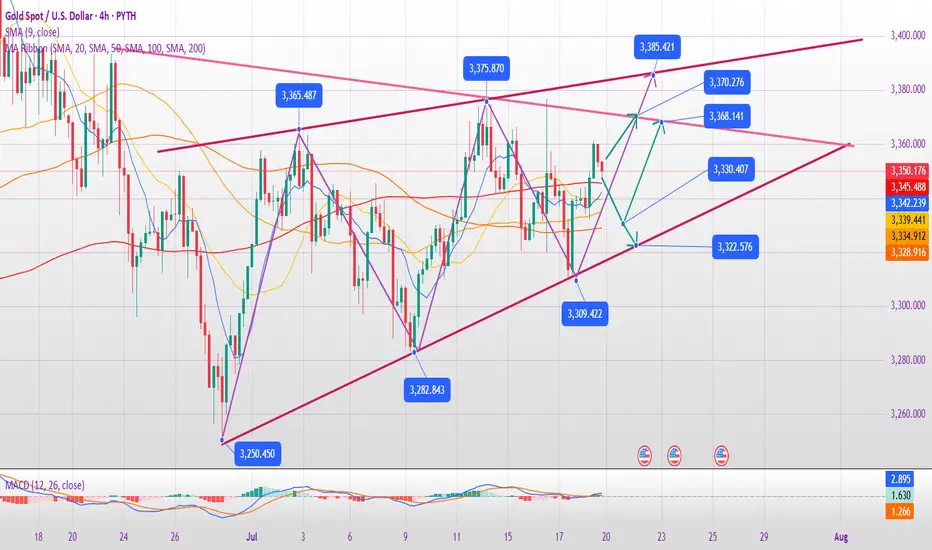
Gold Bullish idea so far . 23.7.2025we got the last bullish zone at 3375- 3326 ( marked as BC )
price must respect that zone to go for the next target at around 3500 .
This is ONLY the Bullish Idea .
price must Break 3454 to activate new ATH sequence targeting 3850 zone .

GOLD: Move Up Expected! Long!
My dear friends,
Today we will analyse GOLD together☺️
The in-trend continuation seems likely as the current long-term trend appears to be strong, and price is holding above a key level of 3,393.33 So a bullish continuation seems plausible, targeting the next high. We should enter on confirmation, and place a stop-loss beyond the recent swing level.
❤️Sending you lots of Love and Hugs❤️

XAU / USD 4 Hour ChartHello traders. Well although I didn't take the trade, we pushed down as per my last analysis. I have currently marked my areas of interest for scalp buy / sell trades. Big G gets a shout out. Lower time frame confirmation is always a must. Be well and trade the trend. Let's see how the current 4 hour candle closes.


XAU/USD: Bullish Reversal with Inverted Head & Shoulders PatternTechnical analysis of the XAU/USD (Gold) on the 15-minute timeframe. We are seeing a classic bullish reversal pattern that could offer a solid long opportunity.
The Pattern: Inverted Head and Shoulders (IH&S)
As highlighted on the chart, an Inverted Head and Shoulders pattern has clearly formed.
Left Shoulder: The initial dip and recovery.
Head: A lower dip, marking the potential bottom of the recent downtrend.
Right Shoulder: A higher low, indicating that sellers are losing strength and buyers are stepping in at higher prices.
This pattern signals a potential shift in market sentiment from bearish to bullish.
Confirmation and Trade Setup
The key to confirming this pattern is the neckline, which has been acting as a significant resistance level. We have now seen a decisive candle break and close above this neckline, providing the confirmation we need to consider a long position.
Here is the trade idea based on the chart:
Entry: A long position is initiated right after the breakout of the neckline, around the 3,428.542 level. A potential entry could also be on a retest of this broken neckline, which would now act as support.
Stop Loss (SL): To manage risk, the stop loss is placed below the low of the Right Shoulder at 3,419.498. A move below this level would invalidate the bullish pattern.
Take Profit (TP): The profit target is determined by measuring the height from the Head to the neckline and projecting it upwards from the breakout point.
Primary Target (TP1): 3,445.548. This target also aligns well with the '2' Fibonacci extension level, adding extra confluence to the trade.
Risk/Reward Ratio: This setup offers a favorable Risk/Reward ratio of approximately 1.88, making it an attractive trade from a risk management perspective.
Additional Confluence
Moving Averages: The price is now trading above the key moving averages, which are beginning to curl upwards, suggesting building bullish momentum.
Stochastic Oscillator: While the Stochastic is in the upper region, in a strong bullish move, it can remain overbought for an extended period.
Conclusion
The confirmed breakout from the Inverted Head and Shoulders pattern on the 15M chart presents a compelling bullish setup for XAU/USD. The defined entry, stop, and target levels provide a clear and actionable trade plan.

Buy Plan – XAUUSD (Gold Spot) | 15M Chart📈 Buy Plan – XAUUSD (Gold Spot) | 15M Chart
Entry Reason:
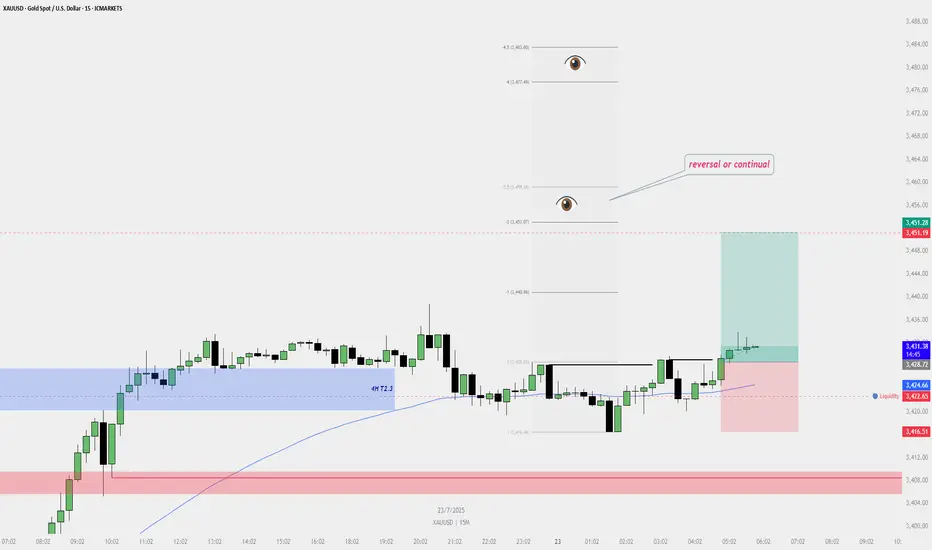
Price reclaimed liquidity below the internal range and formed a bullish shift in structure. A valid bullish dealing range was confirmed, supported by the 200 EMA and 4H T2.3 zone.
✅ Entry Zone:
➤ Entry taken after confirmation above short-term swing high
➤ Liquidity sweep confirmed below M15 consolidation
➤ Bullish FVG + support from HTF zone
🎯 Target:
TP1: 3,440.86 (1R)
TP2: 3,451.07 to 3,459.18 (Eyes above – possible reversal or continuation zone)
🛑 Stop Loss:
Placed below most recent swing low: 3,416.51
Below liquidity & invalidation of bullish structure
🧠 Bias:
Bullish (short-term continuation expected)
Reclaim above EMA and HTF zone respected
📌 Key Notes:
Watch price behavior near 3,451.07–3,459.18 for potential reversal or breakout
If price fails to maintain strength above 3,440, consider locking partial profits
Monitor 15M and 1H structure for any sign of internal break
3400 has been reached, wait patiently for a pullback to go longGold opened on Monday with a volatile rise. After breaking through the 3360-65 area, the bulls turned strong. After breaking through the 3375~80 area in the evening, the bulls accelerated their rise, reaching the highest point of 3402. It fluctuated sideways in the late trading, and the daily line closed at around 3397 with a big positive line! Gold temporarily broke the small range oscillation pattern, but the bulls were not strong, and it still fluctuated upward.
From the perspective of the intraday cycle, after yesterday's rapid rise, the market fell into a serious overbought state; however, yesterday's $60 big positive line supported the bulls, and it is expected that the market will fluctuate; the next focus is still the 3400 mark area. The pressure in the 3400~05 area was dense last night, and adjustments may be made at any time before the breakthrough; and since the rise of 3282, it has just touched the upper edge of the parallel channel. The big sweep will continue, but the range is constantly changing!
So although gold broke the recent volatility yesterday and hit the 3400 mark with a big positive line; however, if it cannot stand above it, then it will continue to fall; recently we have repeatedly and many times emphasized the importance of the 3400 mark. If it stands here, the market will gradually rise to 3420~25 and break through to the 3450 area before looking for a decline.
Today we will continue to focus on the 3400 mark area. First, we will rush to the high altitude, with the goal of retracement to the 3375 and 3356 regional support platforms, and then pay attention to long opportunities; if the bulls stand above the 3400 mark, they will further bullishly impact 3420~25 and break through the 3450 area before falling back.
OANDA:XAUUSD
GOLD Will Go Up! Buy!
Please, check our technical outlook for GOLD.
Time Frame: 2h
Current Trend: Bullish
Sentiment: Oversold (based on 7-period RSI)
Forecast: Bullish
The market is trading around a solid horizontal structure 3,427.91.
The above observations make me that the market will inevitably achieve 3,460.54 level.
P.S
We determine oversold/overbought condition with RSI indicator.
When it drops below 30 - the market is considered to be oversold.
When it bounces above 70 - the market is considered to be overbought.
Disclosure: I am part of Trade Nation's Influencer program and receive a monthly fee for using their TradingView charts in my analysis.
Like and subscribe and comment my ideas if you enjoy them!

XAU / USD Weekly ChartHello traders. Taking a look at the gold chart before the overnight sessions get underway, I have marked my areas of interest for potential scalp buy / sell trade set ups on the weekly chart. This is just speculation and more of a visual of why the areas are of interest to me. Let's see if we push up some more to the top of the candle's body to the left and then see if we reject or start filling wicks. Being tomorrow is the half way point of the week, I can see gold pushing down to take out some of the leveraged long trades still in profit from today's move up. Big G gets a shout out. Let's see how the overnight sessions play out. Be well and trade the trend.

Gold Intraday Trading Plan 7/23/2025Gold rose yesterday as expected, although it didn't reach my target of 3450. With daily close above the resistance line drawn in the chart, we confirm the bullish momentum and it is strong.
For today's setup, I will buy from the trendline support which is around 3420.
1st target 3450
Final target for today 3500

Gold Trading Strategy | July 22-23✅As anticipated in our morning analysis, Gold prices pulled back during the Asian and European sessions, precisely touching the key support zone around 3385. In the U.S. session, futures prices once again drove a strong rally, pushing gold through the 3400–3402 resistance zone and reaching the measured move target after the breakout. The bullish trend remains intact, and our strategy of buying on pullbacks has once again proven effective.
✅Key Technical Levels:
🔴Resistance:
🔸3445–3450: Key resistance zone for swing trades and the primary upside target;
🔸3430: Intraday one-ATR projection level and previous daily closing high;
🟢Support:
🔹3420: Short-term support level; if the price holds above, further upside is likely;
🔹3402–3405: Key support zone and critical stop-loss area for breakout long positions;
🔹3383–3385: Critical support zone and today's low;
🔹3371–3375: Previous resistance turned support; if broken, the bullish structure needs reassessment.
✅Trading strategy reference:
🔰The overall trend remains strongly bullish, with buying on dips as the primary strategy.
🔰Shorting is only suitable for experienced traders and should be approached with caution and tight risk control.
🔰If gold pulls back but holds above 3405, buying opportunities remain valid;
🔰If the price reaches the 3445–3450 zone and shows signs of exhaustion or bearish reversal, consider reducing long exposure or testing shorts with strict stop-losses.
🔥Trading Reminder: Trading strategies are time-sensitive, and market conditions can change rapidly. Please adjust your trading plan based on real-time market conditions. If you have any questions or need one-on-one guidance, feel free to contact me🤝

GOLD SELL POSITIONPrice have been correcting the last move down and now is showing a strong resistance at this level. expect price to move down in any news coming soon from US session.

Analysis and strategy of gold trend on July 21:
In-depth analysis of gold market and precise trading strategy
Analysis of core contradictions
Game of long and short forces:
Short forces: Strong economic data (retail sales +0.6%, unemployment benefits 221,000) pushed the US dollar index to 98.95, and the US Treasury yield rose to 4.495%
Bull forces: The safe-haven buying caused by inflation expectations formed a strong takeover, and the 3300 mark showed strong support
Market signal interpretation:
The deep V reversal shows the characteristics of "false breakthrough", and smart funds take the opportunity to absorb funds
The negative correlation between US Treasury yields and gold has temporarily failed, reflecting the market's confusion about the Fed's policy expectations
Technical three-dimensional analysis
Daily level:
MACD double-line golden cross, the upward momentum column is mildly increased
KDJ golden cross runs above 60, not entering the overbought area
Key watershed: 3320 (bullish defense line) vs 3375 (previous high resistance)
4-hour level:
The rising channel is complete, and the low point gradually moves up (3309→3320)
The angle after the KDJ golden cross is steep, indicating sufficient short-term momentum
30-minute short-term:
3350 constitutes the intraday long-short balance point
If the Asian session falls and the callback does not fall below 3342, the strong structure will be maintained
Precise trading strategy
Main long plan:
Ideal entry: 3332-3335 (Fibonacci 38.2% retracement level)
Defense point: 3318 (Daily EMA30 support)
Target ladder: 3355 (Start reducing positions and take profits) → 3372 (stop profit 50%) → 3398 (trend target)
Secondary short opportunity:
Trigger condition: first touch 3373 + shooting star pattern
Stop loss setting: 3383 (previous high + 3 US dollars to filter false breakthroughs)
Profit space: 3350-3340 (quick in and quick out)
Breakthrough trading strategy:
Break above 3380: chase longs when stepping back to 3370, target 3400 integer level
Break below 3315: short when the price rebounds to 3325, target 3290 support
Key price matrix
Support level 3330 long-short boundary
Support level 3310 trend lifeline
Resistance level 3365 previous day high
Resistance level 3375 weekly level strong resistance
Special tips for risk management:
Position control: single transaction does not exceed 3% of the principal
Time window: US market volatility is usually magnified by 30%
Emergency warning:
Speech by Fed officials may trigger a $50 fluctuation
The escalation of geopolitical conflicts in the Middle East will trigger safe-haven buying
Operational suggestions: The current market is in a key direction selection window, and it is recommended to adopt a combination strategy of "breakthrough follow + callback buy". Focus on the breakthrough of the 3365-3375 area during the US trading period. If three consecutive 15-minute K-lines stand at 3370, the upward space will be opened. Conservative investors can wait for a pullback to the 3330-3335 area to arrange mid-term long positions.
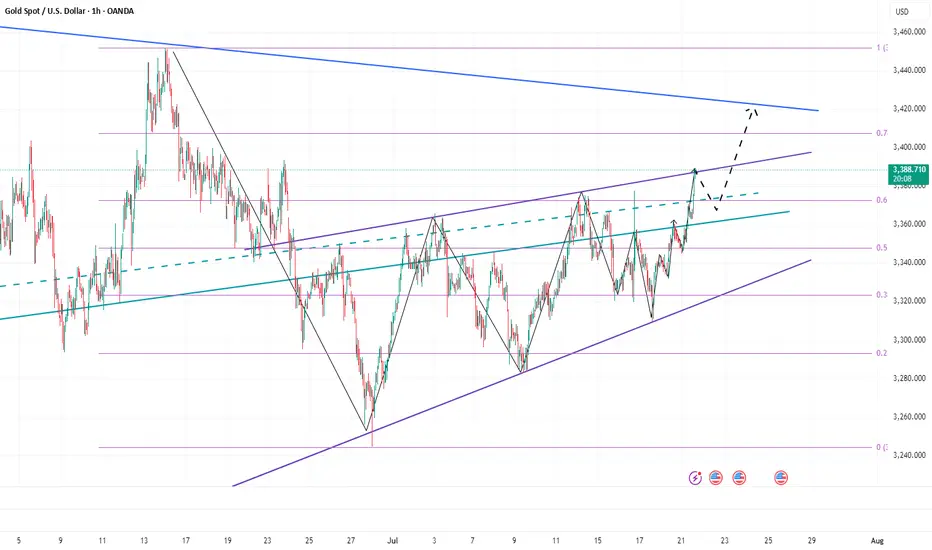
Warning Signs After Gold’s Sharp Rise — Is a Pullback Coming?Today, gold rebounded from around 3345, and has now rebounded to around 3389, which is only one step away from the 3400 mark. Gold has hardly retreated during the rise, and the rise is strong. However, we can see from the small-level candle chart that gold suddenly accelerated its rise after consolidating around 3365, and continued to around 3390, and is now oscillating near the recent high trend line.
After gold accelerated its rise and oscillated near the recent high trend line, this made me have to be more cautious, because we must be careful that the acceleration of gold's rise in the short term is a trap for buyers, so even if we are bullish on gold in the short term, we should not directly chase gold at a high level; according to the current structure of gold, I think it is necessary for gold to retest the 3370-3360 area support before continuing to rise and hitting 3400. Only after verifying that the support in this area is effective can it be conducive to a better rise in gold!
So for short-term trading, I think we can still try to short gold now, and then wait patiently for gold to retest the 3370-3360 area.
GOLD (XAUUSD) IdeaGold Broke the previous major resistance and probability is to come back to resistance and make the resistance become support. As well as, the zone is the Previous Day High which can also be dense liquidity zone. So we looking for buy setups at that level. Good LUCK
