180 Pips Secured on GOLD! | Sniper Strategy in Action📈 Tired of Gold Trades Going Against You? This Sniper Strategy Just Bagged +180 Pips!
Hello Traders,
Struggling with XAUUSD’s volatility?
Taking small wins but suffering big losses?
You’re not alone — and we’ve built something just for you.
🔥 Introducing GOLD SNIPER — a high-probability strategy engineered for serious Gold traders.
With a consistent 1:2 risk-reward and precision entry logic, it’s designed to help you ride big moves and avoid common traps in XAUUSD.
🚀 Today’s Live Trade Recap:
Signal 1
🟢 Buy @ 3355.91
🔴 SL @ 3349.91
🟢 TP @ 3367.91
✅ Result: +120 Pips
Signal 2
🟢 Buy @ 3368.32
🔴 SL @ 3362.32
🟢 TP @ 3380.32
❌ Result: -60 Pips
Signal 3
🟢 Buy @ 3373.29
🔴 SL @ 3367.29
🟢 TP @ 3385.29
✅ Result: +120 Pips
📊 Total Profit Today: +180 Pips
✅ What Makes Gold Sniper So Effective?
✔️ Catches real momentum, not noise
✔️ Keeps entries & exits disciplined and mechanical
✔️ Aims for high-reward trades, not scalp scraps
🎯 Want better entries and more consistent wins on XAUUSD?
📩 DM us now to get instant access and start using Gold Sniper on your TradingView chart.
If this helped you, like the idea and drop a comment — let’s grow together!
Happy Trading,
InvestPro India
XAUUSD trade ideas

XAUUSD Analysis todayHello traders, this is a complete multiple timeframe analysis of this pair. We see could find significant trading opportunities as per analysis upon price action confirmation we may take this trade. Smash the like button if you find value in this analysis and drop a comment if you have any questions or let me know which pair to cover in my next analysis.

XAUUSD Short 2nd EntryElite Analysis
XAUUSD 2nd Entry
Same analysis as before
All rules confirmed
Targeting lower liquidity pools

XAUUSD (Gold) Intraday/Swing Trading Plan – Tuesday, 5th August Timeframe: M30 (30-Minute)
Strategy Type: Structured Buy-the-Dip with Staggered Take Profits
Market Bias: Bullish
Risk Profile: Moderate Risk, Medium Holding Duration
Trade Style: Intraday Momentum + Short Swing
🧠 Market Structure & Context
Gold continues to show a strong upward momentum in early August, with the M30 chart printing higher highs and higher lows consistently. Monday’s session closed with bullish strength above key psychological zones, suggesting the uptrend remains intact. Price is currently retracing after an impulsive move, providing a prime opportunity for a clean entry.
The M30 structure also shows a tight bullish channel, and pullbacks into confluence zones have proven to be reliable buy areas. The plan will focus on timing re-entries after each impulse leg to ride multiple profit waves toward higher targets.
🔍 M30 Trading Plan Breakdown
✅ Phase 1: Buy on Retracement to 3379 (Primary Entry Zone)
Entry Zone: 3379
Why:
Key support zone from previous structure breakout
Near 50% Fibonacci retracement of prior impulse
Price-action pivot zone where buyers stepped in Monday
Confirmation to Enter:
Bullish engulfing or hammer on M30
RSI bounce above 40–45
Price closes back above dynamic support (50 EMA)
Stop Loss:
Below 3369 (10 pips buffer beneath structure)
🎯 Target 1: 3395
Reasoning:
Short-term resistance from Monday NY session wick high
Completion of first impulse move (~1.5R target)
Action:
Take 30–40% profit
Move SL to breakeven or trail slightly below new support at 3385
Wait for pullback to enter Phase 2
✅ Phase 2: Re-Entry After Pullback (Post-3395)
Retracement Zone: 3388–3390 (bullish flag / higher low expected)
Re-Entry Trigger:
Tight consolidation followed by bullish breakout on M30
RSI remains above midline; MACD crossover confirmation optional
🎯 Target 2: 3418
Why:
Next resistance zone based on price rejection in late July
Also aligns with intraday Fibonacci extension (1.272 of the first wave)
Strong psychological + structural zone
Action:
Take 30–40% more profit
Adjust trailing SL to 3398 or dynamic support based on EMA
Monitor for pullback to hold or fade
✅ Phase 3: Final Position Hold or Re-Add on Pullback
Retracement Zone: 3405–3408 (previous resistance turned support)
Entry/Scaling Condition:
Price respects the new support zone and prints continuation candle
M30 volume and momentum remain positive
🎯 Target 3: 3443
Why:
Key psychological level near 3440–3450 resistance
Top of projected trend channel and potential supply zone
Excellent exit zone before possible reversal or profit-taking by institutions
Action:
Close remaining 20–30% of position
Optional: Watch for breakout >3443 for longer swing continuation if fundamentals align
⚠️ Risk Management Notes
Max risk per full plan: 1.5–2% of account
SLs strictly enforced at each entry
No entry during high-impact news spikes (check economic calendar)
Never chase — only execute on confirmed candle setups and risk-reward compliance
🔁 Summary Table
Phase Buy Level Target SL Action
Phase 1 3379 3395 3369 Take 30–40%, trail SL
Phase 2 3388–3390 3418 3379 Take 30–40%, trail SL
Phase 3 3405–3408 3443 3395 Take final 20–30%, full exit
📊 Indicators Used
50 EMA / 200 EMA: Confirm trend and support
RSI (14): Trend strength and bounce signal
MACD: Confirmation of momentum continuation
Volume: Increased buy-side volume confirms valid breakout after retracement
🕒 Session Timing Considerations
Asian Session: Wait for price to dip to 3379 — ideal entry zone
London Open (3pm SG time): Look for breakout toward 3395
New York Open (8:30pm SG time): Strong move possible to 3418 or 3443 depending on momentum and news catalysts

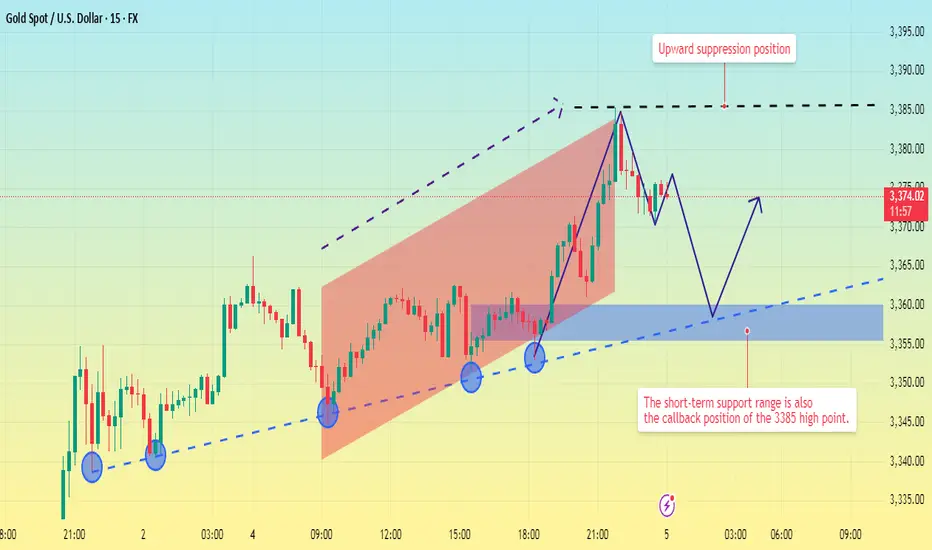
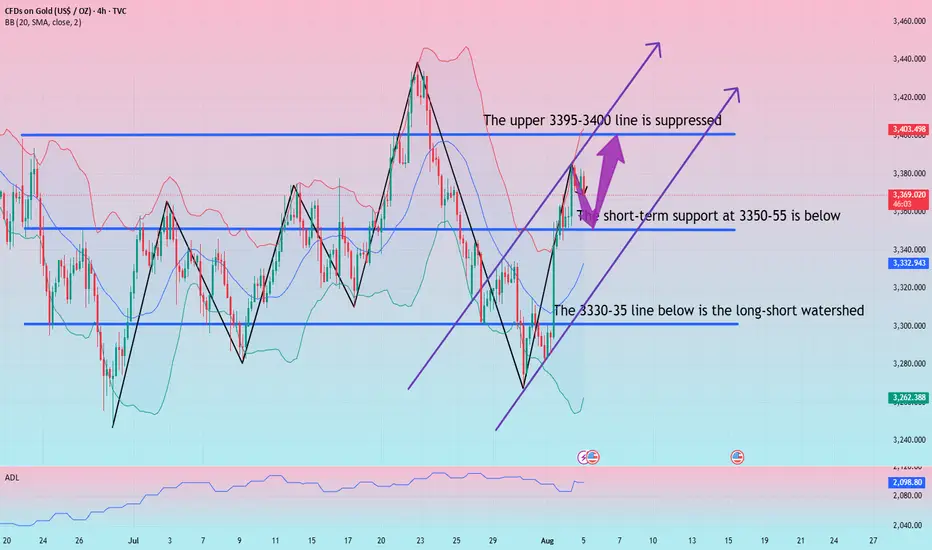
Upward movement suppressed. Price pullback?Gold prices have now perfectly reached the short-selling target range predicted by Quaid.
The current 4-hour chart clearly shows that gold's current resistance level remains around 3385.
Looking at the shorter 15-minute chart, gold has been slowly rising within an upward channel today. The resistance level of 3385 has not been effectively broken, and there is a high probability of a further pullback to test the 15-minute trendline.
Currently, 15-minute trendline support remains around 3355-3360. Focus on this support range in the short term, as it also represents a profit-taking opportunity after shorting at the 3385 high. This level can also be considered a watershed between bulls and bears. If the price pulls back to this level and does not continue to decline, there is a high probability of another upward move at this level.
However, if it falls below the 3350 trendline, the market will enter a downward trend.
Good luck to everyone in the new week.
XAUUSD Possibility of a small correction towards 3330, re-entering the bearish phase and moving towards the specified targets

**"Gold Price Rebounding from Support:Potential Move Toward 3436This chart shows the **price movement of Gold (XAU/USD)** on a **daily timeframe**.
### Key Points:
* **Support Zone** : Around **\$3,266**, this is the area where price has bounced up multiple times, meaning buyers step in here.
* **Resistance Line**: Around **\$3,436**, this is the level where price has been rejected before, meaning sellers are strong here.
* **Current Price**: Around **\$3,293**.
### What the Chart Suggests:
* Price is near the **support** zone again.
* If the support holds, the green arrow shows a possible move **upward**.
* Price may first move up slightly, pull back, and then try to **break above resistance** at \$3,436.
Gold is in a sideways range. It's near a strong support level and might go up from here toward the resistance level, as shown by the green line.

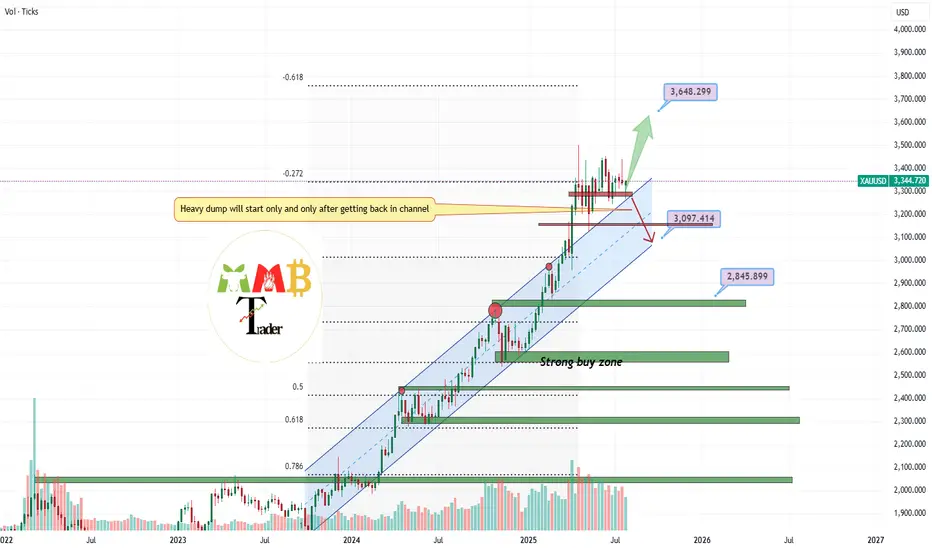
GOLD channel breakout retest complete more pump ahead As we can see the blue channel resistance is gone and also now it turn to strong and valid support and retest is also complete and gold is now targeting 3600$ easy.
DISCLAIMER: ((trade based on your own decision))
<<press like👍 if you enjoy💚
XAUUSD: Market Analysis and Strategy for August 4th.Gold Technical Analysis:
Daily Chart Resistance: 3400, Support: 3300
4-Hour Chart Resistance: 3370, Support: 3330
1-Hour Chart Resistance: 3363, Support: 3352.
Last week's NFP data was positive for gold prices, sending gold prices sharply higher. The market trend was much stronger than expected, breaking through the resistance level of 3333 and then rising to around 3360.
The daily chart shows Friday's sharp rise, erasing the losses from the first four days of last week. This signals continued bullishness for this week and the market outlook.
However, for those of us who are day traders, please be cautious about buying at high levels. After all, excessive short-term gains in gold could lead to profit-taking.
Technically, the daily MACD fast and slow lines are about to form a golden cross near the zero axis, indicating that the downward correction is nearing its end. However, the 1-hour RSI indicator shows a strong overbought signal, suggesting continued movement towards the lower support level.
For today's trading, it's best to wait for a pullback before buying. This is both safer and offers greater profit potential. Focus on the lower support level around 3333-3320. Upside targets could be in the 3375-3390 range.
Buy: near 3330
Sell: near 3370

Gold (XAUUSD) Bullish Reversal: Targeting Upper Liquidity ZoneFirstly, our Algo-based indicators are used to create this analysis:
This 1-hour chart for XAUUSD indicates a strong bullish reversal is underway, with the price aiming to fill higher inefficiencies and test a significant resistance zone.
Analysis:
Market Structure Shift: Gold has broken its recent bearish structure with a powerful move upwards from the low near 3,267. The price has decisively reclaimed key moving averages (EMA 200, EMA 800), signaling a potential shift in the medium-term trend.
F illing Imbalances (FVG): The price action appears to be driven by a move to fill areas of imbalance, marked as Fair Value Gaps (FVG). After bouncing from a lower FVG, the price has surged and is now being drawn towards higher FVG zones.
Price Projection: The drawn black line illustrates a potential path for the price. It anticipates a minor pullback from the current resistance around 3,363. This pullback could find support near the 3,300 level before initiating the next major rally. This "dip and rip" pattern would establish a higher low and confirm the strength of the new uptrend.
Ultimate Target: The primary objective for this bullish move is the significant resistance zone at the top of the chart, labeled "LSOB" (Liquidity Sweep Order Block). This area, between approximately 3,427 and 3,438, represents a major liquidity pool where a significant reaction can be expected.
Strategy:
Idea: Look for a long entry opportunity on a potential pullback.
Entry Zone: A dip towards the 3,290 - 3,312 area could present a favorable entry, as this aligns with the projected bounce point.
Target: The main target for this trade is the upper resistance zone at 3,427 - 3,438.
Conclusion:
The confluence of a market structure break, the reclamation of key moving averages, and the magnetic nature of the upper Fair Value Gaps all point to a continued bullish scenario for Gold. A healthy pullback would offer a strategic entry to ride the trend towards the major liquidity zone above.
Disclaimer: This analysis is for educational purposes only and should not be considered financial advice. Always conduct your own research and manage risk appropriately.

GOLD Key Levels to Watch After Bullish Break Gold is showing strength after last week’s breakout above key levels.
In this short video, I highlight the zones I’m monitoring for potential reaction or continuation.
I also publish a free weekly market outlook blog every Sunday covering setups on Gold, EUR/USD, GBP/USD and more.
📰 Find the blog link on my TradingView profile no signup required.
Let’s stay sharp this week. Trade safe!

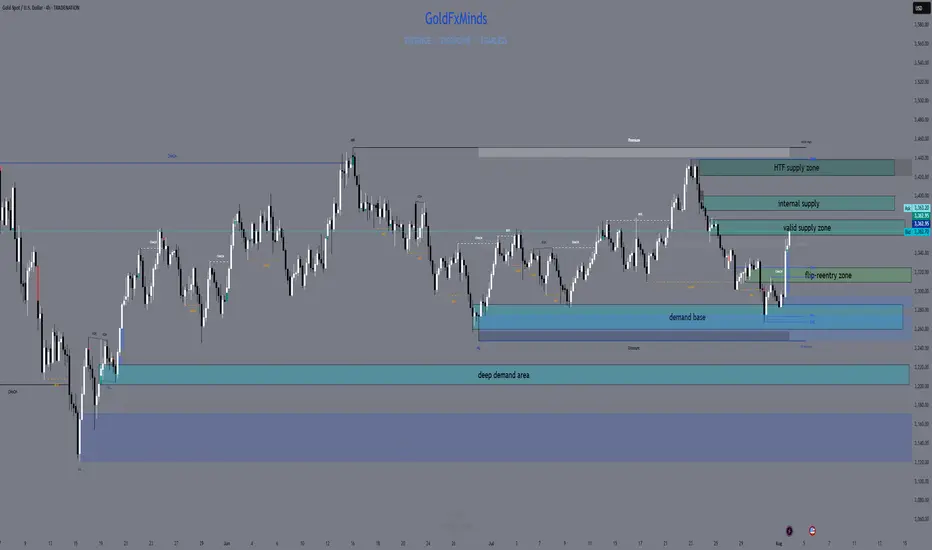
XAUUSD H4 Outlook – August 4, 2025Structure is bullish — but supply is layered. Precision now matters more than bias.
—
Gold is trading at 3362, sitting right inside the heart of a key structural zone. After a strong breakout from 3285–3260, price reclaimed imbalance, broke internal structure, and powered higher into premium. The trend is bullish — but we’ve just stepped into stacked supply.
Let’s break down every zone that matters now, from top to bottom:
🟥 3360–3375 – Valid H4 Supply Zone
This is the first active supply block — the origin of the last bearish leg. It holds a clean OB + imbalance and is currently being tested for mitigation.
We're inside it right now. This zone is critical:
→ If price breaks and holds above it, continuation is likely
→ If we reject here, it confirms sellers are defending their level
🟥 3385–3398 – Internal Supply Trap
A secondary supply zone built from previous order flow.
If bulls push through 3375 without rejection, this is the next area to watch for weakness.
This zone often creates fake breakouts, especially when momentum slows. RSI is already showing signs of exhaustion approaching this level.
🟥 3420–3440 – HTF Supply Trap
This is the top — the last unmitigated supply on the weekly.
It's not in play yet, but if bulls break above 3398 decisively, this is where the bigger trap could form.
Any long into this zone must be backed by strong structure and continuation candles — otherwise, it’s a liquidation magnet.
🟫 3322–3310 – Flip Reentry Zone
If we reject from current supply, this is the first high-probability reentry for bulls.
It’s where the last CHoCH confirmed, and it aligns with EMA confluence and minor imbalance.
Buy setups from here must be confirmed on M15/M30 — no blind longs.
🟦 3285–3260 – Breaker Demand Base
The true origin of the bullish move.
This zone caused the structural flip — clean OB, FVG stack, and liquidity sweep.
If price returns here, it becomes a must-hold for bullish continuation. One of the best sniper zones for longs.
🟦 3222–3205 – Final Demand Layer
Deep structure zone holding imbalance + previous HL base.
Only comes into play if 3260 fails. A break below this would shift bias to neutral or bearish on H4.
🎯 Bias Summary
✔️ H4 bias = bullish
✔️ Price is inside 3360–3375 supply
✔️ EMA 5/21/50 aligned, but RSI is elevated
⚠️ This is not a breakout — it’s a test zone
🔁 Execution Plan
📍 Rejection from 3360–3375 → sell scalp toward 3322
📍 Clean break of 3375 → watch for next short at 3385–3398
📍 Failure of 3398 → HTF draw toward 3430–3439
📍 Pullback toward 3322–3310 → potential long zone
📍 Clean drop to 3285 → high-RR buy area
📍 Break below 3260 → only valid demand left is 3222
—
This is not the time to chase. It’s the time to stalk.
You’re in premium. Supply is active. Let structure decide — you just execute with clarity.
—
Which zone are you watching for your next move?
Comment your bias below 👇🏼 Smash the ❤️ if this brought clarity, and follow GoldFxMinds to trade with precision every day.
Disclosure: Chart based on Trade Nation feed (TradingView).
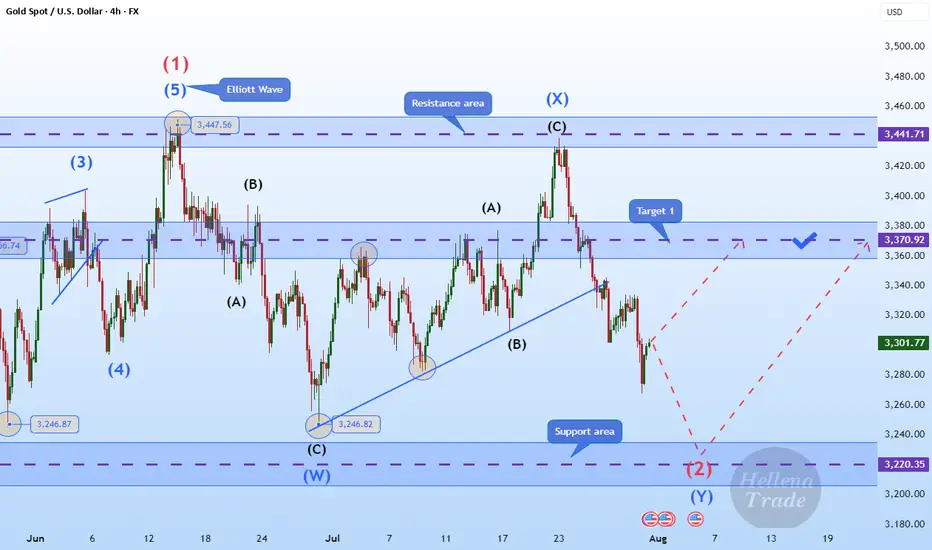
Hellena | GOLD (4H): LONG to area of 3370 (Wave 2).Colleagues, gold is once again disrupting our plans, and I have to revise the wave marking. It's not easy, but the most important thing is to keep doing it.
Now I'm back to the previous marking — the price is in wave “2” correction.
To complete this wave, the price needs to overcome the level of wave “W” of the middle order 3246.82. Then the correction will be completed and wave “3” will begin an upward movement.
I see the minimum target in the area of the 3370 level.
Manage your capital correctly and competently! Only enter trades based on reliable patterns!
Gold-Buy ScenarioChange of structure, ABC retracement formation, Inverse Heed and shoulders formation and bullish flag formation

Gold Trading Opportunity
---
### ⚡️ **– Harmonic Setup You Don’t Want to Miss**
🚨 **"We’re standing at the edge of a golden reversal!"**
The *Gartley* and *Deep Crab* harmonic patterns have formed with stunning precision, signaling a powerful potential drop*. This level is not just a number—it’s a pressure point where a reversal pattern converges with a high-volume **supply zone**, amplified by a strong **RSI overbought signal**.
💼 With disciplined **risk management** and clearly defined **stop-loss and multi-tier targets**, we’re positioning ourselves for a calculated and confident short move.
This is not guesswork—it’s a textbook setup backed by structure, momentum, and sentiment.
🔥 Don’t chase the market. Let it come to you. This setup rewards patience and precision.
---

SMART MONEY CONCEPT (SMC)Bearish Analysis – Market Structure
1: Market Context
• The price was coming from a strong bullish structure that had already mitigated the last remaining interest in the 4H OB.
• A key resistance zone was formed where institutional investors closed buy orders.
• The bullish momentum left a Fair Value Gap in 1H, which has not yet been mitigated.
2: Shift Signals
• A fake out (false breakout) was observed above the resistance, followed by a Change of Character (Choch).
• This indicates liquidity absorption and the possible start of a bearish phase.
• Distribution structure confirmed before the bearish momentum.
3:Entry Plan and Target
• Entry (Sell): In the upper zone after the 4H OB retest/resistance.
• Stop Loss: Above the fake out wick (invalidation zone).
• Take Profit: Around 3305, seeking to mitigate the FVG-1H and reach the previous support zone.
• RR: High (favorable for swing or scalping with partials).
4:Confirmation and Management
• Wait for confirmation on a lower timeframe (5M / 1M) before executing the entry.
• Watch for a possible last liquidity grab before falling.
• Manage with partials and move the SL to BE when the halfway point is exceeded.
GOOD LUCK TRADERS…

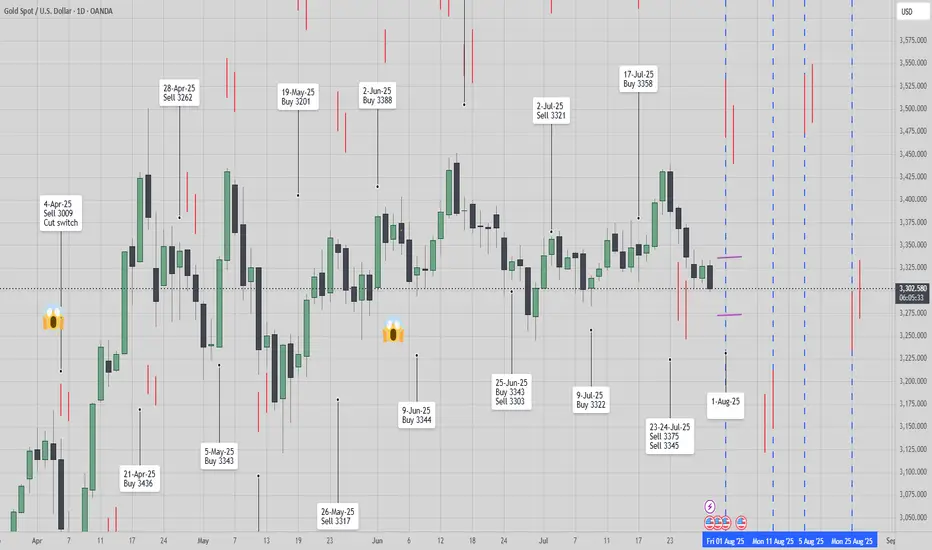
[ TimeLine ] Gold 31 July 2025📆 Today’s Date: Wednesday, July 30, 2025
📌 Upcoming Signal Dates:
• July 31, 2025 (Thursday) — Single-candle setup
• July 31–August 1, 2025 (Thursday–Friday) — Two-candle combined range
🧠 Trading Outlook & Notes
✅ Gold has recently dropped sharply from 3439 to 3298, and current conditions suggest this bearish momentum may continue.
✅ I’ll be actively trading both the July 31 and July 31–August 1 setups as part of my ongoing strategy testing and live analysis.
✅ This method and timing structure can also be applied to other assets like BTC, the US Index, and various commodities.
⚠️ For those taking a more cautious approach, it’s absolutely okay to skip the single-candle setup on July 31 and wait for the more confirmed 2-day range setup (July 31–August 1).
📋 Execution Guidelines
🔹 Range Identification:
• Let the Hi-Lo range of the chosen candle(s) form completely.
• Purple lines will mark these ranges on the chart.
• After the daily close, charts will be updated to include a 60-pip buffer, Fibonacci zones, and relevant indicators.
🔹 Entry Conditions:
• Trades are triggered only if price breaks above/below the full range, including the buffer zone.
🔹 Risk Management – Recovery Logic:
• If the Stop Loss is triggered, the trade is exited or switched, and the next valid breakout setup will use a doubled lot size to attempt recovery.
📉📈 Chart Snapshot
🔗 Paste this in TradingView: TV/x/fykxBG6w/
📌 Stick to the plan, follow the system, and let the chart lead the way.
🛡️ Capital protection comes first — always manage your risk.
Gold you now totaly buy trend for next 3 to 5 days Gold you now totaly buy trend for next 3 to 5 days
If you want learn more fell free contrect me .

RIDE THE TREND OPPORTUNITYPrice seems to have a correction movement before continue flying to next supply area.

Gold Rejected at 3315 – But Bulls Might Not Be Done Yet📌 What happened yesterday?
During the Asian session, Gold printed a fresh local low at 3268, continuing the downtrend that already dropped over 1700 pips in just one week. However, that move quickly reversed, and we saw a natural corrective bounce.
📈 Resistance holds firm
The correction took price back up into the 3310 zone, which acted as confluence resistance. After two taps into that area, price failed to sustain above 3300, indicating sellers are still active there.
❓ Is the upside correction over?
I don't think so. The recent drop has been choppy, lacking the strong momentum of previous legs. This type of price action often signals that we are still within a correction, not in a clean continuation.
📊 What am I watching?
I’m actively monitoring for:
• Exhaustion signs on the downside
• Upside reversal signals
My plan is to open long trades only when I see confirmation, aiming for a move back toward the 3330 zone, which could act as resistance.
Disclosure: I am part of TradeNation's Influencer program and receive a monthly fee for using their TradingView charts in my analyses and educational articles.

Gold bulls are under pressure to adjust and continue to increase
Gold prices continued their strong upward trend yesterday amidst volatile trading. Gold prices strengthened strongly around the 3345 level during the Asian and European sessions, rising through 3370 in the European session and continuing their upward trend. Gold then retreated and tested the 3361 level before stabilizing and accelerating higher through 3380 before closing strongly. The daily K-line closed with a volatile breakout above the highs, forming a pattern of consecutive rising highs. Gold prices continue to strengthen in the short term, reaching as high as 3385 but failing to hold, indicating significant upward pressure. A break above 3400 would likely target 3430; otherwise, a deeper correction could be in the offing. Technically, adjustments are needed, so excessive buying into the rally is advised. If your current trading is not ideal, I hope I can help you avoid investment setbacks. Welcome to discuss your options.
Based on the 4-hour chart, support is currently focused on the 3350-55 area. Rebounds to this level will maintain a bullish trend. The short-term bullish trend line is focused on the 3330-35 area. If the daily chart stabilizes above this level, continue to buy on dips and follow the trend. I will provide detailed trading strategies during the trading session, so please stay tuned.
Gold Trading Strategies:
1. Short gold on a rebound to the 3385-90 area, then cover your short position at the 3395-3400 area. Target: 3345-50, stop loss: 3405.
2. Go long on a pullback to the 3350-55 area, stop loss: 3323, target: 3390-3395. Hold if it breaks through.
Gold Breaks Support – Risk of Pullback Toward $3,310📊 Market Summary:
Gold prices initially rose on weaker-than-expected U.S. jobs data, which lowered Treasury yields and weakened the U.S. dollar. However, after breaking the key support at $3,365, gold continued to decline toward $3,354, and briefly touched $3,352, signaling rising technical selling pressure. Despite a 92% market expectation for a Fed rate cut in September, the technical breach increases the risk of a deeper correction.
📉 Technical Analysis:
• Key Resistance: Around $3,365–$3,370 – this zone now acts as short-term resistance; stronger resistance lies at $3,375–$3,380 if prices recover.
• Nearest Support:
The $3,365 level was broken.
New support is seen at $3,352–$3,350; a continued drop may bring prices to $3,335, and possibly toward $3,310–$3,300.
• EMA 09: Price is now below the 9-day EMA, suggesting a short-term bearish trend.
• Momentum / Volume / Candlestick:
RSI is near 50, slightly bearish; volume is tapering on the downside, indicating distribution.
Early signs of a head-and-shoulders (H&S) pattern are developing.
📌 Outlook:
Gold may continue declining in the short term if it stays below the $3,350–$3,352 zone.
A further drop toward the $3,335 – $3,310 region is possible.
If price rebounds and closes above $3,365, the bearish momentum could be neutralized.
💡 Suggested Trade Strategy:
🔻 SELL XAU/USD : $3,355–$3,358
🎯 TP: 40/80/200 pips
❌ SL: ~$3,361
🔺 BUY XAU/USD : $3,305–$3,302 (if price pulls back deeper)
🎯 TP: 40/80/200 pips
❌ SL: ~$3,299

XAUUSD Long Setup – 1HGold (XAUUSD) has shown strong bullish rejection from the lower volatility band after a sharp selloff. The appearance of a Heikin Ashi reversal candle, suggests a short-term reversal is forming. Price has reclaimed key structure and is now targeting a reversion back to the mean, supported by Fibonacci retracement levels.
Entry: 3293.55
Target Zone: 3308.91 → 3333.76 (Fib 38.2% – 100%)
Stop Loss: 3253.35
Confluences:
✅ Bullish engulfing + Heikin Ashi trend shift
✅ Oversold bounce from lower channel extremity
✅ Fib retracement aligns with key structural resistance zones
✅ Custom signal confirmation (green dot)
✅ Clean R:R toward upper band and previous POI
Short-term counter-trend long targeting liquidity grab and mean reversion toward the 3308–3333 zone. Risk tightly managed with SL below local swing low.
