RIDE THE TREND OPPORTUNITYPrice seems to have a correction movement before continue flying to next supply area.
XAUUSD trade ideas

Gold Consolidates at the Top, Bearish Reversal Ahead?On the 15-minute chart, XAUUSD is showing signs of exhaustion after a strong bullish impulse. Price is currently consolidating around the 3,370–3,375 resistance area, failing to make a clean breakout. Volume is fading, suggesting buyer momentum is weakening.
Technical Breakdown:
1. Market Structure:
Since late July, the market has formed a clear uptrend with higher highs and higher lows.
However, recent price action is showing indecision at the top, with multiple rejection wicks – indicating a potential short-term distribution phase.
2. Price Action & Supply-Demand Zones:
Demand Zone 1: Around 3,310–3,320 acted as the launchpad for the strong bullish breakout on August 2.
Demand Zone 2: Around 3,345–3,350 provided support for the next leg up.
Current Supply Zone: Between 3,375–3,380 – multiple rejections have been observed here.
3. Indicators Overview:
EMA20 & EMA50 (not shown but inferred): Upward sloping, but starting to flatten – signaling potential consolidation or bearish divergence.
RSI (likely above 70 earlier): Now showing signs of bearish divergence, supporting a possible short-term correction.
4. Fibonacci Retracement Analysis:
From the recent bullish swing (3,310 → 3,375), key retracement levels are:
0.382 → ~3,350
0.5 → ~3,342
0.618 → ~3,334
This confluence around the 3,334–3,342 range makes it a critical zone for a potential bullish bounce.
Suggested Trading Strategies
Scenario 1 – Scalping the Rejection (Counter-trend short):
Entry: SELL limit at 3,375–3,380
Stop Loss: 3,386
Take Profits:
TP1: 3,350 (Fibonacci 0.382)
TP2: 3,335 (Fibonacci 0.618 + previous support)
Scenario 2 – Trend Confirmation (Breakdown Play):
Setup: Sell if price breaks below 3,350 with volume confirmation.
Target Zones:
Initial target: 3,310 (prior demand zone)
Extended target: 3,280–3,265 (possible Wyckoff distribution breakdown)
Key Levels to Watch:
Significance: 3,380 - Resistance - Short-term supply zone
3,350: Support - Key Fibonacci 0.382 level
3,334: Support - Strong confluence zone (Fibo + demand)
3,310: Support - Bullish breakout base
Conclusion:
Gold is currently in a vulnerable position with signs of bullish exhaustion. Traders should stay patient and wait for confirmation before entering. Watch the 3,350–3,334 zone for reaction – it will likely decide the next directional move.
If you found this analysis helpful, make sure to follow for more updated strategies and save this post for future reference.

Bullish Breakout to $4,060 TargetOn the daily chart, XAUUSD is forming a Symmetrical Triangle with a bullish breakout potential.
📍 Buy zone: Around $3,200 (strong support and point D of the pattern)
📍 Target: $4,060 based on breakout projection.
Quick Analysis:
Pattern: Symmetrical Triangle + ABCD Harmonic
Buy near strong support at $3,200
Big upside potential after breakout
Good risk/reward for medium to long-term trades

gold 4hour say: put sellstop in lowpersonaly i predict mini crash on gold and waiting for it , now we have powerfull 3angel pattern we must put sellstop in last low , buystop on last high
sellstop stoploss = last high
if sellstop open like new traders , dont close it soon , wait minimum 2 week ,understand?
ALERT= if gold can break last high , it can start new up trend, wave , so if you have old sells ,you must put SL or hedge buystop in last low
if sell
wishhhhhhhhhhhhhh youuuuuuuuuuuuuuuu win

8/5: Watch for Short Opportunities Near 3400Good morning, everyone!
On Wednesday, gold held above the key support area at 3343–3337, and subsequently broke through the 3372–3378 resistance zone, leading to a strong bullish move and solid long-side gains.
Today, attention should shift to the major resistance around 3400. If bullish momentum continues, price may approach the secondary resistance near 3420. However, from a technical perspective, signs of bearish divergence have begun to emerge. Should price continue rising while momentum weakens, the risk of a short-term correction increases accordingly.
Key levels to monitor:
Primary resistance zone: 3404–3416
Intermediate supply area: around 3398
Crucial support zone: 3372–3363 (a hold here could support further upside)
⚠️ Cautionary Note:
The US PMI data release during the New York session could introduce volatility. Be sure to maintain strict risk management and stop-loss discipline during periods of increased uncertainty.
🔁 Trading Bias for Today:
Prefer selling into strength near resistance, while cautiously considering buying on dips near support.
The 3343–3337 area continues to serve as the primary support zone, and price action around this level will be critical in determining the next directional move

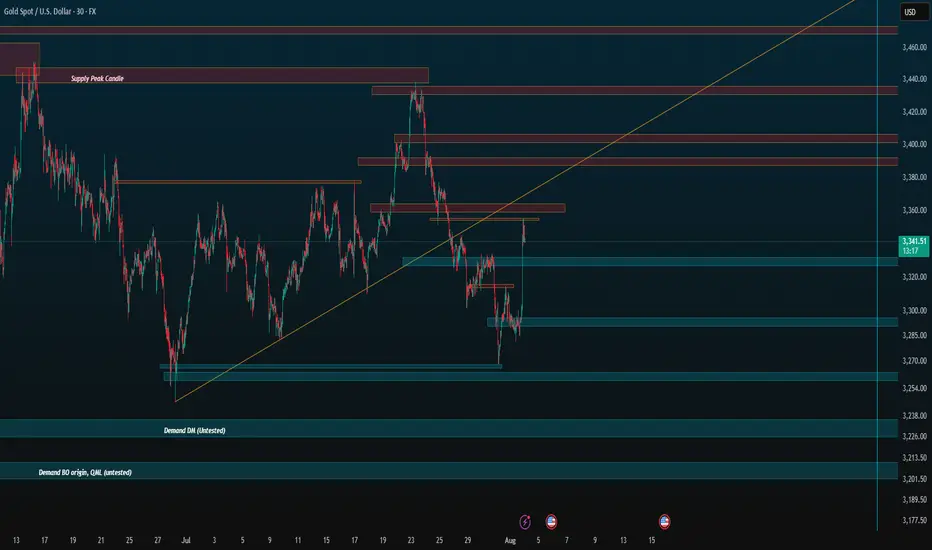
Zones for the rest of August (if no ATH)Just simple zones, ignore. I want to compare to the end of the month later.
Keep trading simple. These are the zones I made after drawing from 4H all the way to 5 minute candle for precision. I already have my own speculation but feel free to use it for your own.
Goodbye, trade safe.
XAU/USD(20250805) Today's AnalysisMarket News:
Goldman Sachs: We expect the Federal Reserve to cut interest rates by 25 basis points three times starting in September; if the unemployment rate rises further, a 50 basis point cut is possible.
Technical Analysis:
Today's Buy/Sell Levels:
3367
Support and Resistance Levels:
3407
3392
3383
3352
3342
3328
Trading Strategy:
If the stock breaks above 3383, consider buying, with the first target price at 3392. If the stock breaks below 3367, consider selling, with the first target price at 3352.

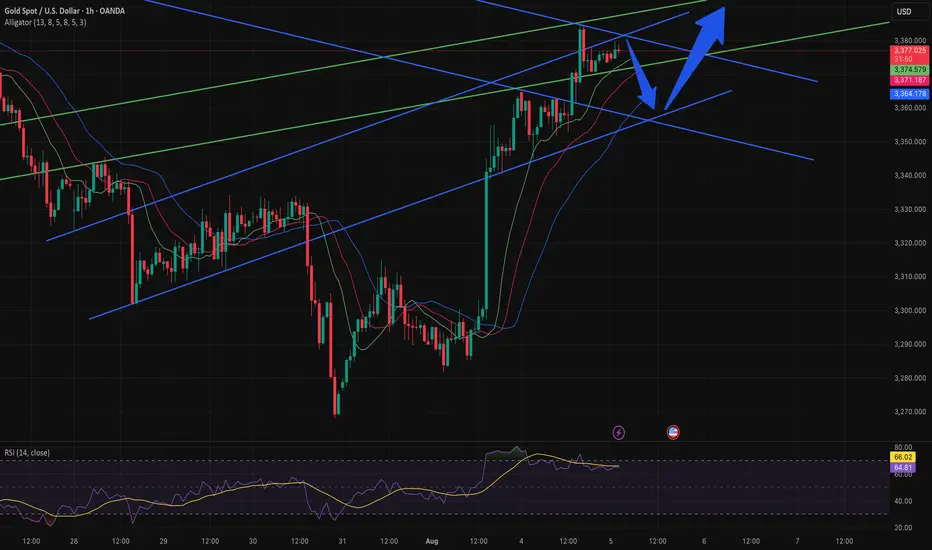
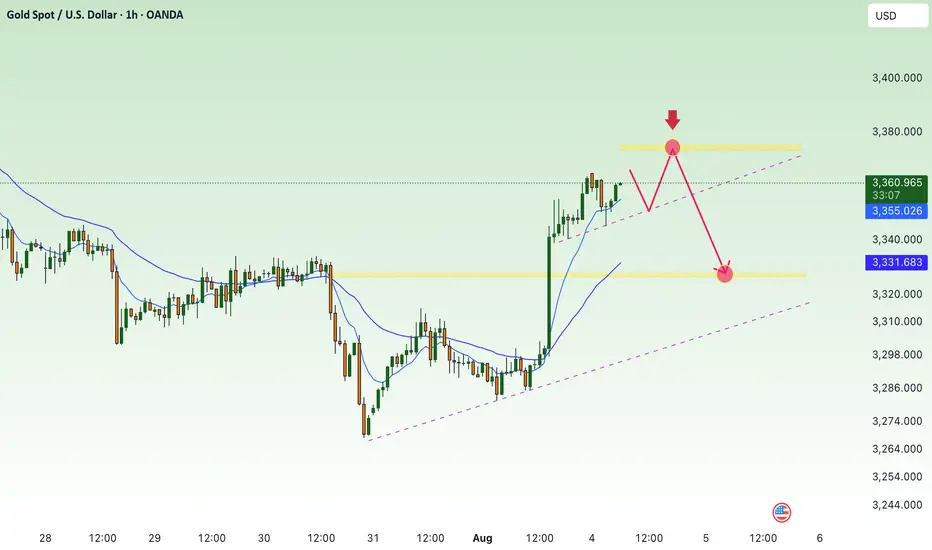
XAUUSD H1 - TRADING I’m quickly analyzing the turquoise trendlines on D1 and the others on H1, and I can determine that there will be a brief short reaction before continuing with the bullish trend.
GOLD (XAUUSD): Move Up Ahead?!
Friday's fundamentals made Gold very bullish during the New York session.
The price formed a high momentum bullish candle on a daily,
breaking a minor daily resistance area.
It gives us a confirmed Change of Character CHoCH and indicates
a highly probable bullish continuation next week.
I think that the price will reach 3400 level.
❤️Please, support my work with like, thank you!❤️
I am part of Trade Nation's Influencer program and receive a monthly fee for using their TradingView charts in my analysis.

GOLD Buyers In Panic! SELL!
My dear friends,
Please, find my technical outlook for GOLD below:
The instrument tests an important psychological level 3309.2
Technical Indicators: Supper Trend gives a precise Bearish signal, while Pivot Point HL predicts price changes and potential reversals in the market.
Target - 3296.9
Recommended Stop Loss - 3316.4
About Used Indicators:
Super-trend indicator is more useful in trending markets where there are clear uptrends and downtrends in price.
Disclosure: I am part of Trade Nation's Influencer program and receive a monthly fee for using their TradingView charts in my analysis.
———————————
WISH YOU ALL LUCK

GOLD Will Go Higher From Support! Buy!
Here is our detailed technical review for GOLD.
Time Frame: 12h
Current Trend: Bullish
Sentiment: Oversold (based on 7-period RSI)
Forecast: Bullish
The market is testing a major horizontal structure 3,311.57.
Taking into consideration the structure & trend analysis, I believe that the market will reach 3,369.04 level soon.
P.S
The term oversold refers to a condition where an asset has traded lower in price and has the potential for a price bounce.
Overbought refers to market scenarios where the instrument is traded considerably higher than its fair value. Overvaluation is caused by market sentiments when there is positive news.
Disclosure: I am part of Trade Nation's Influencer program and receive a monthly fee for using their TradingView charts in my analysis.
Like and subscribe and comment my ideas if you enjoy them!

Chart Type:* XAUUSD (Gold) – 15 min chart Pattern:AscendingHere’s a simpler breakdown with highlights:
---
*🟡 Chart Type:* XAUUSD (Gold) – 15 min chart
*📊 Pattern:* *Ascending Bullish Triangle*
---
*🔹 Key Highlights:*
- *Orange Line:* Rising *support* (buyers pushing price up)
- *Purple Zone:* Strong *resistance* area (price keeps rejecting)
- *Blue Arrow:* Suggesting a *breakout* to the upside
- *White Path:* Expected *price movement* if breakout happens
---
*🎯 Target Zone (Green Area):*
Where price may go if breakout is successful
*🛑 Stop-Loss Zone (Red Area):*
Where to exit trade if breakout fails
---
📝 Simple Explanation:*
Price is going up slowly and getting squeezed. If it breaks above the purple line, a *strong bullish move* is expected.

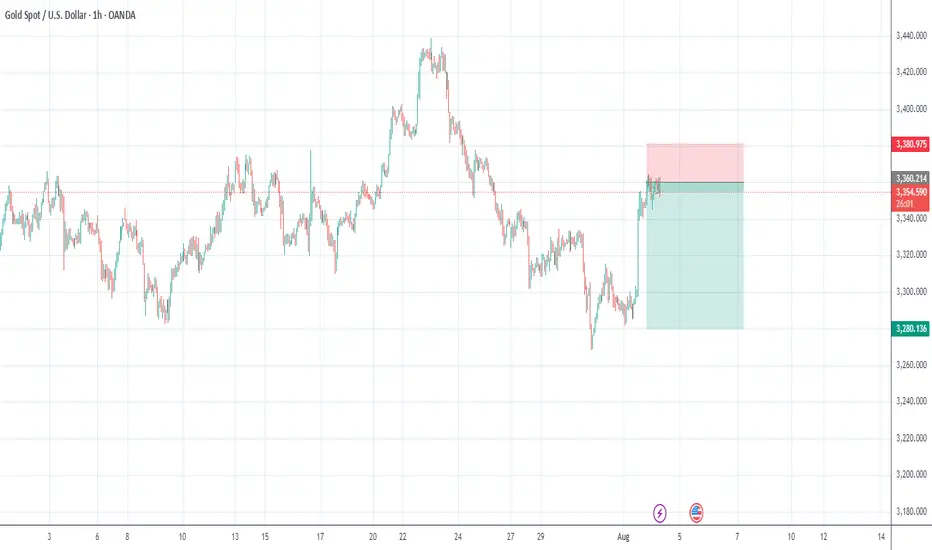
GOLD BEARS WILL DOMINATE THE MARKET|SHORT
GOLD SIGNAL
Trade Direction: short
Entry Level: 3,366.62
Target Level: 3,261.15
Stop Loss: 3,436.93
RISK PROFILE
Risk level: medium
Suggested risk: 1%
Timeframe: 1D
Disclosure: I am part of Trade Nation's Influencer program and receive a monthly fee for using their TradingView charts in my analysis.
✅LIKE AND COMMENT MY IDEAS✅

Risk Capacity: The Real Reason Traders Blow Accounts | Ep. 4In this pre-recorded video, I unpack one of the most overlooked reasons why traders blow their accounts over and over again, and it’s not about your system, strategy, or signal.
It’s about risk capacity, the internal threshold your nervous system can handle before fear, greed, or shutdown kicks in.
This is part of my ongoing series on YouTube “Rebuilding the Trader Within”, where I reflect on the emotional and psychological dimensions of trading that no indicator can fix.
If you've ever found yourself repeating the same mistakes, feeling stuck at the same equity level, or losing composure in high-stakes trades... this might be the pattern underneath it all.
I'm still learning too, and I’d love to hear your thoughts. Drop a comment — let’s grow together.
#RiskCapacity #TradingPsychology #TraderMindset #RebuildingTheTraderWithin #ForexMentorship #TraderGrowth #InnerWork #ForexPsychology

XAUUSD (SHORT)
Price broker the trendline and had to come back to retest it to confirm breakout. We expecting bears to come in for fither sells.
NB:DXY correlating with GOLD direction as extra confirmation,

Gold looks like bearish move as the price hitting it resistance Gold is showing signs of a bearish move as the price tests its resistance zone. Sellers may take control if it fails to break above. Watch for confirmations before entering! 💹
#GoldAnalysis #XAUUSD #ForexTrading #BearishMove #ResistanceLevel"
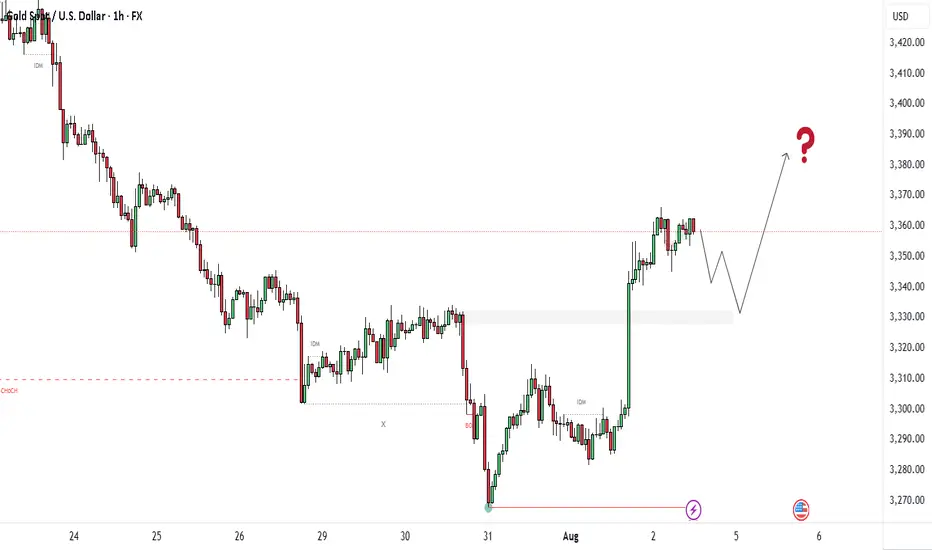
GOLD/USD – 1H ChartGold has recently shown a clear Change of Character (CHoCH) near the 3275 level, signaling a potential shift from bearish to bullish momentum. After a strong downtrend, the market formed a base and then launched an aggressive bullish rally, breaking previous structure and indicating a possible trend reversal. Currently, price is consolidating around the 3350–3360 zone, just above a key demand zone between 3330 and 3340, which is likely to act as a support area. This zone also aligns with a previous supply area that has now flipped into demand, confirming smart money interest.
The projected move shows a potential short-term dip into this demand zone before continuing the upward push toward the 3370–3390 range, where buy-side liquidity is likely resting. This level could act as a near-term target or resistance. If price holds above 3330 and shows bullish confirmation (like an engulfing pattern or FVG reaction), buyers could look for opportunities with targets near 3370 and 3390. However, if the price breaks below 3330 with strong bearish momentum, the bullish bias may be invalidated, and we could see further downside.
Overall, the structure is bullish, but traders should watch for a retest of the demand zone before entering long positions. Risk should be managed carefully with stops below 3330.
What You Should Watch:
Entry confirmation around 3,335–3,340 with bullish engulfing or FVG reaction
Set TP1 = 3,370
TP2 = 3,390
SL = Below 3,330
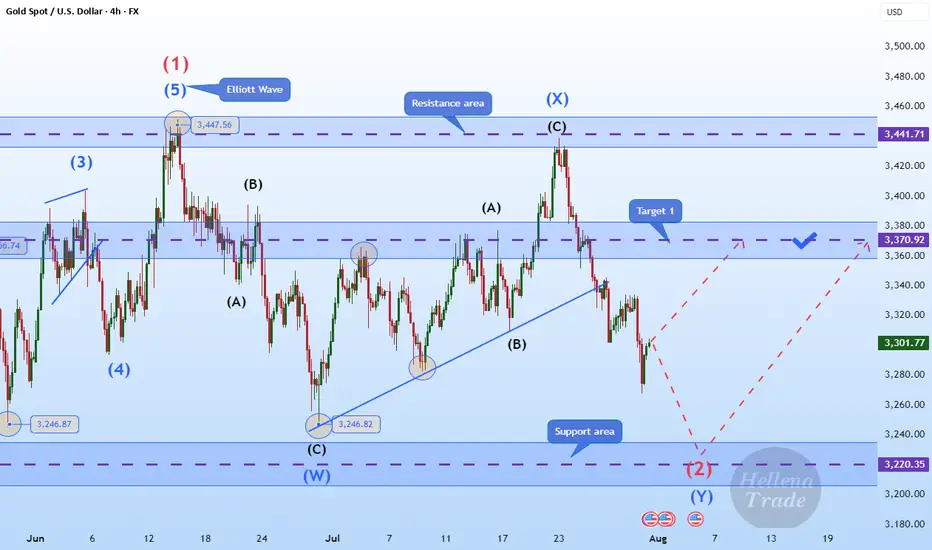
Hellena | GOLD (4H): LONG to area of 3370 (Wave 2).Colleagues, gold is once again disrupting our plans, and I have to revise the wave marking. It's not easy, but the most important thing is to keep doing it.
Now I'm back to the previous marking — the price is in wave “2” correction.
To complete this wave, the price needs to overcome the level of wave “W” of the middle order 3246.82. Then the correction will be completed and wave “3” will begin an upward movement.
I see the minimum target in the area of the 3370 level.
Manage your capital correctly and competently! Only enter trades based on reliable patterns!
Gold's Strong Moves: Will the Bears Take Over?Hello everyone, Kevinn here!
Today, gold continues to experience significant fluctuations in the new week, with XAU/USD currently hovering around 3,325 USD. Amid the strong rise of the USD, the gold market has seen a sharp adjustment. However, the medium-term trend still seems to favor the bears.
The main reason for the turbulence in gold prices is the strengthening of the U.S. dollar, following strong economic news from the U.S. that points to a clear recovery. The stronger USD has made gold more expensive for international investors. Additionally, the market is awaiting further moves from the Fed regarding interest rate policies, which is limiting the flow of capital into gold.
Looking at the technical chart, we can see that although gold has shown a slight uptick, bearish pressures are still lurking. Indicators and patterns suggest that gold may break its rising price channel, with a high likelihood of further declines. The next support level could be around 3,310 USD, and if broken, gold may continue to fall toward 3,300 USD or lower.
Based on the signals from the chart, ENTRY 1 strategy would be to sell when the price breaks the upward channel. Additionally, if the price pulls back to the upper limit zone, ENTRY 2 could present another potential selling point.
For today's strategy, I expect gold to decrease. What do you think? Share your thoughts in the comments!

Bulls continue to be active following NFP data⭐️GOLDEN INFORMATION:
Gold (XAU/USD) slips toward $3,360 in early Asian trading on Monday, snapping a two-day winning streak. However, disappointing U.S. job data and lingering tariff concerns could pressure the U.S. Dollar and help cushion the downside for the Dollar-denominated metal.
The yellow metal is under pressure from a recovering Greenback, though gains may remain capped as weaker-than-expected Nonfarm Payrolls (NFP) data has strengthened expectations of a Federal Reserve rate cut in the near term.
⭐️Personal comments NOVA:
Buyers maintained early in the week, continuing to move towards higher resistances: 3374, 3387
⭐️SET UP GOLD PRICE:
🔥SELL GOLD zone: 3374- 3376 SL 3381
TP1: $3365
TP2: $3350
TP3: $3333
🔥BUY GOLD zone: $3328-$3326 SL $3321
TP1: $3335
TP2: $3348
TP3: $3360
⭐️Technical analysis:
Based on technical indicators EMA 34, EMA89 and support resistance areas to set up a reasonable BUY order.
⭐️NOTE:
Note: Nova wishes traders to manage their capital well
- take the number of lots that match your capital
- Takeprofit equal to 4-6% of capital account
- Stoplose equal to 2-3% of capital account
Gold Holds the Trendline - Eyes on the Range HighGold remains range-bound but is climbing off the range low with strong bullish momentum. Price is respecting the trendline and could stage a move toward the top of the range. A minor pullback may offer the best entry opportunity before momentum takes it higher. This setup favors buying the dip as long as the trendline holds.

GOLD awaiting confirmation of a bullish zone formation.Gold has confirmed support at 3310, with the price rebounding and returning to the buying side. We are now awaiting confirmation of a bullish zone formation.
Gold remains under pressure ahead of key market-moving events, including the US GDP data release and the Federal Reserve’s interest rate decision. However, the pause in Dollar strength is offering some support to the gold price. As long as the price holds above this level, the bullish scenario remains valid. A sustained move above this zone may open the path toward the next resistances: 3360 / 3385 we can expect Growth more.
You May find more Details in the Chart.
Trade wisely best of Luck Buddies.
Ps: Support with like and comments for more insights Thanks for Supporting.

NFP quick buy moveGold (XAUUSD) forms support near 3,262 with a potential bullish move expected on NFP news. Targeting 3,443 resistance zone for a quick buy opportunity.
