XAUUSD August 2025 Monthly OutlookWelcome to August — and welcome to the top of the macro ladder. Gold is not just rising. It’s rewriting structure.
🔸 Macro & Fundamentals
Gold opens August with a fresh impulsive breakout above $3360, fuelled by a weaker USD, rising global risk sentiment, and continued speculative positioning from institutional buyers. The upcoming Jackson Hole meeting and shifting Federal Reserve expectations create the perfect climate for volatility. All eyes are now on the premium structure top — but will gold expand beyond it or retrace to refill?
🔸 Monthly Trend & Bias (HTF Overview)
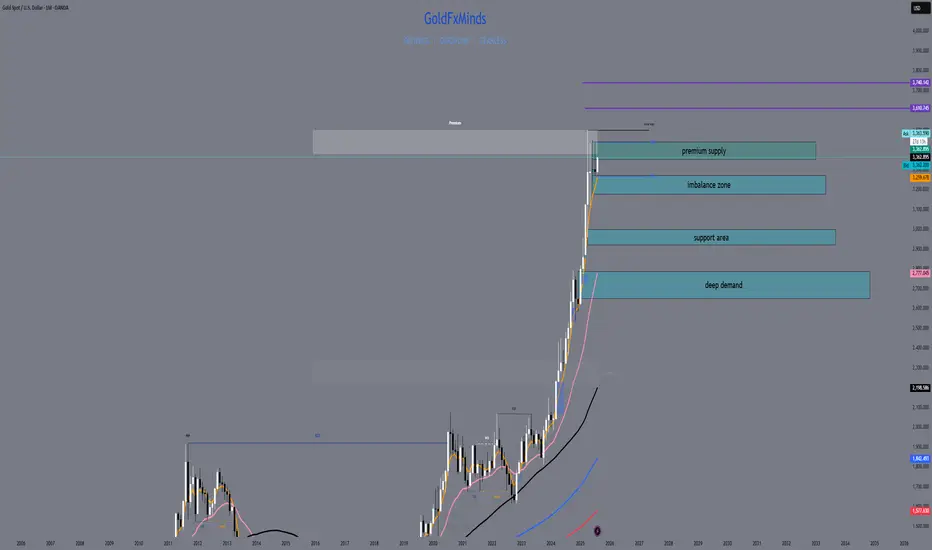
🔹 Structure: Clean bullish BOS, continuation leg in progress
🔹 Last CHoCH: April 2023 → Confirmed full trend shift bullish
🔹 Current Monthly Candle: Explosive push into supply with top wick rejection beginning to show
🔹 Bias: Still bullish but in extreme premium — watch for cooling/rebalancing
🔸 EMA Structure
| EMA Type | Status | Signal |
| ----------- | -------------- | ------------------------------------- |
| EMA 5 / 21 | Strong Bullish | Dynamic expansion, steep angle upward
| EMA 50 | Below | Clean breakout from range
| EMA 100/200 | Far below | Long-term uptrend deeply intact
🔸 Key HTF Levels (Wick-to-Wick Mapping)
Zone Type Price Range Confluences
🔴 Premium Supply 3350 – 3439 Monthly FVG + Wick exhaustion + RSI 80+
🔵 Bullish Imbalance 3180 – 3270 Monthly FVG + old BOS + EMA5 baseline
🔵 Mid-Level Support 2920 – 3000 Monthly OB + FVG + structure base
🔵 Deep Demand 2670 – 2780 HTF equilibrium zone + RSI support
✅ The current candle has pierced into the final wick supply, but with clear signs of loss in momentum.
⚠️ If 3439 breaks cleanly, next expansion zone opens toward 3505 → 3610 (Fibonacci projection). Otherwise, expect cooling to 3270–3180 first.
🔸 Fibonacci Context
🔻 Swing Low: 1810
🔺 Swing High: 3439
🎯 Current price ($3363) sits just below the 100% Fibonacci projection, with the 1.272 and 1.618 extensions at 3610 and 3740.
This confirms we are in a macro premium, and any long positions from here forward must be built only on strong LTF confirmation or clean pullbacks into value.
🔸 August Scenarios
🟢 Scenario 1 – Breakout + Price Discovery
If bulls break 3439 with strong volume and close:
New leg toward 3505 → 3610 opens
Watch for LTF continuation on H4–D1 with bullish OB reentry
Only valid if 3350 holds as new support
🔻 Scenario 2 – Rejection + Healthy Pullback
If price holds below 3439 and monthly wick exhausts:
Clean retracement toward 3270 → 3180 expected
EMA5/21 rebalancing will support bullish structure
Deeper rejection could retest 3070 zone if volatility spikes
🔸 Conclusion & Action Plan
We open August fully inside the last monthly supply zone. Trend is still bullish, but RSI, FVGs, and EMA distance warn us: this is not the time to chase — it’s time to wait for structure to speak.
📌 Key pivot = 3439.
Above it → Expansion.
Below it → Retracement.
Let August unfold — but stay sharp. The next big move will be born from this compression.
—
What’s your take — are we just getting started or about to cool off?
Drop your thoughts, chart it out, and stay ready for what August brings. ⚔️
—
❤️ Like if you enjoy clean, actionable updates🚀🚀🚀
🔁 Share with traders who love structure over noise
With clarity, confidence, and control,
GoldFxMinds
XAUUSD trade ideas
XAUUSD (Gold) Intraday/Swing Trading Plan – Tuesday, 5th August Timeframe: M30 (30-Minute)
Strategy Type: Structured Buy-the-Dip with Staggered Take Profits
Market Bias: Bullish
Risk Profile: Moderate Risk, Medium Holding Duration
Trade Style: Intraday Momentum + Short Swing
🧠 Market Structure & Context
Gold continues to show a strong upward momentum in early August, with the M30 chart printing higher highs and higher lows consistently. Monday’s session closed with bullish strength above key psychological zones, suggesting the uptrend remains intact. Price is currently retracing after an impulsive move, providing a prime opportunity for a clean entry.
The M30 structure also shows a tight bullish channel, and pullbacks into confluence zones have proven to be reliable buy areas. The plan will focus on timing re-entries after each impulse leg to ride multiple profit waves toward higher targets.
🔍 M30 Trading Plan Breakdown
✅ Phase 1: Buy on Retracement to 3379 (Primary Entry Zone)
Entry Zone: 3379
Why:
Key support zone from previous structure breakout
Near 50% Fibonacci retracement of prior impulse
Price-action pivot zone where buyers stepped in Monday
Confirmation to Enter:
Bullish engulfing or hammer on M30
RSI bounce above 40–45
Price closes back above dynamic support (50 EMA)
Stop Loss:
Below 3369 (10 pips buffer beneath structure)
🎯 Target 1: 3395
Reasoning:
Short-term resistance from Monday NY session wick high
Completion of first impulse move (~1.5R target)
Action:
Take 30–40% profit
Move SL to breakeven or trail slightly below new support at 3385
Wait for pullback to enter Phase 2
✅ Phase 2: Re-Entry After Pullback (Post-3395)
Retracement Zone: 3388–3390 (bullish flag / higher low expected)
Re-Entry Trigger:
Tight consolidation followed by bullish breakout on M30
RSI remains above midline; MACD crossover confirmation optional
🎯 Target 2: 3418
Why:
Next resistance zone based on price rejection in late July
Also aligns with intraday Fibonacci extension (1.272 of the first wave)
Strong psychological + structural zone
Action:
Take 30–40% more profit
Adjust trailing SL to 3398 or dynamic support based on EMA
Monitor for pullback to hold or fade
✅ Phase 3: Final Position Hold or Re-Add on Pullback
Retracement Zone: 3405–3408 (previous resistance turned support)
Entry/Scaling Condition:
Price respects the new support zone and prints continuation candle
M30 volume and momentum remain positive
🎯 Target 3: 3443
Why:
Key psychological level near 3440–3450 resistance
Top of projected trend channel and potential supply zone
Excellent exit zone before possible reversal or profit-taking by institutions
Action:
Close remaining 20–30% of position
Optional: Watch for breakout >3443 for longer swing continuation if fundamentals align
⚠️ Risk Management Notes
Max risk per full plan: 1.5–2% of account
SLs strictly enforced at each entry
No entry during high-impact news spikes (check economic calendar)
Never chase — only execute on confirmed candle setups and risk-reward compliance
🔁 Summary Table
Phase Buy Level Target SL Action
Phase 1 3379 3395 3369 Take 30–40%, trail SL
Phase 2 3388–3390 3418 3379 Take 30–40%, trail SL
Phase 3 3405–3408 3443 3395 Take final 20–30%, full exit
📊 Indicators Used
50 EMA / 200 EMA: Confirm trend and support
RSI (14): Trend strength and bounce signal
MACD: Confirmation of momentum continuation
Volume: Increased buy-side volume confirms valid breakout after retracement
🕒 Session Timing Considerations
Asian Session: Wait for price to dip to 3379 — ideal entry zone
London Open (3pm SG time): Look for breakout toward 3395
New York Open (8:30pm SG time): Strong move possible to 3418 or 3443 depending on momentum and news catalysts

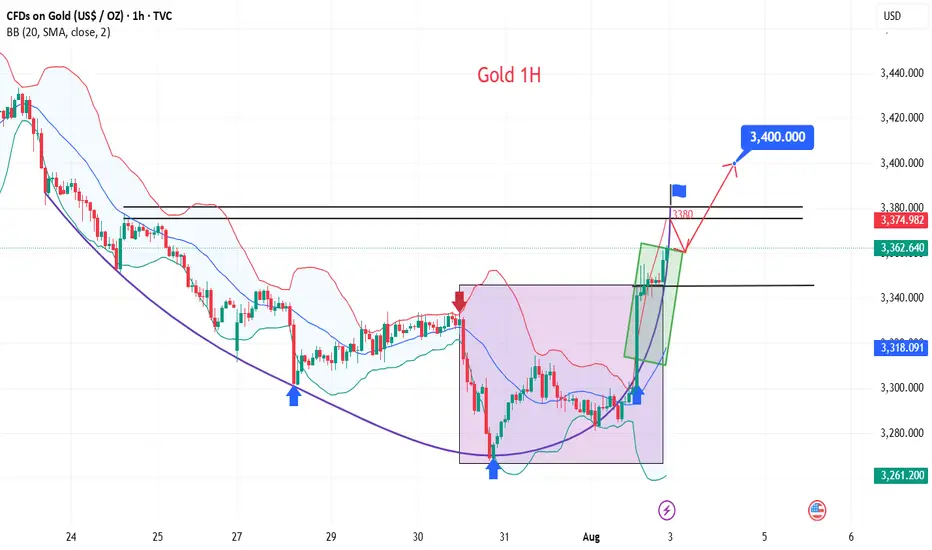
GOLD in 1HHello to all traders. 😎😎
I hope all your deals will hit their targets. 🎉🎉
On the first day of August, gold surged strongly due to news about tariffs imposed by Trump on imported goods. It gained nearly $60 in a single powerful candle.
Currently, I expect a pullback from the $2362–$2370 range down to around $2347–$2352, followed by a potential rebound back to $2370.
⚠️⚠️⚠️⚠️Don’t forget to apply proper risk management!
What Do You Think?
Which scenario do you think is happen? **Share your thoughts!** ⬇️
Don't forget that this is just an analysis to give you an idea and trade with your own strategy. And don't forget the stop loss🛑🛑🛑
❤️❤️❤️The only friend you have in financial markets is your stop loss❤️❤️❤️
Please support me with your ✅' like'✅ and comments to motivate me to share more analysis with you and share your opinion about the possible trend of this chart with me 🙏😊
Be Happy , Ali Jamali
GOLD Will Go Higher From Support! Buy!
Here is our detailed technical review for GOLD.
Time Frame: 12h
Current Trend: Bullish
Sentiment: Oversold (based on 7-period RSI)
Forecast: Bullish
The market is testing a major horizontal structure 3,311.57.
Taking into consideration the structure & trend analysis, I believe that the market will reach 3,369.04 level soon.
P.S
The term oversold refers to a condition where an asset has traded lower in price and has the potential for a price bounce.
Overbought refers to market scenarios where the instrument is traded considerably higher than its fair value. Overvaluation is caused by market sentiments when there is positive news.
Disclosure: I am part of Trade Nation's Influencer program and receive a monthly fee for using their TradingView charts in my analysis.
Like and subscribe and comment my ideas if you enjoy them!

GOLD BEARS WILL DOMINATE THE MARKET|SHORT
GOLD SIGNAL
Trade Direction: short
Entry Level: 3,366.62
Target Level: 3,261.15
Stop Loss: 3,436.93
RISK PROFILE
Risk level: medium
Suggested risk: 1%
Timeframe: 1D
Disclosure: I am part of Trade Nation's Influencer program and receive a monthly fee for using their TradingView charts in my analysis.
✅LIKE AND COMMENT MY IDEAS✅

Manipulation Completed – Gold May Be Entering Expansion Phase ToLast week’s candle showed a clear manipulation pattern, as price 🔻 swept the liquidity below the lows of the previous three weekly candles. Immediately after the sweep, the market responded with strong bullish momentum 🔼 — a strong indication that order flow has shifted.
📈 This Week’s Outlook:
Gold may be entering a bullish expansion phase.
The current weekly candle is expected to be a strong bullish candle.
Next target: swing high liquidity around 3438.
📊 Today’s Development:
After clearing the previous weekly high (~3363),
Both the Asian and European sessions are consolidating, forming a clear accumulation range.
🧭 Expansion Scenario:
If this is indeed an expansion phase, a deep pullback may not occur before price moves higher.
I anticipate the New York session will sweep the prior sessions,
Forming the daily low (and possibly weekly low) around 333x.
A deeper pullback toward 331x is still possible before a rally begins.
🔹 Trading Plan for Today:
✅ Consider an early long entry near the 333x zone,
⚠️ Only if a clear CISD signal appears on M15
(M30 or H1 confirmation is preferred – focus during New York session)
📌 Be patient and observe price behavior –
⛔ Avoid entering without clear confirmation

XAUUSD (SHORT)
Price broker the trendline and had to come back to retest it to confirm breakout. We expecting bears to come in for fither sells.
NB:DXY correlating with GOLD direction as extra confirmation,

Risk Capacity: The Real Reason Traders Blow Accounts | Ep. 4In this pre-recorded video, I unpack one of the most overlooked reasons why traders blow their accounts over and over again, and it’s not about your system, strategy, or signal.
It’s about risk capacity, the internal threshold your nervous system can handle before fear, greed, or shutdown kicks in.
This is part of my ongoing series on YouTube “Rebuilding the Trader Within”, where I reflect on the emotional and psychological dimensions of trading that no indicator can fix.
If you've ever found yourself repeating the same mistakes, feeling stuck at the same equity level, or losing composure in high-stakes trades... this might be the pattern underneath it all.
I'm still learning too, and I’d love to hear your thoughts. Drop a comment — let’s grow together.
#RiskCapacity #TradingPsychology #TraderMindset #RebuildingTheTraderWithin #ForexMentorship #TraderGrowth #InnerWork #ForexPsychology

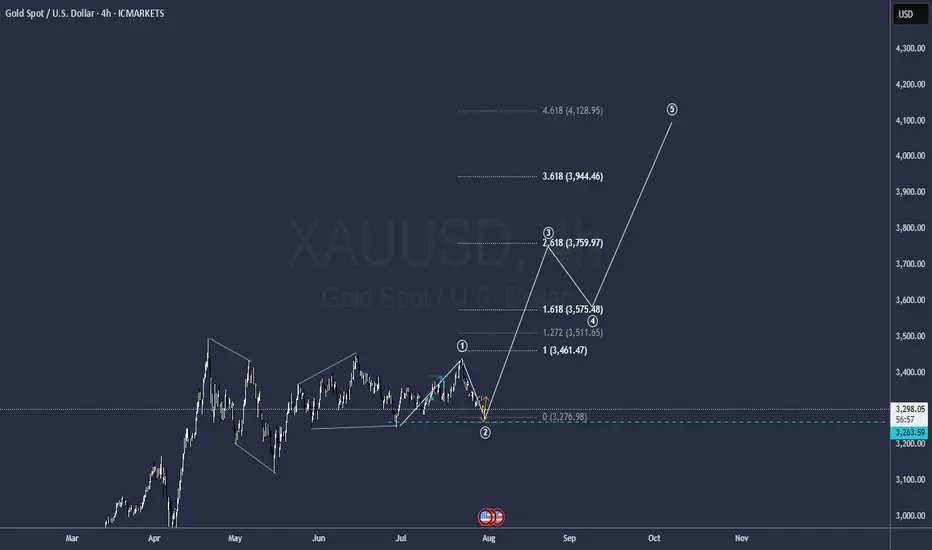
GOLD to all time highsIt is ready
a bitch wave one correction seems to be over so get ready to hit 4.000
GG
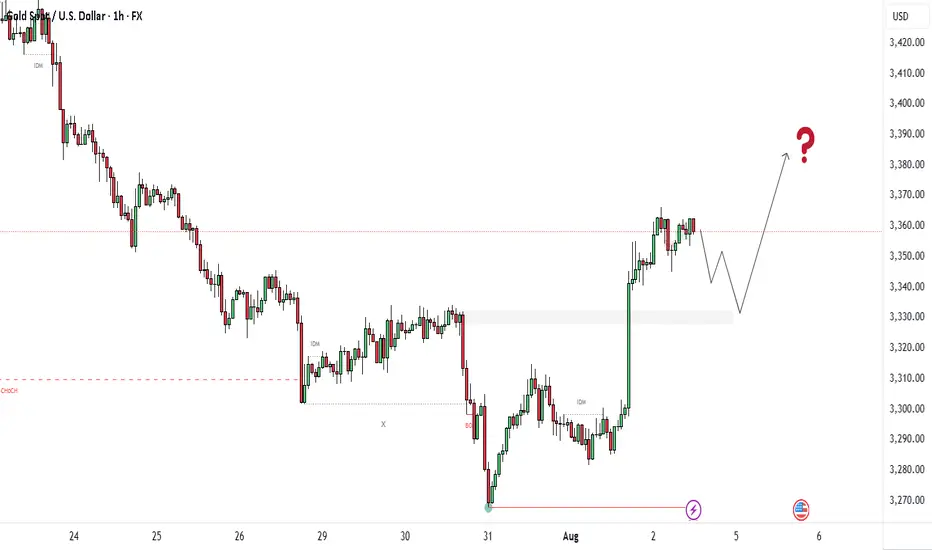
GOLD/USD – 1H ChartGold has recently shown a clear Change of Character (CHoCH) near the 3275 level, signaling a potential shift from bearish to bullish momentum. After a strong downtrend, the market formed a base and then launched an aggressive bullish rally, breaking previous structure and indicating a possible trend reversal. Currently, price is consolidating around the 3350–3360 zone, just above a key demand zone between 3330 and 3340, which is likely to act as a support area. This zone also aligns with a previous supply area that has now flipped into demand, confirming smart money interest.
The projected move shows a potential short-term dip into this demand zone before continuing the upward push toward the 3370–3390 range, where buy-side liquidity is likely resting. This level could act as a near-term target or resistance. If price holds above 3330 and shows bullish confirmation (like an engulfing pattern or FVG reaction), buyers could look for opportunities with targets near 3370 and 3390. However, if the price breaks below 3330 with strong bearish momentum, the bullish bias may be invalidated, and we could see further downside.
Overall, the structure is bullish, but traders should watch for a retest of the demand zone before entering long positions. Risk should be managed carefully with stops below 3330.
What You Should Watch:
Entry confirmation around 3,335–3,340 with bullish engulfing or FVG reaction
Set TP1 = 3,370
TP2 = 3,390
SL = Below 3,330
Gold-Buy ScenarioChange of structure, ABC retracement formation, Inverse Heed and shoulders formation and bullish flag formation

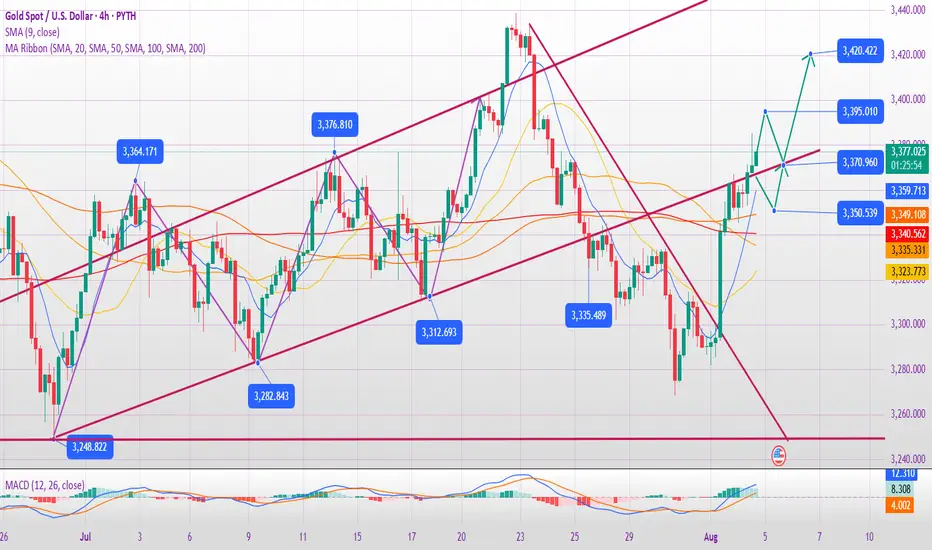
XAUUSD 4Hour TF - August 3rd,2025🟦 XAUUSD 4H Analysis Long Idea
📅 August 3rd, 2025
🔹 Top-Down Trend Bias:
• Monthly – Bullish
• Weekly – Bullish
• Daily – Bullish
• 4H – Bullish
Price has broken out of a consolidation, confirming short term bullish momentum in alignment with the higher timeframes. We’re now watching how price reacts on a potential retest of the key $3,320 structure.
🔍 Key Level: $3,320
This former resistance now acts as a critical support zone. How price reacts here will determine short-term direction.
✅ Scenario A: Bullish Continuation
Clean retest of $3,320–$3,335
1.Look for bullish confirmation: wick rejections, bullish engulfing, or lower timeframe structure shift
Target 1: $3,395
Target 2: $3,450
This setup aligns with the overall bullish bias. We have ideal R:R with a clear invalidation to exit on if $3,320 fails as support.
⚠️ Scenario B: Bearish Rejection
1.Failure to hold $3,320 = potential trap breakout
2.Look for structure below $3,320 + bearish conviction
Target: $3,225 support zone
Only valid if $3,320 flips to resistance and confirms structure shift.
🧠 Final Notes
• Let price confirm the setup
• Structure > emotion
• Both scenarios are valid, but only with confirmation

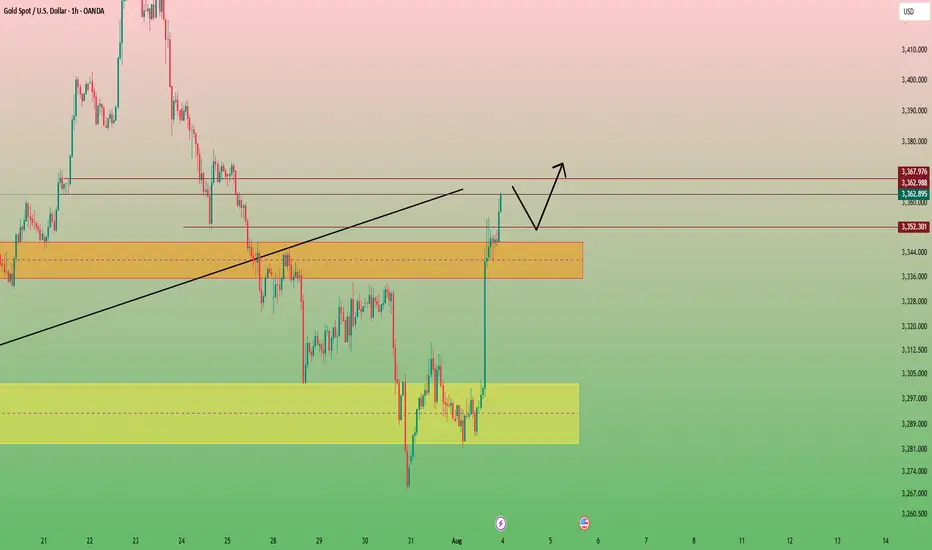
Gold Holds the Trendline - Eyes on the Range HighGold remains range-bound but is climbing off the range low with strong bullish momentum. Price is respecting the trendline and could stage a move toward the top of the range. A minor pullback may offer the best entry opportunity before momentum takes it higher. This setup favors buying the dip as long as the trendline holds.

Analysis For The Next WeekHello Traders,
I hope you had joyful weekend, the market is going to open tonight so we are back with new idea for next week.
As you know gold was dropping for last two weeks and suddenly pumped almost 650 pips after the impact of NFP News. We saw the high pressure in the market on Friday due to news impact.
Gold has broken the buy trend line D1,H4. According to D1,H4 gold still wants to drop till 3251.
If price respects area 3372-3393, then gold will drop. If price breaks the area 3400 then it will pump and it can make another All Time High. As you know 3501 is the All Time High (ATH). Price can break if there will be a breakout for bullish moment.
Keep in touch and drop positive comments here, Thanks.

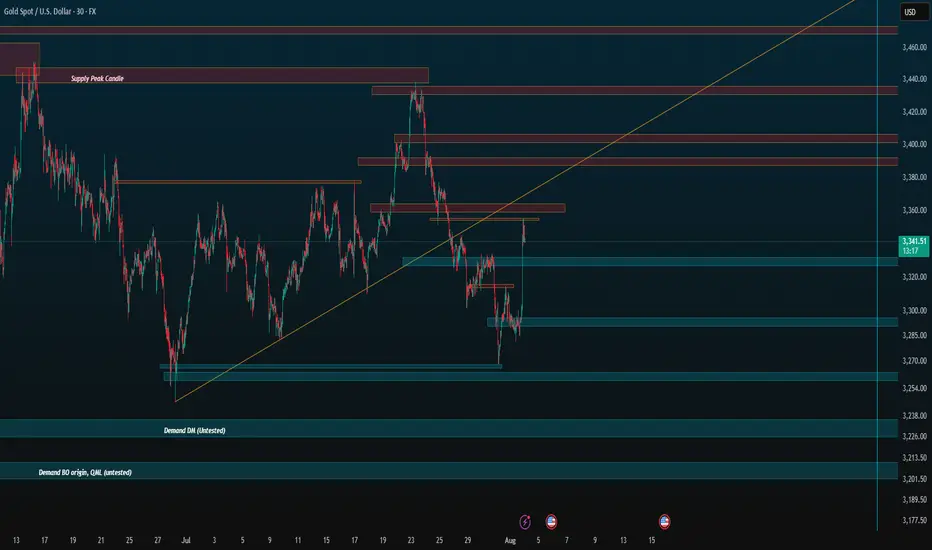
Zones for the rest of August (if no ATH)Just simple zones, ignore. I want to compare to the end of the month later.
Keep trading simple. These are the zones I made after drawing from 4H all the way to 5 minute candle for precision. I already have my own speculation but feel free to use it for your own.
Goodbye, trade safe.
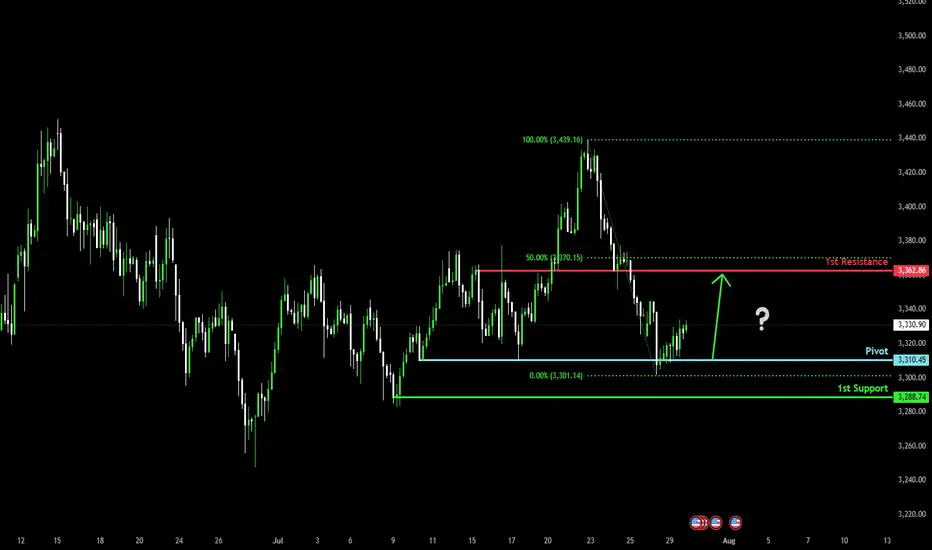
Bullish bounce off?The Gold (XAU/USD) has bounced off the pivot, which acts as a multi-swing low support and could rise to the 1st resistance, which is slightly below the 50% Fibonacci retracement.
Pivot: 3,310.45
1st Support: 3,288.74
1st Resistance: 3,362.86
Risk Warning:
Trading Forex and CFDs carries a high level of risk to your capital and you should only trade with money you can afford to lose. Trading Forex and CFDs may not be suitable for all investors, so please ensure that you fully understand the risks involved and seek independent advice if necessary.
Disclaimer:
The above opinions given constitute general market commentary, and do not constitute the opinion or advice of IC Markets or any form of personal or investment advice.
Any opinions, news, research, analyses, prices, other information, or links to third-party sites contained on this website are provided on an "as-is" basis, are intended only to be informative, is not an advice nor a recommendation, nor research, or a record of our trading prices, or an offer of, or solicitation for a transaction in any financial instrument and thus should not be treated as such. The information provided does not involve any specific investment objectives, financial situation and needs of any specific person who may receive it. Please be aware, that past performance is not a reliable indicator of future performance and/or results. Past Performance or Forward-looking scenarios based upon the reasonable beliefs of the third-party provider are not a guarantee of future performance. Actual results may differ materially from those anticipated in forward-looking or past performance statements. IC Markets makes no representation or warranty and assumes no liability as to the accuracy or completeness of the information provided, nor any loss arising from any investment based on a recommendation, forecast or any information supplied by any third-party.
NFP quick buy moveGold (XAUUSD) forms support near 3,262 with a potential bullish move expected on NFP news. Targeting 3,443 resistance zone for a quick buy opportunity.

Is Gold 3400 Still Far Away?
💡Message Strategy
The spot gold market experienced a V-shaped reversal trend.Driven by unexpectedly weak U.S. non-farm payrolls data and risk aversion triggered by Trump's new tariff policy, gold prices rose nearly 2% on Friday to a one-week high of $3,347.66 per ounce, up 0.4% for the week. The Federal Reserve kept interest rates unchanged, but weak employment data rekindled expectations of a September rate cut, increasing the appeal of gold as a non-yielding asset.
At the same time, Trump's decision to impose tariffs of 10%-41% on many countries has exacerbated market concerns about global trade tensions and boosted the safe-haven demand for gold.
📊Technical aspects
The 1-hour moving average of gold has begun to turn upward, and the 1-hour moving average of gold has a double bottom structure. However, gold should not have such a large pullback for the time being. After the non-farm payrolls on Friday, gold fell back to the 3335 line and then began to fluctuate upward at a high level. The 3335-3345 area was also an important platform support in the early stage. Therefore, gold will mainly be bought on dips above 3335 next week.
💰Strategy Package
Long Position:3345-3355,SL:3325,Target: 3380-3400

Weekly Trend Radar1. Macro Market Overview
Last week, the Federal Reserve kept interest rates unchanged, as widely expected. The decision was fully priced in, and the press conference offered no surprises: future rate cuts will depend on incoming economic data.
Markets initially reacted with a decline, but I do not see a structural break in the uptrend for commodities. It looks more like a healthy cooldown before the next leg higher .
However, the equity market is showing signs of deeper weakness . Historically, August tends to be a challenging month for stocks, and what we may be witnessing now is not a short-term correction but the early stages of a major downtrend.
Cryptocurrencies followed equities lower due to their high-beta, risk-on nature, but similar to metals, I believe the correction is temporary and the broader uptrend remains intact.
In energy markets, oil remains volatile — no clear setup for a long position yet. Natural gas has reached support and may offer a cautious long opportunity, though the medium-term trend is still bearish.
Overall, global markets are holding key levels, except for equities, which now look the weakest.
2. Metals
Buy the Dip!
🥇Gold
Gold ended the week slightly higher — a strong performance considering the broader market weakness. Its resilience highlights its role as a safe-haven asset. The bullish trend remains intact, and institutional support appears to be holding.
Trend: Bullish
Key Levels: Support at 3245, resistance at 3450
Position: Looking for a long entry next week
🥈Silver
A more volatile asset compared to gold, silver has pulled back but remains within its bullish trend. Friday’s daily candle showed promise, bouncing from the 50-day moving average. Despite not closing above Thursday’s high, the setup is constructive.
Trend: Bullish
Key Levels: Support at 36.30, resistance at 38.00
Position: Long, stop below Friday’s low at 36.30. New entries still valid.
⚪️Platinum
Similar structure to silver. Friday’s reversal candle signals potential continuation of the bullish move.
Trend: Bullish
Key Levels: Support at 1280, resistance at 1480
Position: Long, with stop below Friday’s low. Valid setup for new positions.
🔘Palladium
Strong technical picture even without a test of the 50-day MA. Remember — these MAs are not entry signals, but trend indicators. Entry is based on confluence, not location alone. And it would be nice to finally see parity with platinum.
Trend: Bullish
Key Levels: Support at 1185, resistance at 1260, 1310, 1340, 1370
Position: Planning to enter long at Monday’s open if the market is supportive. No entry if risk-off sentiment dominates.
🟠Copper
Copper is one of the most compelling setups this week. After a sharp 25% decline, it remains in an overall uptrend. Friday’s bullish candle on the daily chart is promising. A potential new rally may start from here.
Trend: Bullish
Key Levels: Support at 4.35, resistance at 5.15
Position: Planning to enter at Monday’s open, stop below Friday’s low.
3. Energy Markets
🛢️Crude Oil
I'm leaning toward a long setup, but Friday’s red candle on the daily chart signals the need for caution. Waiting for a clear reversal candle before entry.
Trend: Bullish
Key Levels: Support at 68.30, resistance at 72.68, 75.00, 77.70
Position: Waiting for lower volatility and confirmation from daily chart structure.
🔥Natural Gas
The asset has reached a strong support zone. Daily candles are starting to form a potential bottoming pattern, but we need to break through resistance at 3.20 to gain confidence.
Trend: Bearish (medium-term)
Key Levels: Support at 3.00, resistance at 3.20, 3.35, 3.65
Position: Cautious long, small size. Stop-loss is wide, so risk management is key.
4. S&P 500
📉I believe we are entering a major downtrend in the stock market. This is not just a correction — it's likely the beginning of a more sustained decline. I’m shifting my bias to short.
Trend: Bearish
Key Levels: Support at 6150; resistance at 6430
Position: Waiting for short opportunity.
5. Bitcoin
₿Bitcoin followed the equity market lower. The trend is still technically bullish, but the recent risk-off tone in equities warrants caution. Crypto is not a defensive asset and tends to experience sharper drawdowns.
That said, I do not expect another prolonged "crypto winter." Institutional involvement has improved market depth and liquidity, reducing the severity of future crashes — though volatility will remain elevated.
Trend: Bullish
Key Levels: Support at 112.000; resistance at 117.000, 121.000, 123.300
Position: Long, stop below Friday’s low. Act with caution.

Be in Lon Position for GOLDDears
After breakout red zone we can fill buy order with small stop lose for big target.

Will gold break through on August 5th?
1. Key News Drivers
✅ Expectations of a Fed Rate Cut Strengthen (Core Logic)
Weak non-farm payroll data (the probability of a September rate cut soars to 90%) leads the market to anticipate two rate cuts this year, with the first likely in September.
The US dollar weakens: expectations of interest rate cuts suppress the US dollar, and the attractiveness of gold as an interest-free asset increases.
✅ Rising risk aversion
Trump's tariff policy has sparked trade concerns, compounded by global economic uncertainty (such as a slowdown in Europe and geopolitical risks).
Fragile market sentiment: If subsequent economic data (such as CPI and retail sales) falls short of expectations, gold could rally further.
⚠️ Risk Warning: If Fed officials signal hawkishness (such as downplaying rate cuts) or if economic data rebounds, gold could experience a short-term correction.
2. Key Technical Signals
📈 Bullish Trend Confirmation Conditions:
A break above $3,375 (previous resistance level) opens up upside potential, with targets between $3,390 and $3,400, or even $3,450. Hold the support of 3335 (bull defense line). If the pullback does not break this level, the trend will remain strong.
📉 Pullback Risk Warning:
If 3335 is broken, a pullback to 3300 (a key psychological barrier) is possible, turning into a volatile market.
4-hour chart is overbought: Be wary of short-term profit-taking after consecutive days of gains.
🔍 Key Levels:
Resistance: 3375 → 3390-3400 → 3450
Support: 3360-3350 → 3335 → 3300
3. Today's Trading Strategy
🎯 Main Strategy: Buy on pullbacks (low-cost buying), supplemented by shorting at key resistance levels.
👉 Long Opportunities:
Conservatives: Enter after a pullback to 3360-3350 and stabilization. Stop loss at 3340, target at 3380-3390.
Aggressive: If it breaks through 3375, go long with a light position, set a stop-loss at 3360, and target 3400.
👉 Short Opportunities:
Short if it first hits the 3390-3400 range and finds resistance, set a stop-loss at 3410, and target 3375-3360.
⚠️ Notes:
Avoid chasing the ups and downs, and wait for key levels to be confirmed.
If it falls below 3335, pause long positions and wait for support at 3300 before repositioning.
4. Medium- to Long-Term Outlook
Bull Market Start Signal: A weekly break above 3400 could confirm the start of the Fed's rate cut cycle.
Potential target: 3500-3600 (historical high area).
Risks: If US economic data improves or the Fed turns hawkish, gold could experience a deep correction to 3200-3150.
Summary
Short-term outlook: 3375 is the dividing line between bulls and bears. If it breaks through, go long; if it hits resistance, trade in a range.
Medium- to long-term: Focus on Fed policy and economic data. Trend-setting long positions should wait for clearer signals.
📌 Action suggestion: Give priority to callback of long orders during the day, strictly set stop-loss, and be wary of high-level shocks and washouts!
TRADE UPDATE XAUUSD Hey everyone at the start of the week we was waiting to see if price would pullback to 3,250 zone to take buys after price missed our entry just a little bit of pips if you check out my last few posts but my projections for Gold is that price might be heading to 3434 zone and can’t see a pullback to our area of interest and if price get to the 3434 zone I will be waiting to see if sellers would jump in or I wait for a breakout so I will update you guys before the week ends or if am about to execute a trade….
