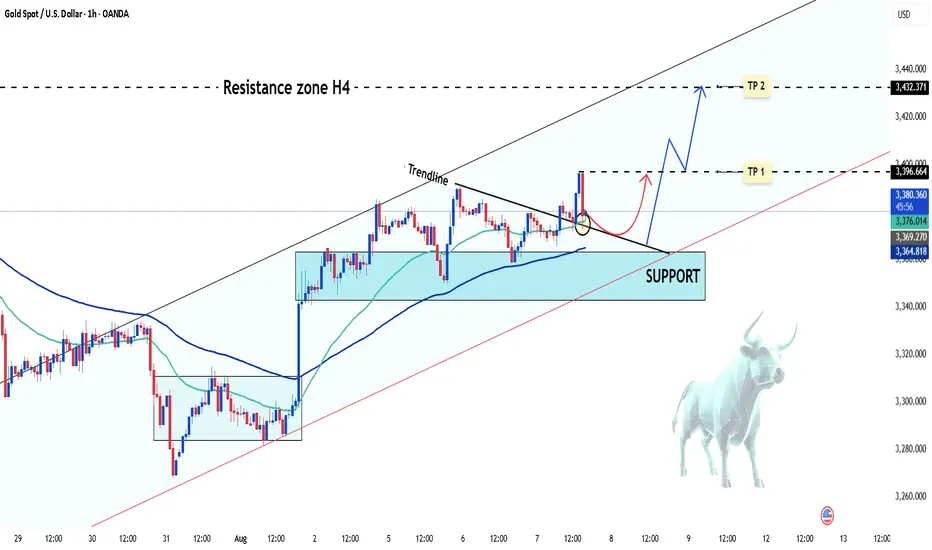
XAU/USD Short-Term Buy Opportunity ? XAU/USD has recently formed a bullish pattern, currently trading around 3,380 USD and showing an increase of more than 10 USD for the day.
From a technical analysis perspective, the price is following an upward trendline and showing signs of momentum accumulation. The area around 3,350 USD provides strong support, which could establish a solid base for further upward movement.
Key Levels:
Resistance (Target 1): 3,396 USD
Resistance (Target 2): 3,432 USD
To consider a short-term buy, it’s important to monitor price action around the support levels and wait for confirmation t
Good luck!
XAUUSD trade ideas
XAUUSD – Is This a Short-Term Top?1. What happened yesterday
After dipping to 3340 in early trading—just shy of the key 3335 support where I was looking to buy—Gold resumed its bullish momentum that began on Friday. During the New York session, price spiked to a new intraday high near 3385. However, the final hour brought a pullback, and since then, Gold has entered a tight consolidation range.
2. Key question: Is Gold forming a short-term top?
The 1H chart shows a new failed breakout attempt above 3380 during the Asian session. This left behind a minor double top, with the neckline sitting around 3370. That level is especially important—it aligns with a short-term rising trendline.
3. Why a correction might follow
• Price rejected above 3380 twice
• Small double top visible on LTF
• 3370 is a make-or-break level (neckline + trendline)
• A break below could trigger a correction of the +1000 pips rally from Friday’s lows
4. Trade plan
While there is some evidence of a potential top, this remains a high-risk and aggressive short.
Any attempt to trade against the trend should be done with tight stops and small size .
5. Final thoughts
A short-term top could indeed be in place, but Gold must break below 3370 to unlock deeper downside. Until then, the bulls are still in control—just taking a breather. ⚖️
Disclosure: I am part of TradeNation's Influencer program and receive a monthly fee for using their TradingView charts in my analyses and educational articles.

XAUUSD_1H_SellGold Analysis Short and Medium Timeframe Elliott Wave Analysis Style The gold market has completed five upward waves and is currently at the end of the upward wave. Given the formation of the corner market pattern, it could enter a reversal and decline towards $3,333.

GOLD (XAUUSD): Bullish Price Action after BreakoutFollowing a breakout of a significant horizontal resistance, 📈Gold retested this level and formed an ascending triangle on the 4-hour chart.
A bullish breakout above its neckline serves as a crucial intraday confirmation of strength of the buyers, suggesting a potential rise to at least 3430 support level.

GOLD DAILY CHART ROUTE MAPHey Everyone,
Daily Chart Update
Another Clean Rejection: Structure Still Dominates
Following up on the recent price action last week, the 3372 support level continued to provide support aligned perfectly with the channel half-line, giving us the bounce that continued all the way up to 3409, just short of the 3433 resistance, which once again remains open for a potential test.
We remain in the same structured range, with price still rotating between 3272 and 3433, a 170+ pip zone that continues to deliver high-probability trade setups.
Here’s where we are now:
🔹 Range Still Active
Price is respecting the 3272–3433 boundaries with precision. Until we get a decisive break and hold outside this range, range bound strategies remain in play.
🔹 No Breakout = Clean Rejection
The failure to sustain above 3433 confirms resistance is still valid. We're watching EMA5 for potential breakout confirmation, until then, the bias stays neutral within the range.
🔹 Channel Half-line Bounce
That rejection into 3272 also matched the channel half line, and the bounce there further cements this area as critical support. The latest rally to 3397 reinforces the strength of this pivot.
Updated Key Levels
📉 Support – 3272
Still the major pivot. Buy zones remain valid here unless we see a confirmed breakdown.
📈 Resistance – 3433
Now clearly tested and rejected more than once. Any clean break and hold above could change the dynamic, but until then, it’s solid resistance with 3397 as support.
Thanks as always for your support.
Mr Gold
GoldViewFX

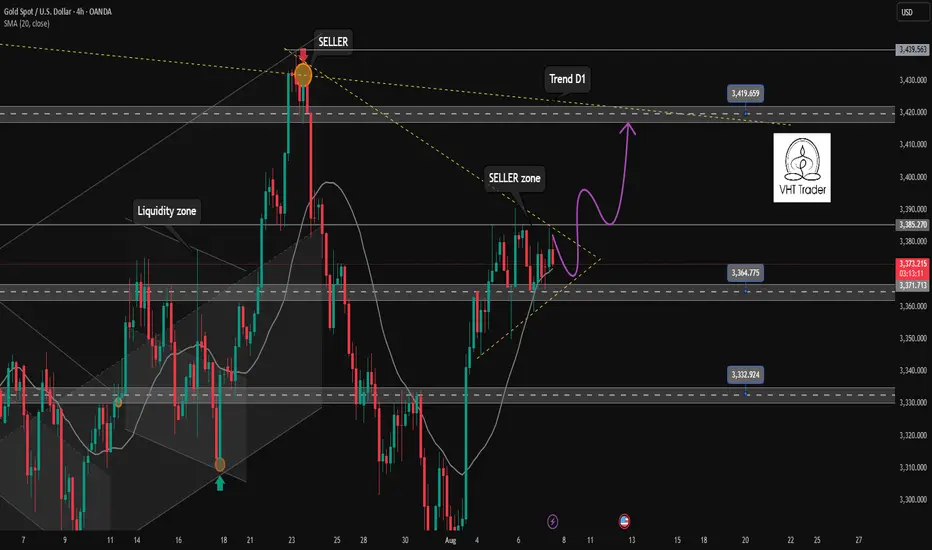
Only look for BUY signal points in the current trend of Gold✏️The D1 candle closed with strong bullish force at the end of the day. The gold trend is still increasing wave 3 and there is no sign of correction. The reaction around 3385 in the Asian session this morning is being awaited to see if it is a recovery of Gold or not. The BUY strategy at important support zones is still maintained and pay attention to the price reaction of the candle.
📉 Key Levels
Support 3363-3346-3332
Resistance 3385 - 3407
Buy trigger: Confirmation of buying candle at support zones 3363-3346-3333
Target: 3400.00

Candle patterns that help you always WinHello everyone, if you are struggling to identify price zones, entry points, or simply want to predict the trend of any currency pair, then this article is for you.
I will divide it into several parts, and today we will cover some common patterns — so grab a pen and paper to take notes!
First pattern: ASCENDING TRIANGLE
The ascending triangle is considered a bullish continuation pattern. In order to locate it, we will observe more than one ascending peak. To draw this pattern, a horizontal line (the resistance line) must be placed above the resistance points, and an ascending line (the uptrend line) must be drawn along the support points.
Second pattern: FLAG
The flag pattern is used to identify the possible continuation of a previous trend from a point where the price has drifted against that same trend. If the trend resumes, the price rise could be rapid, making the timing of a trade advantageous when noting the flag pattern.
If you think you have seen a flag to trade, the most important thing is the fast and steep price trend. If the price slowly rises and falls below the flag, you'd better not trade at that time.
3. CUP AND HANDLE
The cup and handle pattern on the price chart resembles a cup with a handle, where the cup is u-shaped and the handle has a slight downward slope.
The cup forms after an upward move and looks like a bowl or rounded bottom. As the cup is completed, a narrow price range develops on the right side and the handle is formed. A subsequent breakout of the trading range that forms the handle indicates a continuation of the previous upward move.
4. DOUBLE BOTTOM
The trajectory of the asset price within the formation of the model resembles the letter "W". The last two price lows, located at approximately the same level, is an area of strong support, in which twice performs an upward price reversal.
When the market price breaks the resistance level of the pattern, the formation of the pattern is complete. The sell signal appears and a change in the trend direction is expected.
5. INVERSE HEAD AND SHOULDERS
This pattern is identified when the price action of a security meets the following characteristics: the price falls to a low and then rises; the price falls below the previous low and then rises again; finally, the price falls again, but not as much as the second low. Once the final low is reached, the price heads upward toward resistance near the top of the previous apexes.
6. ROUNDING BOTTOM
The rounding bottom pattern looks similar to the cup and handle pattern, but does not experience the temporary downward trend of the "handle" portion.
The initial downward slope of a rounding bottom indicates oversupply, which forces the stock price down.
The move to an uptrend occurs when buyers enter the market at a low price, which increases demand for the stock. Once the rounded bottom is completed, the stock breaks out and will continue in its new uptrend.
7. TRIPLE BOTTOM
The Triple Bottom pattern is similar in appearance to the Inverse Head and Shoulders pattern, in that it is represented by a series of three highs and lows.
The difference is that the three highs of the Triple Bottom will have approximately the same height, whereas in the Inverse Head and Shoulders pattern, the second low is lower than the first and third lows.
The appearance of the Triple Bottom indicates the existence of a downtrend, which is currently in the process of reversing into an uptrend.
And here are some classic bullish patterns. In the next parts, I will cover bearish patterns, how to read candlesticks, and technical indicators.
If you find this interesting and useful, please leave me a like and a comment to keep me motivated!
Now, are you ready to trade? Remember and practice these patterns — you’ll soon become a true professional.
Good luck!
Kevinn_Nguyen.
XAUUSD: Triangle Completion Hints at Breakout PotentialOn the 1H timeframe, gold (XAUUSD) is moving within a narrow ascending channel and has recently formed a clear contracting triangle correction pattern (ABCDE). This structure suggests the market is consolidating before a potential breakout to the upside.
Detailed Analysis:
- Elliott Wave Structure:
Price action appears to have completed an ABCDE triangle, a common ending pattern before a breakout wave begins.
The conclusion of wave E implies a possible impulsive move is about to start in the direction of the prior trend – in this case, bullish.
- Trendline & Channel:
Price continues to respect a well-defined ascending channel formed since August 1st, indicating a sustained bullish structure.
The current price (3,398 USD) is nearing the upper boundary of this channel. A successful breakout could push price toward the 3,410–3,415 resistance area.
- Fibonacci Retracement:
The previous correction found solid support around the 0.618 Fibonacci level (~3,360 USD), which serves as a key buy zone if price retraces.
This area is ideal for a buy-the-dip opportunity in case of a pullback.
- EMA & RSI Indicators:
Price remains above the 50-period EMA, supporting the bullish bias.
RSI is trending above 50 and not yet in overbought territory, suggesting momentum still favors the bulls.
Key Support and Resistance Levels:
3,415 – 3,420: Major Resistance -Previous swing high, profit-taking zone
3,400 – 3,405: Minor Resistance - Channel top, potential breakout trigger
3,360 – 3,365: Key Support - Fib 0.618 zone, watch for bullish reaction
3,330
Deep Support
Strong demand zone from H4 chart
Suggested Trading Strategies:
- Strategy 1 – Breakout Buy:
Entry: On confirmed breakout above 3,405 with strong volume.
SL: Below 3,390
TP1: 3,415 | TP2: 3,420+
- Strategy 2 – Buy the Dip:
Entry: On pullback to 3,360–3,365 support zone.
SL: Below 3,350
TP: Return to 3,405–3,415 zone
- Risk Note: Price is currently near resistance – avoid chasing at the top of the channel. Only enter after breakout confirmation or wait for a retest of support for better R:R setups.
Conclusion:
Gold is showing strong potential for a bullish breakout following the completion of a classic triangle correction pattern. Focus on price action around the 3,400 level for intraday trading opportunities.

Gold Continues to Rise, Breaking ResistanceWeak US jobs data has increased expectations that the Fed will cut interest rates, weakening the USD and bond yields, making gold an attractive safe-haven asset. Gold has reached 3,371 USD, with US gold futures at 3,425 USD. Gold is currently facing resistance at 3,450 USD, and if broken, it could continue towards 3,500 USD.
The XAUUSD chart is moving within a clear uptrend channel with higher highs and higher lows. Gold has surpassed key support levels, including the Fair Value Gap (FVG), indicating strong buying momentum. The market is now testing the 3,450 USD resistance. If broken, the next target will be 3,500 USD.
Strategy:
Buy: If price breaks above 3,450 USD, aim for 3,500 USD.
Stop Loss: Place below 3,320 USD to manage risk.

Ascending triangle pattern is formed✏️Gold is consolidating in a triangle pattern. This is likely an ascending triangle pattern. We can wait for strong enough buying pressure to break the upper boundary to trigger the BUY strategy. Or wait for a reaction at the lower boundary of the triangle pattern to trigger the BUY. 3365 is broken to confirm a corrective downtrend towards 3333.
📉 Key Levels
Buy trigger: Breakout of the upper triangle pattern 3385
Buy trigger: Reaction of the buying candle at 3365
Target 3419
SELL Trigger Break and Retest bellow 3365
Leave your comments on the idea. I am happy to read your views.
GOLD (XAUUSD): Technical Analysis Ahead of Trump
One of the important news for today is Trump speech during
the late New York session.
Here is my brief technical outlook for Gold ahead of that.
As we discussed on the yesterday's live stream, the price
is now coiling on a recently broken rising trend line that serves
as a vertical resistance now.
A bullish breakout of that and a daily candle close above
will provide a strong bullish confirmation and push the prices to 3430.
Alternatively, very bearish news today may trigger a retracement
to an underlined horizontal support.
Let's see how the market is going to react tonight.
❤️Please, support my work with like, thank you!❤️
I am part of Trade Nation's Influencer program and receive a monthly fee for using their TradingView charts in my analysis.

GOLD 4H CHART ROUTE MAP UPDATE & TRADING PLAN FOR THE WEEKHey Everyone,
Please see our updated 4h chart levels and targets for the coming week.
We are seeing price play between two weighted levels with a gap above at 3424 and a gap below at 3371. We will need to see ema5 cross and lock on either weighted level to determine the next range.
We will see levels tested side by side until one of the weighted levels break and lock to confirm direction for the next range.
We will keep the above in mind when taking buys from dips. Our updated levels and weighted levels will allow us to track the movement down and then catch bounces up.
We will continue to buy dips using our support levels taking 20 to 40 pips. As stated before each of our level structures give 20 to 40 pip bounces, which is enough for a nice entry and exit. If you back test the levels we shared every week for the past 24 months, you can see how effectively they were used to trade with or against short/mid term swings and trends.
The swing range give bigger bounces then our weighted levels that's the difference between weighted levels and swing ranges.
BULLISH TARGET
3424
EMA5 CROSS AND LOCK ABOVE 3424 WILL OPEN THE FOLLOWING BULLISH TARGETS
3499
EMA5 CROSS AND LOCK ABOVE 3499 WILL OPEN THE FOLLOWING BULLISH TARGET
3561
BEARISH TARGETS
3371
EMA5 CROSS AND LOCK BELOW 3371 WILL OPEN THE FOLLOWING BEARISH TARGET
3293
EMA5 CROSS AND LOCK BELOW 3293 WILL OPEN THE SWING RANGE
3236
3171
EMA5 CROSS AND LOCK BELOW 3171 WILL OPEN THE SECONDARY SWING RANGE
3089
3001
As always, we will keep you all updated with regular updates throughout the week and how we manage the active ideas and setups. Thank you all for your likes, comments and follows, we really appreciate it!
Mr Gold
GoldViewFX

XAUUSD New ATH Coming Soon ?? Or Smart Money Distribution ??Gold closed the week strong, printing a large bullish daily candle. On the surface, it looks like momentum is ready to push us toward the all-time highs around $3,500.
But here’s the tricky part, as always in trading…
The volume delta on that candle is massively negative. That means heavy selling pressure came in while price was still moving up.
So, what’s going on? Two possible scenarios for next week:
1.Absorption (Bullish Case)
Large players are absorbing aggressive sellers, keeping price pinned at the highs. If that’s true, Monday could open with a gap up and follow-through toward new ATH.
2.Distribution (Bearish Case)
The big boys are unloading positions into eager late buyers. A gap up that’s quickly sold into or a gap down from Monday’s open could signal a deeper retrace back to the $3,300 area.
Key Levels to Watch:
$3,400 → Break & hold = ATH in sight.
$3,380 → Break & hold = distribution in sight.
$3,300 → Possible downside target if distribution confirmed.
Monday’s open is critical. The chart tells us there was massive orders on Friday and whichever positions they build up in Friday's range will show next week. And that could decide the trend for the rest of August.
As always trade safely peeps!!

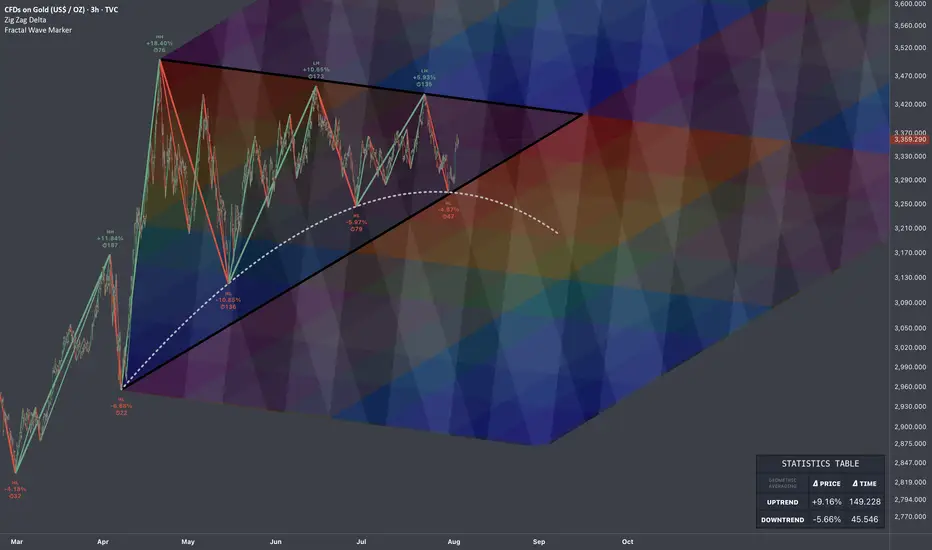
$GOLD: Projections of Compression & Release 🏛️ Research Notes
Price is at fib boundary derived from its structure that covers growth patterns. Several attempts were taken place to push higher and ended up as lower highs.
Contraction of fractal cycles and amplitude.
Topologically, the compression to a point of proportional release in fibonacci proportions and scaling law 1:1 to original triangle would look like a cube. And let's limit for now with that horizon.
Probabilistic Filter - Another layer of fibonacci channels to inherit roughness of observed temporal pattern which then rhymes with extended series.
The longer the price fluctuates in these geometric boundaries, the more accurate the colors tend to reflect the outcome.
For measuring percentages of swings I used this modification of Zig Zag.
Lingrid | GOLD Anticipating a Trend Continuation Amid PullbackOANDA:XAUUSD is pulling back within the upward channel after topping near the 3,410 resistance zone. Price is currently holding above 3,330 support and aligning with the channel base, signaling potential for a bullish rebound. A push above 3,350 could open the way toward 3,385, while a drop under 3,315 risks deeper correction.
📉 Key Levels
Buy trigger: Break above 3,350
Buy zone: 3,328–3,350
Target: 3,385
Invalidation: Close below 3,320
💡 Risks
Failure to hold upward channel support
Strengthening USD pressuring gold
Sudden macroeconomic news impacting safe-haven demand
If this idea resonates with you or you have your own opinion, traders, hit the comments. I’m excited to read your thoughts!

GOLD Will Keep Growing! Buy!
Hello,Traders!
GOLD is trading in an
Uptrend and the price
Made a retest and rebound
So we are bullish biased
And we will be expecting
A further bullish move up
Buy!
Comment and subscribe to help us grow!
Check out other forecasts below too!
Disclosure: I am part of Trade Nation's Influencer program and receive a monthly fee for using their TradingView charts in my analysis.

Gold price continues to increase above 3400, next week✍️ NOVA hello everyone, Let's comment on gold price next week from 08/11/2025 - 08/15/2025
⭐️GOLDEN INFORMATION:
Spot gold held steady on Friday, while futures surged to a record high of $3,534 following reports that the United States will impose tariffs on imported gold bars. Traders also continued to digest recent U.S. economic data as they looked ahead to next week’s key inflation release. XAU/USD last traded near $3,397, little changed on the day.
Overnight, the price spread between New York COMEX futures and spot prices widened by more than $100, Reuters reported, after the Financial Times revealed that the U.S. had levied tariffs on one-kilo gold bars, citing a letter from U.S. Customs & Border Protection.
⭐️Personal comments NOVA:
Gold price accumulates around 3400, buying power remains good as interest rate cut expectations approach
🔥 Technically:
Based on the resistance and support areas of the gold price according to the H4 frame, NOVA identifies the important key areas as follows:
Resistance: $3418, $3437, $3500
Support: $3344, $3310
🔥 NOTE:
Note: Nova wishes traders to manage their capital well
- take the number of lots that match your capital
- Takeprofit equal to 4-6% of capital account
- Stoplose equal to 2-3% of capital account
- The winner is the one who sticks with the market the longest

DeGRAM | GOLD above the descending channel📊 Technical Analysis
● XAUUSD broke above the descending channel and confirmed a breakout from a narrowing wedge near 3,382, signaling bullish continuation.
● The price structure now targets the 3,435 resistance, with pullbacks likely to retest the breakout zone before the next leg higher.
💡 Fundamental Analysis
● Gold is supported by renewed safe-haven demand after geopolitical tensions in the Middle East and weaker-than-expected US ISM services data, which pressured the USD.
✨ Summary
Buy above 3,382; target 3,435. Setup remains valid while holding above 3,360.
-------------------
Share your opinion in the comments and support the idea with a like. Thanks for your support!

GOLD DUMPS $50 – LIQUIDITY ZONE AHEAD | CPI IN FOCUS! GOLD DUMPS $50 – LIQUIDITY ZONE AHEAD | CPI IN FOCUS!
📌 MARKET RECAP
Gold kicked off the week with a sharp $50 drop, breaking multiple key trendlines and nearby support levels in quick succession.
Main drivers behind the move:
Profit-taking after the recent strong rally.
Stronger USD expectations ahead of CPI data (forecast +0.1% vs previous).
Geopolitical factors – Ukraine–Russia ceasefire talks approaching their conclusion, adding to risk-off sentiment.
🧐 WHAT’S NEXT?
If CPI comes in strong → USD strengthens → Gold could slide further into the 333x – 330x liquidity zone.
If CPI disappoints → USD weakens → Gold may quickly bounce back toward the 337x key level (previous breakdown area) for a retest before deciding direction.
🎯 MMFLOW GAME PLAN
1️⃣ BUY SCALP
📌 Entry: 3331 – 3329
📌 SL: 3325
📌 TP: 3335 – 3340 – 3345 – 3350 – 3360 – 3370 – 3380
2️⃣ BUY ZONE
📌 Entry: 3310 – 3308
📌 SL: 3304
📌 TP: 3314 – 3318 – 3322 – 3326 – 3330 – 3335 – 3340 – 3350 – 3360 – ???
3️⃣ SELL SCALP
📌 Entry: 3363 – 3365
📌 SL: 3370
📌 TP: 3360 – 3356 – 3352 – 3348 – 3344 – 3340
4️⃣ SELL ZONE
📌 Entry: 3376 – 3378
📌 SL: 3382
📌 TP: 3372 – 3368 – 3364 – 3360 – 3355 – 3350 – 3340
⚠️ RISK NOTE
CPI is a potential game-changer – even a small deviation from forecasts can trigger a massive one-way move.
Always keep an eye on AD-marked Key Levels on the chart before pulling the trigger.

GOLD (XAUUSD): Road to 3430
Quick update for my yesterday's analysis for Gold.
The price broke through the trend line with a local Break of Structre BoS,
updating an intraday-high.
The road to 3430 is now empty, and the market will most likely
continue rising steadily to that.
❤️Please, support my work with like, thank you!❤️
I am part of Trade Nation's Influencer program and receive a monthly fee for using their TradingView charts in my analysis.

XAUUSD - Drowning in RedHello everyone, what do you think about OANDA:XAUUSD ?
The other day, we discussed the movement of gold within the wedge pattern and the potential for it to test the 3350 USD support before bouncing back. That target was met, however, the sharp and sudden decline caused gold to lose its momentum momentarily.
Yesterday, gold dropped straight from 3398 USD to 3342 USD, a loss of more than 55 USD in less than a single session. The drop on Monday pushed the price of gold below a critical level. Moreover, the oscillators on the chart above are showing a bearish trend, supporting the scenario of further price decline.
The current support level is at 3350 USD, and price movement is following the Dow Theory. However, a convincing break below this level would act as a new trigger for bearish traders, potentially accelerating the decline towards the intermediate support at 3,315 USD, and then heading towards the round figure of 3,300 USD.
Do you think XAUUSD can bounce back from the 3350 USD support level? Feel free to share your thoughts!

Gold Surges on Weak NFP Hello everyone, what’s your take on XAUUSD?
Gold prices soared at the end of the last session and are now trading around $3,380. This sharp rise followed a weaker-than-expected U.S. Non-Farm Payrolls (NFP) report, which shifted market sentiment toward expectations that the Fed may delay interest rate cuts. As a result, the U.S. dollar weakened and demand for gold as a safe haven surged.
Technically, gold appears to be forming a cup and handle pattern, with the first resistance target at $3,400, followed by $3,435.
What do you think? Could this rally continue? Let us know in the comments!

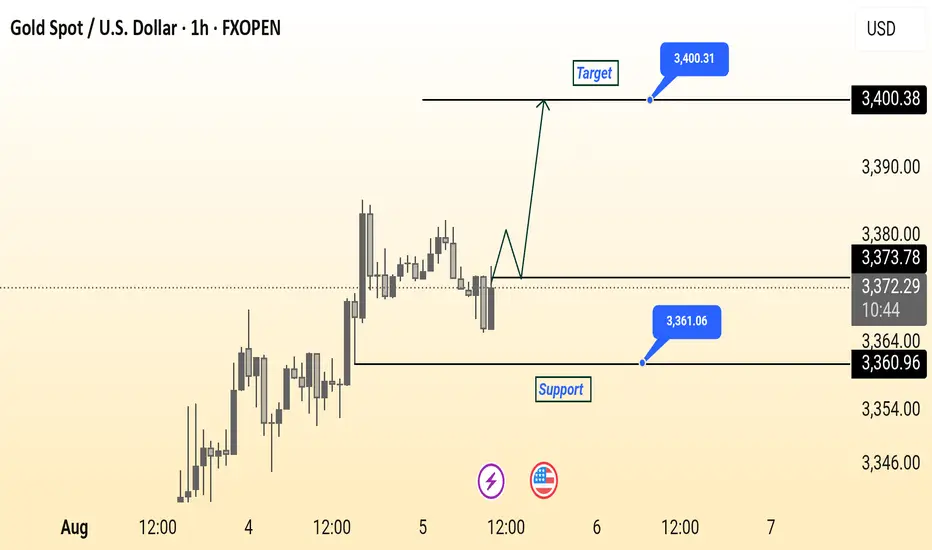
Gold Spot (XAU/USD) 1-Hour Chart Analysis – Potential Upside TowThis 1-hour chart for Gold Spot (XAU/USD) from FXOPEN shows a key support level at $3,360.96 and a potential target at $3,400.31. The current price is hovering around $3,372.04, just below the minor resistance of $3,373.78. A bullish breakout from this zone could initiate a move toward the target, as illustrated by the projected upward path. The support zone marked in blue suggests a strong buying interest that could act as a rebound area if prices dip. Watch for price action confirmation near support for potential long entries.