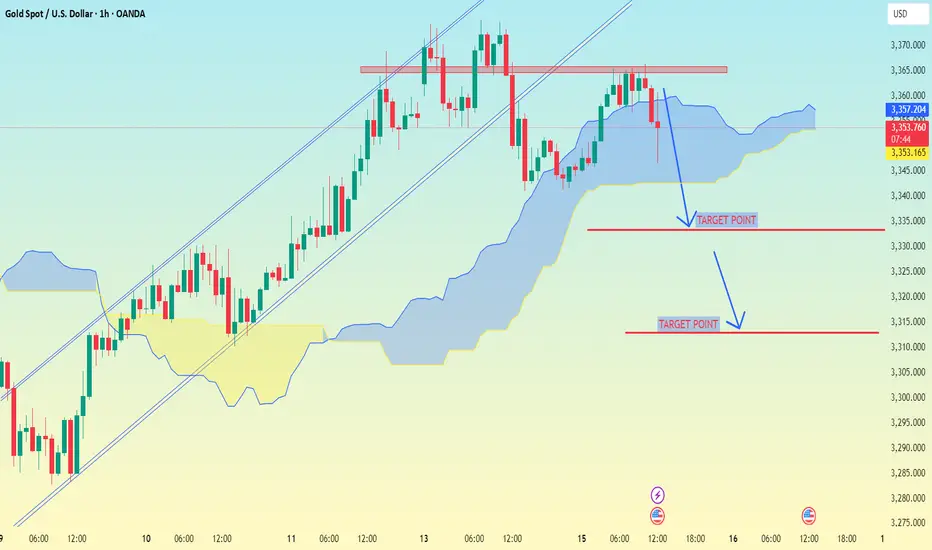
XAU/USD (Gold vs USD) on the 1-hour timeframe..XAU/USD (Gold vs USD) on the 1-hour timeframe, the setup clearly shows a bearish breakdown from an ascending channel, supported by Ichimoku Cloud analysis.
---
📉 Target Points (as marked on your chart):
1. First Target Point: Around $2,335
2. Second Target Point: Around $2,312
---
🔍 Analysis Breakdown:
Price has broken below the Ichimoku cloud – a bearish signal.
The ascending channel is broken to the downside.
Support zones and target levels are clearly marked:
The first target aligns with a previous support level.
The second target is a deeper support area, likely the base of the previous strong rally.
---
📌 Summary:
🥇 First Target: $2,335
🥈 Second Target: $2,312
📉 Bias: Bearish (continuation likely if momentum holds and no strong reversal signs appear)
Let me know if you want suggested stop-loss, entry confirmation ideas, or risk management tips.
XAUUSD trade ideas
ELLIOTT WAVE XAUUSD H4 update
EW Trade Set Up H4
monitoring the end of subminuette wave ii
subminuette wave ii is going to end in a double zigzag.
Waiting for an accumulation in the price range 3250/3315 before subminuette iii starts.
daily key levels (area)
3315
3275 POC
3250

GOLD DISTRIBUTION TYPEHello folks. its been a while I am posting. Been dealing with this idea last week.
wait for a rally to 3344, if it breaks above 3351 then we still waiting below our main Entry 3280-3289 zone. less stoploss below the friday low.
Trade it swing if we see monday rally. then wait our entry.
Goodluck and have fun trading,
If trading is a lifestyle this is it.
this is your lifestyle.
waiting here is boring.
thats why we need to be more patience.
xiaaaaooo.

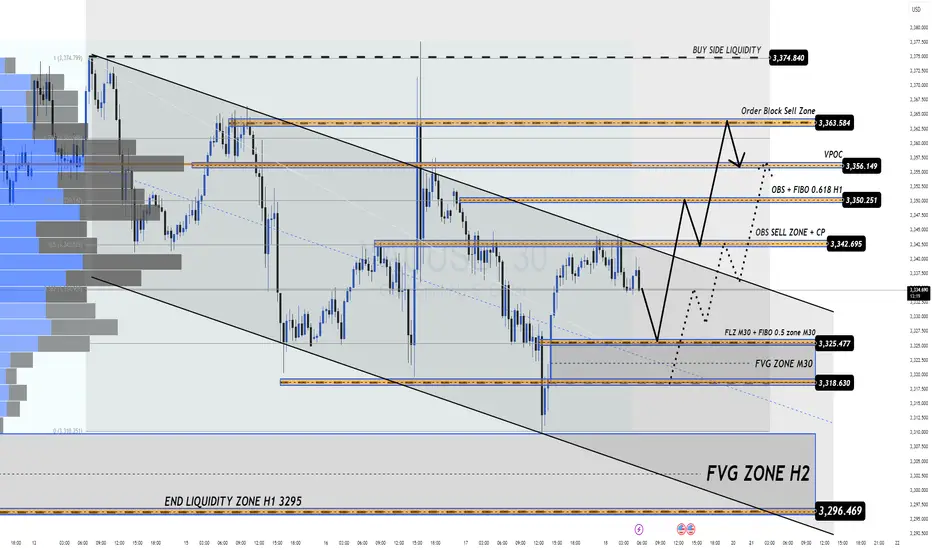
18/07 Gold Outlook Market Tensions Mount Liquidity Zones in Play Gold Outlook – Market Tensions Mount, Liquidity Zones in Play
Price action heats up as we enter the final trading day of the week. Are you ready to ride the wave or get caught in the liquidity sweep?
🔍 Market Sentiment & Global Highlights
Gold rebounded strongly after dropping on better-than-expected US data. However, several macro risks are keeping gold buyers in the game:
Buy-the-dip activity emerged amid concerns that Trump’s tariff policies may fuel inflation.
Rate cut expectations remain strong as US core inflation shows no signs of cooling.
Geopolitical risks intensified as Israel conducted fresh airstrikes on Syria.
EU threatens $84B in tariffs on US goods should trade talks break down.
💡 These tensions are giving gold strong support — especially as traders prepare for potential volatility into the weekend.
📈 Technical Overview – Liquidity Zones at Play
Yesterday's bounce from FLZ H2 (3310) — a critical demand and liquidity zone — triggered a clean reversal. Sellers took profit, volume shifted, and buyers regained control. Price has since pushed up to retest the OBS SELL ZONE + CP Pattern near the 334x area with a sharp reaction.
For today, price is likely to revisit lower liquidity pockets (M30–H2) before making the next directional move.
🔑 Key Levels to Watch
🟢 BUY ZONE: 3318 – 3316
Stop Loss: 3312
Take Profits: 3322 – 3326 – 3330 – 3335 – 3340 – 3345 – 3350 – 3360+
⚡ BUY SCALP ZONE: 3326 – 3324
Stop Loss: 3320
Take Profits: 3330 – 3335 – 3340 – 3345 – 3350 – 3360
🔴 SELL ZONE: 3363 – 3365
Stop Loss: 3370
Take Profits: 3360 – 3355 – 3350 – 3346 – 3342 – 3338 – 3335 – 3330
⚠️ Final Notes
Today’s session has no major news releases, but as it’s the end of the week, we may see liquidity grabs and unexpected volatility. Stay disciplined, stick to your plan, and always respect TP/SL.
🔔 Follow the key zones carefully – volatility loves indecision.
Gold rebound brings bearish opportunities
Before the fishermen go out to sea, they don't know where the fish are? But they still choose to go because they believe they will return with a full load. When you invest, you don't know whether you can make a profit, but you still need to try, and from the moment you decide to do it, you must insist on believing to gain something. The same is true for gold investment. You may still be losing money at the moment, but as long as you find me, all losses will be solved!
Views on the trend of gold!
In terms of gold, unfortunately, the bulls don't seem to last long, and they are also a bit unstable! Emphasize the most critical point, the continuous rise of the sun, the first wave of V-shaped rebound last night, and then the high-level oscillation, and there was no continuation of the rise of the sun last night. The bulls did not take off in one wave, but were held down again. But in the same way, don't think that the bulls are held down, and the bears will come. We still have to distinguish according to the range and strength. In many cases, the market maintains a oscillating range.
So how do you look at it today? Is there still hope for the bulls? From the perspective of correction, every big drop has poor continuity, and they all bottom out and rebound, just like gold fell to 3310 last night and violently rose to 3344, so there is a high probability that there will be continuation after the retracement today. On the one hand, even if it rebounds, it is also volatile, and the rebound and second decline is the continuation of the market. Therefore, currently pay attention to two points, the upward pressure 3355, and the downward strength and weakness dividing point 3325!
Gold: You can short at the rebound of 3350-55, defend 10 US dollars, and the target is 3330-25! If it breaks 3325, it will look down to the double bottom support of 3310. On the contrary, if it does not break, it can be shorted and look up to 3345-50!

GOLD AT CROSSROADS: CAPITALIZING ON MARKET SHIFTS FUNDAMENTAL ANALYSIS
With Gold currently trading at 3357, we're at a pivotal moment. The confluence of heightened geopolitical tensions and recent decisive US government actions – including renewed tariff threats and evolving monetary policy signals – is creating a clear trajectory. Analysis indicates a compelling opportunity to initiate aggressive sell signals, targeting 3345 and then pushing for 3330. Risk is rigorously managed with a disciplined stop loss at 3380. This is a strategic move, designed to profit from the immediate downward pressures stemming from the global political and economic landscape, as the market re-calibrates to these powerful forces."

HelenP I. Gold will continue to decline and break support levelHi folks today I'm prepared for you Gold analytics. After a prolonged period of consolidation, we can observe how price has formed a symmetrical pennant pattern. Price respected both the descending and ascending trend lines, bouncing several times from each side. Recently, gold tested the upper boundary of the pennant near the 3390 resistance level but failed to break through, confirming the strength of the resistance zone between 3390 and 3400 points. Following this rejection, the price started to decline and is now approaching the support level around 3305. If this support doesn’t hold, the price may drop further and break out of the pennant downward. In that case, the nearest significant target lies at 3280 points — near the lower trend line and previous reaction zones. Given the current structure, repeated rejection from resistance, and narrowing volatility inside the pattern, I expect XAUUSD to exit from the pennant and move down, breaking the support zone. That’s why I remain short-term bearish and set my goal at 3280 points. If you like my analytics you may support me with your like/comment.❤️
Disclaimer: As part of ThinkMarkets’ Influencer Program, I am sponsored to share and publish their charts in my analysis.

GOLD FULL UPDATE – July 15, 2025 | Post-CPI TrapPost-CPI Flip Zone Battle
Hello dear traders 💛
Today has been one of those heavy CPI days — full of volatility, sweeps, and doubt. But if we read it structurally and stop chasing candles, everything makes sense. Let’s break it all down step by step, clearly and human-like.
Current Price: 3330
Bias: Short-term bearish, reactive bounce underway
Focus Zone: 3319–3320 liquidity sweep + key decision structure unfolding
🔹 Macro Context:
CPI came in slightly hot year-over-year (2.7% vs 2.6%) while monthly stayed in-line at 0.3%. That gave the dollar a short-lived boost, and gold reacted exactly how institutions love to play it — sweeping liquidity under 3320, then pausing. Not falling, not flying. Just... thinking.
That reaction matters. Why? Because it shows us indecision. It tells us that gold isn’t ready to break down fully yet, and every aggressive move today was part of a calculated shakeout.
🔹 Daily Structure:
Gold is still stuck below the premium supply zone of 3356–3380. Every attempt to rally there for the past few weeks has failed — including today.
The discount demand area between 3280–3240 is still intact and untouched. So what does this mean?
We are in a macro-range, and price is simply rotating between key structural edges.
🔹 H4 View:
The rejection from CPI at 3355–3365 created a micro CHoCH, signaling the bullish leg is now broken.
After the 3345 fail, price dropped to 3320 — but it hasn’t tapped the full H4 demand at 3310–3300.
H4 EMAs are tilting down, showing pressure. This isn’t a breakout. It’s a correction inside a larger range.
🔸 Key H4 Supply Zones:
3345–3355: liquidity reaction during CPI
3365–3375: untested OB + remaining buy-side liquidity
🔸 Key H4 Demand Zones:
3310–3300: mitigation zone from the CHoCH
3282–3270: deep discount and bullish continuation zone if current fails
Structure-wise: We are in a correction, not a clean uptrend. That’s why every bullish attempt fails unless confirmed.
🔹 H1 Real Structure
This is where things got tricky today.
Price formed a bullish BOS back on July 14, when we first pushed into 3370. That was the start of the bullish leg.
But today, we revisited the origin of that BOS, right near 3320. This is a sensitive zone.
If it holds → it’s still a retracement.
If it breaks → we lose the bullish structure and shift full bearish.
So far, price touched 3320, bounced weakly, but has not printed a bullish BOS again.
🔸 H1 Zones of Interest:
Supply above:
3340–3345: micro reaction zone
3355–3365: CPI origin rejection
3370–3375: final inducement
Demand below:
3310–3300: current flip test
3282–3270: if this breaks, bias flips bearish
Right now, we are between zones. Price is undecided. RSI is oversold, yes — but that alone is never a reason to buy. We need structure. We need BOS.
🔻 So… What’s the Truth Right Now?
✅ If 3310–3300 holds and price builds BOS on M15 → a clean long opportunity develops
❌ If 3310 breaks, and we lose 3300, structure fully shifts and opens downside to 3280–3270
On the upside:
Only look for rejections from 3355–3365 and 3370–3375
Anything inside 3325–3340 is noise. No structure, no clean RR.
Final Thoughts:
Today’s move was not random. It was a classic CPI trap: induce longs early, trap shorts late, and leave everyone confused in the middle.
But we don’t trade confusion — we wait for structure to align with the zone.
If M15 or H1 prints a BOS from demand, that’s your green light.
If price collapses under 3300, flip your bias. The chart already told you it wants lower.
No predictions. Just real reaction.
—
📣 If you like clear and simple plans, please like, comment, and follow.
Stay focused. Structure always wins.
📢 Disclosure: This analysis was created using TradingView charts through my Trade Nation broker integration. As part of Trade Nation’s partner program, I may receive compensation for educational content shared using their tools.
— With clarity,
GoldFxMinds

As risk aversion wavers, will gold rise or fall?
💡Message Strategy
After falling for two consecutive days, gold (XAU/USD) rebounded slightly in the Asian session on Wednesday, stabilizing above $3,320, attracting some bargain-hunting buyers. The market has paid close attention to the tariff policy that US President Trump continues to increase, and the rising risk aversion has become the core factor supporting gold prices.
The US CPI data for June showed that overall prices rose by 0.3% month-on-month, the largest increase in five months, and the core CPI rose to 2.9% year-on-year, both higher than expected. This has caused the market to worry that tariffs are gradually pushing up inflation, prompting the Federal Reserve to extend the high interest rate policy cycle.
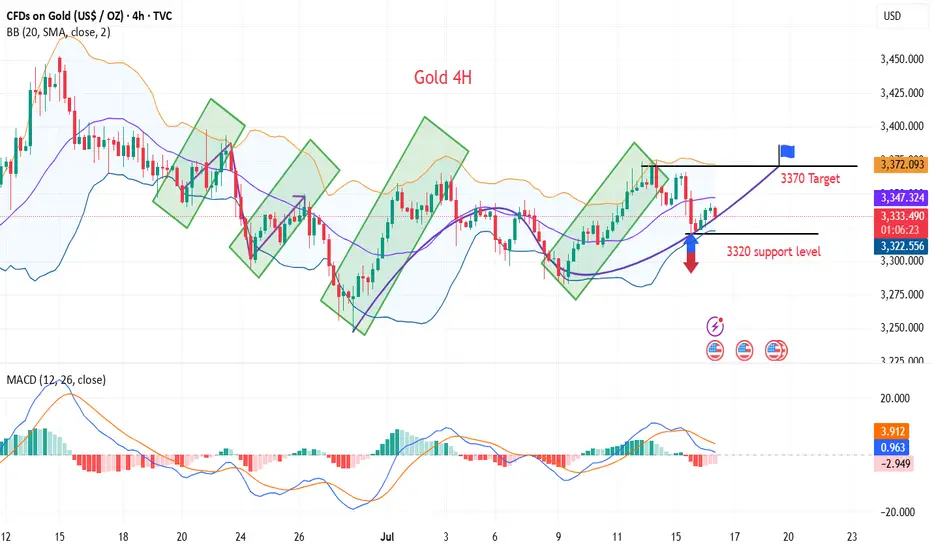
📊Technical aspects
The current trend of gold is constrained by both fundamentals and technical factors.
On the one hand, Trump's tariff policy has pushed up inflation expectations, triggering risk aversion and rethinking of the Fed's policy path, providing support for gold;
On the other hand, the Fed's tone of "maintaining high interest rates for longer" has limited the room for gold prices to rebound.
From the 4-hour chart, gold prices found support near the 100-period SMA (about $3,320) on Tuesday, stopping the decline from the three-week high. In the short term, if it can stand above the 3340-3345 resistance band, it may test the 3365-3370 area again, and the further target is the 3400-dollar round mark.
💰Strategy Package
Long Position:3320-3330,SL:3305,Target: 3365-3370
XAU/USD Setup THIS WEEK
Expecting a drop into the 3300–3310 zone, where we have:
4H Fair Value Gap
Trendline confluence
Liquidity below New York Low
From there, looking for a potential bullish reaction targeting:
📈 3405 – area with resting liquidity above recent highs.
📍 No confirmed bullish structure yet — waiting for a shift on the 5M/15M timeframe to confirm entry.

"Gold at a Crossroads! Bullish or Bearish? (Trade Plan)"🦹♂️💰 "Gold Heist Alert: XAU/USD Bullish Raid or Bearish Ambush?" 💰🦹♂️
🌍 Greetings, Market Pirates & Profit Raiders! 🌍
(Hola! Oi! Bonjour! Hallo! Marhaba!)
Based on the 🔥Thief Trading Method🔥, here’s our strategic heist plan for XAU/USD (Gold vs. Dollar). Follow the chart markings for high-probability loot zones—whether you're a bullish bandit or a bearish burglar! 🏴☠️💸
🎯 Entry Strategy (Where to Strike)
"The treasure is ripe for taking! Breakout = GO TIME!"
✅ Long Entry (Bullish Raid): Jump in at current levels if the uptrend holds.
✅ Short Entry (Bearish Ambush): Wait for a break & close below 3280.00 (confirms downtrend).
🛑 Stop Loss (Escape Route)
🚨 For Bulls: Bail out if price hits 3240.00 (SL tightens if trend strengthens).
🚨 For Bears: Retreat if price surges past 3360.00 (only activate SL post-breakout!).
🎯 Take Profit (Loot & Scoot!)
💰 Bullish Thieves: Aim for 3600.00 (or exit early if momentum fades).
💰 Bearish Bandits: Target 3125.00 (or escape before the cops—err, reversal—arrives).
📡 Market Intel (Why This Heist?)
Gold’s in a neutral zone (but bulls have the edge! 🐂📈). Key factors:
Macroeconomic shifts
COT data clues
Sentiment & seasonal trends
(Full breakdown in the chart notes—klick the 🔗! 🔍🌐)
⚠️ Danger Zones (News & Risk Control)
🚨 High-Impact News = NO NEW TRADES!
🚨 Protect open positions: Use trailing stops to lock in profits.
🚨 Adjust SLs if volatility spikes!
💥 Boost the Heist! 💥
Like & Share to fuel our next market robbery! 🚀💰
Follow for more lucrative trade setups—coming soon! 👀🔥
🎯 Trade Smart, Steal Smarter! 🦹♂️💎

GOLD → Consolidation ahead of CPI. Chances for growth?FX:XAUUSD Gold is consolidating amid a correction in the dollar ahead of important news. Consumer price index data is due later today. The market is stagnant and will not move prematurely.
On Tuesday, gold rose slightly amid profit-taking ahead of the US CPI release. Investors are waiting for a signal from inflation: weaker data could strengthen bets on a Fed rate cut and support gold, while strong inflation would strengthen the dollar and put pressure on the metal. The situation is exacerbated by Trump's new tariff threats and his criticism of the Fed chair. Let me remind you of Trump's pressure on regulators regarding inflation and interest rate cuts.
Technically, gold is trading above the previously broken “symmetrical triangle” consolidation. Bulls are trying to hold their ground above 3340-3350. Focus on the current range of 3340-3373
Resistance levels: 3373, 3394
Support levels: 3350, 3340
Favorable news for gold could boost interest in the metal, which would generally lead to growth. However, there is a factor of unpredictability, and against this backdrop, gold may test support at 3350-3340. If the bulls manage to keep the price above this zone, we may see growth in the medium term. Otherwise, the price may drop to 3310-3280.
Best regards, R. Linda!

XAUUSD AND GOLD WAS GOES TO BEARISH
🔴 XAUUSD 15M Bearish Trading Idea – Smart Money Trap Unfolding 🩸
🕒 Timeframe: 15-Minute
📉 Bias: Bearish
📊 Strategy: Smart Money Concepts – CHoCH | FVG | LH | LL | BMS | Liquidity Trap
---
📌 Market Context & Structure:
1. Price Action Breakdown:
Market ne Lower High (LH) aur Lower Low (LL) ka consistent bearish structure maintain kiya hai.
A recent CHoCH upward hua, lekin yeh likely a liquidity trap hai — price ne key supply zone ko tap kar ke rejection diya hai.
2. Key FVG Zones:
Multiple bearish FVGs upar exist karti hain (visible in red), jahan price ne react kiya.
Price ne bullish FVG fill karke ab lower timeframe supply zone mein stall karna start kiya hai.
3. EMA Confirmation:
Despite temporary crossover, EMAs still flat or indecisive — suggesting reversal or fakeout.
Price EMA ke around struggle kar raha hai, jo weak bullish attempt ka sign hai.
4. Order Block & Rejection Area:
Current resistance zone (3342–3348) pe strong selling pressure hua hai — potential mitigation + sell-off zone.
---
🔻 Trade Plan – Bearish Continuation Setup:
🔸 Entry Zone:
3342 – 3346 (After rejection confirmation in this zone)
🔻 Stop Loss:
Above 3349 (Above recent LH / supply trap)
🎯 Take Profits:
TP1: 3333 (Recent support)
TP2: 3322 (Demand imbalance)
TP3: 3315 (Major liquidity pool)
📏 Risk:Reward: Targeting 1:2.5 to 1:3+ depending on entry accuracy
---
🧠 Why This Setup is Bearish?
✅ CHoCH bullish was likely a trap; no strong follow-through
✅ Price rejected from key FVG supply zone
✅ Bearish structure still intact — LHs and LLs dominate
✅ EMAs flattening near resistance shows weakness
✅ Liquidity above recent highs has likely been swept — sellers may now dominate

GOLD - Wave 2 Bullish Towards $3,406 (1H UPDATE)I see a possible buy opportunity towards $3,406 on Gold, as part of its bigger Wave 2 correction, before we can consider selling again.
Confluences👇
⭕️Wave 2 Correction Not Complete (2 Sub-Waves So Far).
⭕️Distribution Schematic Forming.
⭕️Early Sellers ($3,377) & Buyers ($3,310) Liquidated In Past 2 Days.
Now we've seen both buyers & sellers liquidated, we can expect to see a cleaner move back towards $3,400 where there is a lot of pending liquidity.

XAUUSD MULTI TIME FRAME ANALYSISHello traders , here is the full multi time frame analysis for this pair, let me know in the comment section below if you have any questions , the entry will be taken only if all rules of the strategies will be satisfied. wait for more price action to develop before taking any position. I suggest you keep this pair on your watchlist and see if the rules of your strategy are satisfied.
🧠💡 Share your unique analysis, thoughts, and ideas in the comments section below. I'm excited to hear your perspective on this pair .
💭🔍 Don't hesitate to comment if you have any questions or queries regarding this analysis.

XAUUSD LONG 7/7/25Looking to target 3,450 price level. This is based on:
1. Price has been on a range since April 22 when the high was formed, the low of the move
that formed the high was taken out. Looking to aim to taking out the high.
2. On the weekly timeframe, last week took out the low of the week before and closed bullish
within the candle of the prior week. This provides a signal for a potential sweep of the high
of that week. Minimum 3,365 price level.

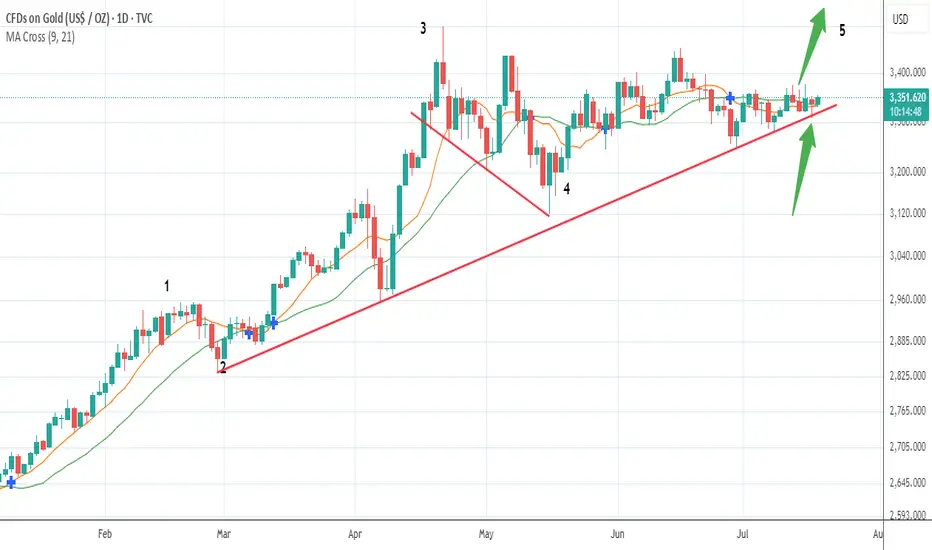
Bet The Farm!Gold's consolidation period in a wave 4 sideways pattern is about to conclude.
Anybody short this asset is about to get burned, a more than 90% probability of an upward surge is imminent.
There are multiple support touch points on this upward trend line...does it get any clearer?
Appreciate a thumbs up...God Bless you all!
Stronger U.S. Data Pressures Gold PricesGold remained below $3,340 per ounce on Friday and was on track for its first weekly decline in three weeks. The metal faced pressure after stronger U.S. data, including a rebound in retail sales and a sharp drop in jobless claims, reduced the immediate need for Federal Reserve rate cuts. Fed Governor Adriana Kugler backed keeping rates steady for now, pointing to economic resilience, while San Francisco Fed President Mary Daly maintained her outlook for two cuts in 2025.
Resistance is at $3,370, while support holds at $3,320.
Today's GOLD Analysis (MMC) – Bullish Momentum Building Ahead🔍 Market Overview:
Gold is currently showing signs of a bullish reversal structure after experiencing a downward correction. Price action has reacted strongly from well-defined demand zones, suggesting institutional buying activity at key levels. The current setup highlights a clear accumulation phase transitioning into a potential markup phase, driven by buyers regaining control.
🧱 Chart Structure Breakdown:
1️⃣ Initial Channel Formation (Left Side of Chart)
After a major downtrend, price began consolidating within a rising channel, indicating a retracement or correction phase.
This ascending channel showed a short-term bullish effort, but eventually broke to the downside, resuming the dominant bearish flow temporarily.
2️⃣ Previous Reversal Zone ($3,312 – $3,322)
This is the origin of the recent bullish move, where price strongly reversed after heavy selling.
The reversal formed a long bullish wick and an engulfing candle—clear signs of buying absorption.
This level has historical confluence, acting as both support and prior demand.
3️⃣ Mini SR - Interchange Zone ($3,327 – $3,335)
This zone is a mini structure level where previous resistance has now become support (SR Flip).
The area acted as a platform for the recent bullish reaction.
This zone also aligns with the interchange of order blocks, adding more confluence to the bullish argument.
4️⃣ Bullish Pattern Formation
Price formed a micro double bottom/inverse head and shoulders structure just above the Mini SR.
The pattern suggests strong base-building and provides momentum for the current bullish move.
Confirmation came after the neckline breakout and retest within the Central Zone.
5️⃣ Central Zone ($3,340 – $3,345)
This is an intraday pivot area, acting as a decision-making zone between buyers and sellers.
Price is currently testing this zone with strong bullish candles.
A clean break above this level increases the probability of further upside.
6️⃣ Reversal Zone 1 ($3,345 – $3,353) – ✅ Condition 1
Price is now entering this zone, where previous price rejections occurred.
If buyers can maintain momentum and break above this zone on strong volume, it will validate the bullish continuation thesis.
This zone is also an ideal area to monitor for partial profit-taking or potential short-term rejection.
7️⃣ Reversal Zone 2 ($3,365 – $3,375) – ✅ Condition 2
This is the next significant resistance block.
If price reaches this level, it could face heavy resistance and profit-booking from swing traders.
However, a breakout above this zone could lead to a much larger bullish wave, targeting $3,390+.
🎯 Trade Setup Idea:
Long Bias: Above $3,335 with targets at $3,353 (TP1) and $3,370 (TP2)
Risk Invalidation: Break below Mini SR zone ($3,327) may invalidate bullish thesis
Aggressive Entry: At retest of Mini SR after pattern breakout
Conservative Entry: On breakout and close above Reversal Zone 1 with confirmation
🧠 Trader’s Mindset:
The market is showing a clear shift in momentum, but buyers must sustain control above key levels.
Stay patient at resistance zones; avoid chasing.
Watch for rejection wicks or bearish divergence near Reversal Zone 2 if you're looking for a counter-trade.
📌 Summary:
📈 Bias: Bullish (as long as $3,335 holds)
💡 Opportunity: Breakout from Mini SR with structure support
📉 Risk: Failure to hold central zone could trigger retest of lower support
🚀 Potential: If momentum continues, gold could revisit July highs near $3,390–$3,400

Gold trade short now 📉 Short Trade Signal – XAU/USD (15m Chart)
⚠️ Signal Type: Short
⏰ Timeframe: 15 minutes
📸 Chart Reference: Price consolidating after bullish impulse; resistance formed
🔽 Trade Details
Parameter Value
Entry (Sell) 3,345.00 (current level)
Stop Loss (SL) 3,368.00 (above recent high/resistance)
Take Profit (TP) 3,309.00 (demand zone / imbalance fill)

GOLD FRENZY *I am in no way a financial advisor and you should always do your own due diligence before placing any trade. Do not trade what you are not comfortable with losing. No trade is guaranteed.
SELL Gold
SL 3399
TP 2972

Gold: Data, Tariffs & Trading LevelsThis week is packed with market news and economic data 😣. Key focuses include the US CPI, PPI, retail sales data, and the University of Michigan's preliminary consumer sentiment index. Additionally, former US President Trump plans to make a "major announcement" on Russia; the Federal Reserve will release the Beige Book (Economic Conditions Survey); and the CFTC's weekly positioning report is also worth monitoring 📊.
Over the weekend, Trump imposed tariffs on the EU and other regions, prompting a strong counterattack from the EU. The subsequent evolution of the situation requires continuous tracking, as it has triggered sharp market volatility pushing toward the 3400 mark 😱. Trump has recently announced frequent tariff policies (e.g., 30% tariffs on the EU and Mexico, and threats of 100% tariffs on Russia), amplifying market uncertainty. While this theoretically benefits gold's safe-haven demand, the actual impact requires close observation of institutional capital flows 🤔.
Gold prices consolidated at the bottom after a sustained pullback last night and extended their rebound this morning. Key pressure levels have undergone a support-resistance flip. The current gold rebound is merely a secondary confirmation of the 30-minute top structure, and after surging to 3365 in the afternoon, short-term signs of pressure have emerged 😕. In a volatile market, if prices start to consolidate sideways, it may signal the end of this oscillating upward trend, with a shift to a downward phase ahead.
Given market sensitivity ahead of the CPI data release, it’s advisable to focus on a volatile pullback trend 🧐. After today’s rebound, key attention should be on the 3363-3368 range as a shorting zone, with the long/short defensive level set at yesterday’s intraday high of 3375. Downside support is focused on the 3340-3335 range 🔍

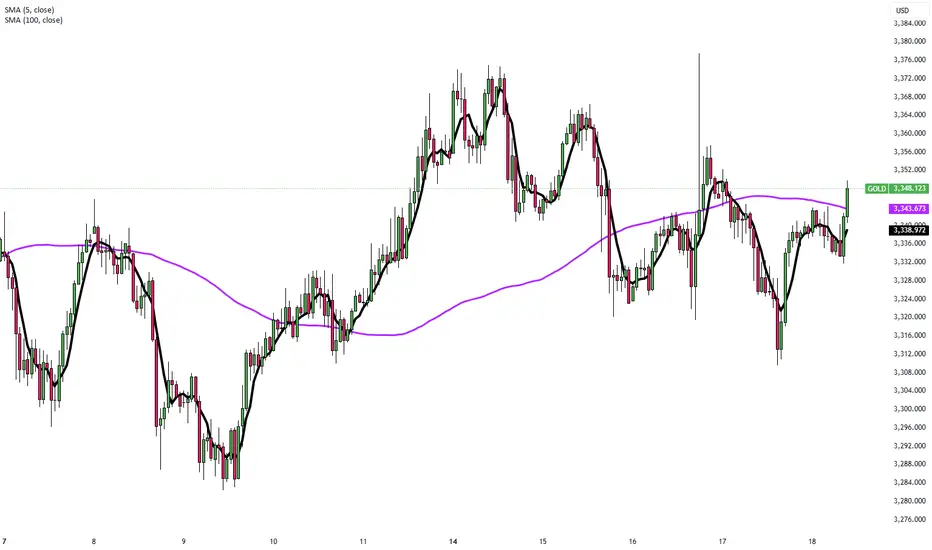
Daily live trade with XAUUSD in 15m/30m/1h 20250718Daily live trade with XAUUSD in 15m/30m/1h 20250718
