GOLD 2 HR CHART Gold 2 hr chart based on the 2hr time fame , the price support at 3384 creating a ascend channel
XAUUSD trade ideas

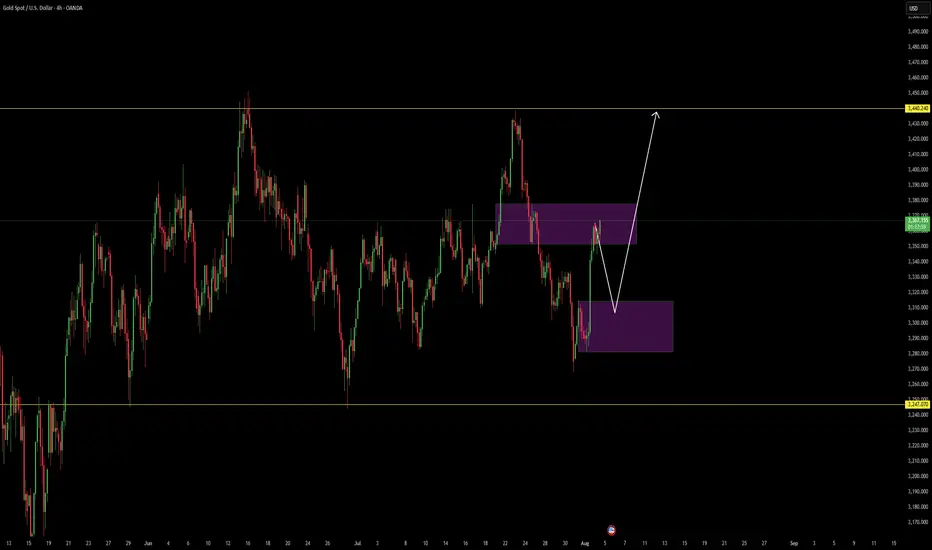
Volume. supportAlthough gold has made a downward segment overlap and the priority should be on a decline, due to Trump's trade wars and geopolitical tensions, I believe that after a pullback to the buyer zone of 3280–3315, gold will continue to rise.
Maintain the bullish theme and go long on pullbacks#XAUUSD
Gold fell to a low of around 3345 during the day and then rebounded rapidly. It is currently repeatedly testing the 3355-3353 line.👨💻
Although Federal Reserve Chairman Powell has not given clear instructions, the market is generally optimistic about the September interest rate cut. 📈The bullish sentiment in the market still exists, and the moving average continues to spread upward, laying a solid foundation for market bulls🐂
If gold cannot effectively fall below 3355-3353 during the European session, then gold is expected to rise again during the NY session. First, if the gold price breaks through the intraday short-term high of 3365,🚀 the gold price may reach a rebound of 61.8%, which is around 3373. 🎯
If the European session hits the resistance level of 3365 and is rejected,🙅♂️ it may trigger a small pullback to 3345-3340 to provide long trading opportunities.🐂 Once it falls below 3340, 🐻it is necessary to stop loss in time and pay attention to the first-line defense situation of 3333

Gold Bullish trend h1 chart target Now full bullish
Gold buy from 3271
3267 sl 3259 target 3338 don't miss trade best of luck 🤞

XAUUSD Signal Today | Do you think Gold will retest $3400XAUUSD Buy Sell Signal Today | Do you think Gold will retest $3400 resistance? Every gold trader should watch today! In this video, we have the latest XAUUSD technical analysis and provide clear buy and sell levels for scalpers and swing traders. If you want to know if Gold will retest $3400 resistance, stay tuned until the end for exclusive insights, real chart breakdowns, and the best price action strategies. This video will help both new and professional traders make smart trading decisions with live examples and updated gold signals.
#GoldPrice
#XAUUSD
#GoldSignal
#GoldTrading
#TechnicalAnalysis
#GoldForecast
#BuySellSignal
#GoldResistance
#ForexTrading
#livegoldanalysis

Chart Type:* XAUUSD (Gold) – 15 min chart Pattern:AscendingHere’s a simpler breakdown with highlights:
---
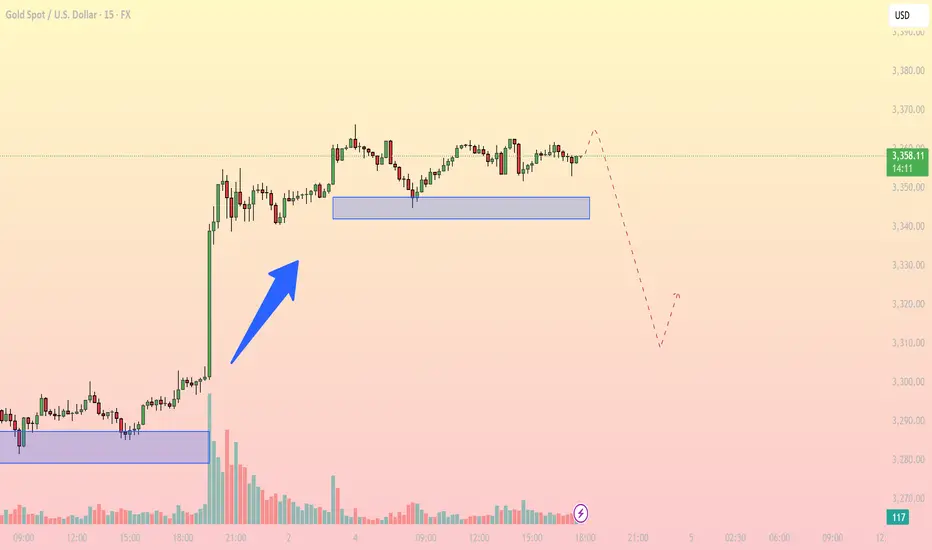
*🟡 Chart Type:* XAUUSD (Gold) – 15 min chart
*📊 Pattern:* *Ascending Bullish Triangle*
---
*🔹 Key Highlights:*
- *Orange Line:* Rising *support* (buyers pushing price up)
- *Purple Zone:* Strong *resistance* area (price keeps rejecting)
- *Blue Arrow:* Suggesting a *breakout* to the upside
- *White Path:* Expected *price movement* if breakout happens
---
*🎯 Target Zone (Green Area):*
Where price may go if breakout is successful
*🛑 Stop-Loss Zone (Red Area):*
Where to exit trade if breakout fails
---
📝 Simple Explanation:*
Price is going up slowly and getting squeezed. If it breaks above the purple line, a *strong bullish move* is expected.

XAUUSD Long - DiscretionaryElite Analysis - Discretionary Trade
Not Rules Based Execution
Executed in a lower OB in lower time frame
Targeting upper liquidity pools
I believe we are bullish on gold until structured liquidity, than we will see an violent drop.

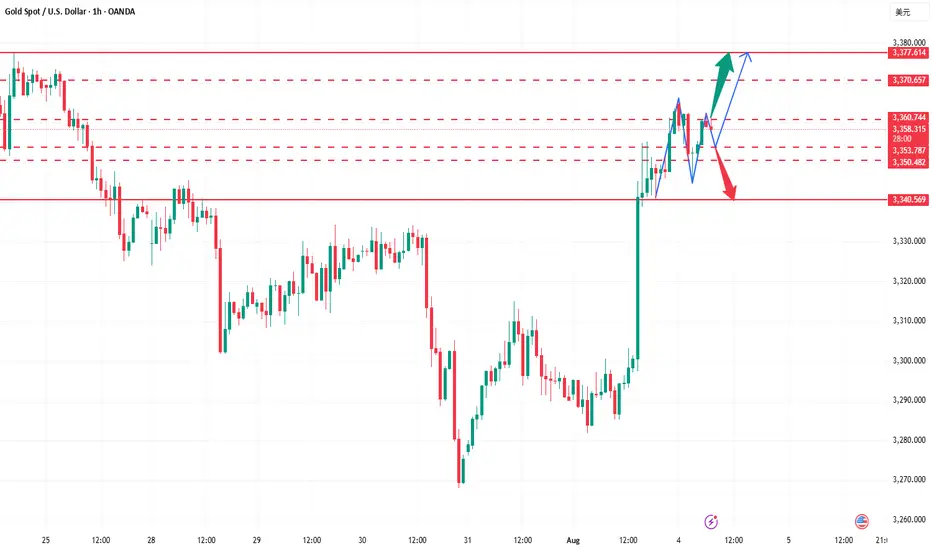
Distribution Phase at the Top, Key Support in FocusFollowing a sharp breakout from the demand zone around $3,310, gold has entered a sideways consolidation range between $3,355 – $3,367. The price has repeatedly tested the support at $3,352 – $3,354 but failed to form higher highs beyond $3,367. This signals buyer exhaustion and a potential distribution pattern at the top.
The inability to push higher suggests increased risk of a bearish breakdown.
Key Technical Levels
Immediate Resistance: $3,367.77
Short-Term Support: $3,352 – $3,354 (blue box zone)
Major Support Below: $3,310 – $3,315 (previous breakout base, near 0.5 Fibonacci retracement)
Suggested Trading Strategies
Primary Scenario: Sell on Breakdown
Trigger Condition: Price breaks below $3,352 with increasing volume
Entry: $3,350
Stop Loss: $3,360
Target: $3,320 – $3,310
This is a momentum-following setup, ideal if the current support fails.
Alternative Scenario: Buy from Major Support
Entry Zone: $3,310 – $3,315
Stop Loss: Below $3,300
Target: $3,345 – $3,355
Suitable for counter-trend traders looking to catch a rebound off strong demand.
Additional Technical Signals
EMA 20 (15m): Flattening out, indicating loss of bullish momentum
RSI: Hovering around 50, showing a balance between buyers and sellers
Volume: Gradually decreasing, suggesting a potential breakout setup is building
Gold is currently in a distribution phase after a sharp upward move. If the $3,352 support zone breaks, a retracement toward $3,310 – $3,315 is likely. However, bulls may step back in around that zone for a potential rebound.
Follow for more real-time gold strategies. Save this post if you find it useful for today’s session!
Gold Struggles at Resistance – Indicates Lower Lows AheadGold has been in a clear downtrend after facing a strong rejection around the 3,438 level (main resistance zone). Price is currently moving within a descending channel, confirming the formation of lower highs and lower lows – a classic bearish market structure.
Currently, Gold is trading near 3,306, facing resistance at 3,339 (marked as a possible lower high). If price fails to break above this level and sustain, there is a strong probability of continuation towards 3,249 and even 3,216.
Key Technical Highlights
- Immediate Resistance: 3,339 – 3,353
- Support Levels: 3,301 (short-term), 3,249, and 3,216
A rejection near 3,339 can lead to another leg down targeting 3,249 and 3,216. However, a strong breakout above 3,339–3,353 could temporarily shift momentum towards 3,394.
Note
Please risk management in trading is a Key so use your money accordingly. If you like the idea then please like and boost. Thank you and Good Luck!

Gold soaring with NFP debacle as an catalystQuick update: Gold is Trading on NFP fuelled relief rally and Bearish Technicals are invalidated once again (I announced lately that this might happen if NFP delivers downside surprise / debacle). The Hourly 4 chart's Ascending Channel increases it's gains towards Overbought levels as #3,352.80 benchmark is showcasing strong durability. Both Weekly chart (#1W) and Monthly (#1M) are on mild gains (# +0.65% and # +0.71% respectively) and with ranging candles (Gold consolidating above the Support for the fractal) I do not see any rebound (to the downside) possibility yet.
My position: As discussed above, I will keep Buying every dip on Gold and will not Sell Gold throughout today's session (if I do, will be aggressive in & out Scalp only). Gold remains very sensitive to every Bullish development while Bearish ones are still on second place.

xau longnews on the tariff on swiss last friday, should still have a up ward movement.
wait for retest to enter this.
expecting bull flag strat, if triple top, exit the trade. or sl be
been very busy lately, also doing well with our copy trading, we also launched a smart plan copytrading service.
we have partnered with Blackbull markets to give the best spreads of roundtrip 5.5 usd.
see profile to get updated.

Gold Trading Strategy XAUUSD August 4, 2025Gold Trading Strategy XAUUSD August 4, 2025:
Gold prices rose more than 2% last Friday, hitting a one-week high, as weaker-than-expected US non-farm payrolls data boosted hopes for a Federal Reserve rate cut and the announcement of new tariffs fueled safe-haven demand for gold.
Fundamental news: The non-farm payrolls report showed only 73,000 jobs added in July, well below market expectations of 110,000. The unemployment rate rose to 4.2%, indicating a cooling labor market.
Technical Analysis: Gold prices are rising strongly after a strong candle in the 3285 - 3300 area as previously predicted. The bullish pattern on the H1 frame has shown that the buyers are returning very strongly. Currently, the price is showing signs of sideway at the 336x area, our strategy today will be to wait for trading at the support zones of the gold price. Important price zones today: 3315 - 3320 and 3330 - 3335.
Today's trading trend: BUY.
Recommended orders:
Plan 1: BUY XAUUSD zone 3330 - 3332
SL 3327
TP 3335 - 3345 - 3355 - 3370.
Plan 2: BUY XAUUSD zone 3318 - 3320
SL 3315
TP 3323 - 3333 - 3343 - 3363.
Plan 3: SELL XAUUSD zone 3370 - 3372
SL 3375
TP 3367 - 3357 - 3347 - 3337 (small volume).
Wishing you a safe, smooth and profitable trading week.💗💗💗💗💗

GOLD SHORT TRADE VIEWAronnoFX will not accept any liability for loss or damage as a result of
reliance on the information contained within this channel including
data, quotes, charts and buy/sell signals.
If you like this idea, do not forget to support with a like and follow.
Traders, if you like this idea or have your own opinion, please feel free command me.

As the bull market continues, is gold poised to hit new highs?Judging from the current gold trend, the technical side opened high and closed low, releasing the demand for short-term adjustments. The intraday low hit 3344 and then rebounded, which is enough to reflect the resilience of the bulls. The hourly doji continued to rise, and the 3353 line was pulled up again. It is expected that it will be difficult to give an entry opportunity near 3340-3345 again. Since the new high has been refreshed again, the technical short-term adjustment may have ended. With the current strong bull structure, further testing the 3370-3380 area is a high probability event. If it unexpectedly falls below 3340 in the future, the bulls will no longer defend strongly, and the market may turn to volatility. Breaking below 3340 is also expected to open up short-term short space, but this is a later story. The current market structure is clear, and we continue to see a strong upward trend for the bulls. At least at the beginning of the week, I do not think the bull market is nearing its end.
Gold operation suggestion: go long around 3360-3355, target 3370-3380.Strictly set stop loss and control your position.
Gold Outlook- My BiasAlways know I do not own the market, I only predict what i think ,May happen and I may be wrong, but I have followed my set of rules.

Gold rebound is weak, short below 3315
Gold remains weak, with multiple intraday rebounds failing to maintain momentum. The upper moving average continues to suppress the market, and the short-term market remains dominated by bears. Today, we are following the trend and taking a bearish stance. The key upside level is around 3315. If it reaches this level before the US market opens or if it peaks in the short term, we will short sell. The non-farm payroll data will be released today, and we will consider reversing our direction based on the situation after the data.
Gold prices have once again encountered resistance to their upward trend, and the volatile pattern continues. The gold price trend is trending lower highs, and today's low is expected to be lower than yesterday's. Therefore, our intraday short target could be 3268 or even lower, so it's crucial to seize the right entry point.
If you're new to the market, come to me. I'll teach you how to trade while you learn. If you're already in the market and struggling, come to me. I'll help you avoid repeating the same mistakes. If you've already experienced this market and are battered, come to me. I'm confident I can help you regain confidence. If you're stuck in a position, I'll develop a strategy tailored to your entry point. Because everyone's trapped positions are different, the solutions will vary, some suitable for conservative traders and others for aggressive ones. However, I can't offer a perfect answer to every situation. I suggest you bring your order with you. Once you contact me, I'll use the most appropriate method to resolve your situation and help you exit the market.
Specific Strategy
Short gold at 3315, stop loss at 3325, target at 3280
