GOLD Technical Analysis! BUY!
My dear subscribers,
My technical analysis for GOLD is below:
The price is coiling around a solid key level - 3392.3
Bias - Bullish
Technical Indicators: Pivot Points Low anticipates a potential price reversal.
Super trend shows a clear buy, giving a perfect indicators' convergence.
Goal - 3397.7
Stop Loss - 3389.29
About Used Indicators:
By the very nature of the supertrend indicator, it offers firm support and resistance levels for traders to enter and exit trades. Additionally, it also provides signals for setting stop losses
Disclosure: I am part of Trade Nation's Influencer program and receive a monthly fee for using their TradingView charts in my analysis.
———————————
WISH YOU ALL LUCK
XAUUSD trade ideas

XAUUSD Rebound Setup Toward Key Resistance LevelsGold is testing its support trend line near 3,376, with potential for a rebound toward resistance at 3,401. A breakout above this level could open the path to the target zone around 3,425.

Gold Price Eyes Bullish Rebound After Triangle BreakoutGold (XAU/USD) is showing signs of a potential upward reversal after bouncing from the $3,350 support zone. The earlier symmetrical triangle (A-B-C-D) breakout led to sideways consolidation before a retracement. Price action now suggests bullish momentum could target $3,385, with strong support holding near $3,340. A break above the short-term resistance could confirm the rebound toward higher levels.
1. Symmetrical Triangle Breakout – The A-B-C-D pattern indicated price compression, followed by an upside breakout, showing bullish bias.
2. Support Zone – Strong support is established around $3,340–$3,350, holding despite recent selling pressure.
3. Retracement Phase – Price pulled back after peaking near $3,400, creating a lower-high sequence.
4. Bullish Reversal Signal – Recent bounce from support suggests buyers are stepping back in.
5. Upside Target – Immediate resistance lies near $3,385; a break above could lead toward the $3,400 zone.
6. Risk Factor – Failure to hold above $3,340 could open the door for further downside correction.

(Gold) Technical Analysis – Buy-Side Correction in PlayGold is currently undergoing a correction on the buy side, with price action suggesting the potential for further upside. The market is showing bullish momentum amid rising global uncertainty.
Dovish Fed Expectations: Increasing speculation around potential Fed rate cuts, along with discussions about leadership changes (including the possible replacement of Kugler and Powell), is contributing to a more accommodative outlook. Geopolitical & Trade Tensions: Continued escalation of global trade conflicts is boosting demand for safe-haven assets like gold, adding to bullish pressure.
If the price holds above the 3370–3380 support zone, bullish continuation toward 3420/3440 is likely in the short term.
You May find more details in the chart.
Ps; Support with like and comments for better analysis

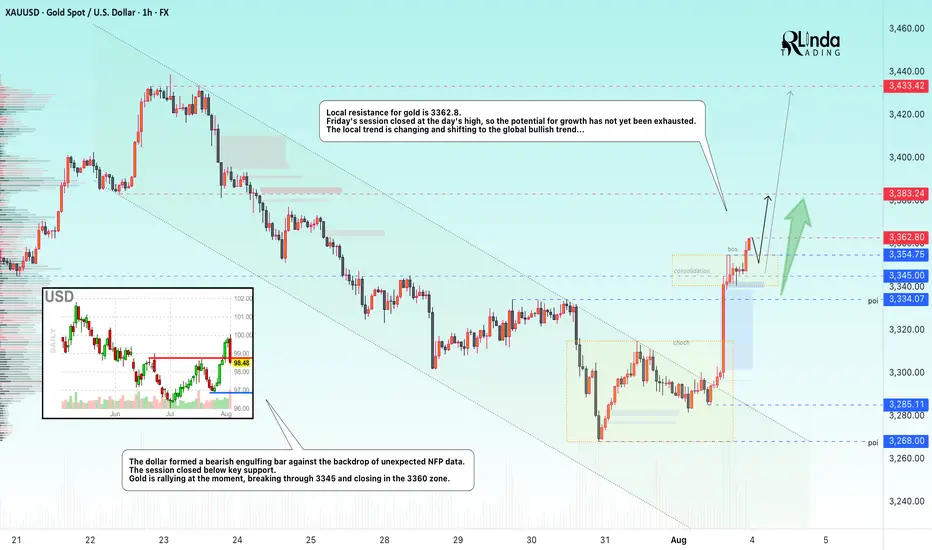
GOLD → The rally following weak NFP data may continueFX:XAUUSD is moving into distribution (rally) on the back of unexpected NFP data released on Friday. The dollar is plummeting...
Fundamentally, the gold market is getting support from an influx of funds after the unexpectedly weak NFP report. Against this backdrop, Trump said that the employment data had been “rigged” to make him look bad...
I believe that the situation is somewhat different: the president's administration failed to control this moment, hoping to see positive dynamics. Powell now has a small trump card to control his actions. The reduction in interest rates will most likely be postponed until the fall.
Technically, on D1, gold is rebounding from the support of the global trading range, forming a local bullish trend that coincides with the global one.
Resistance levels: 3362.8, 3383, 3433
Support levels: 3345, 3334
Gold is exiting the local downward channel, breaking through resistance at 3334 and 3345. Consolidation is forming, and by the end of the session, the price will break through resistance at 3354.75. The market is quite strong. Focus on two levels: 3362.8 and 3354.7. At the opening of the session, the price may attempt to break through the resistance level of 3362.8. If gold consolidates above this level, growth may continue. If not, then before further growth, the market may test the support level...
Best regards, R. Linda!
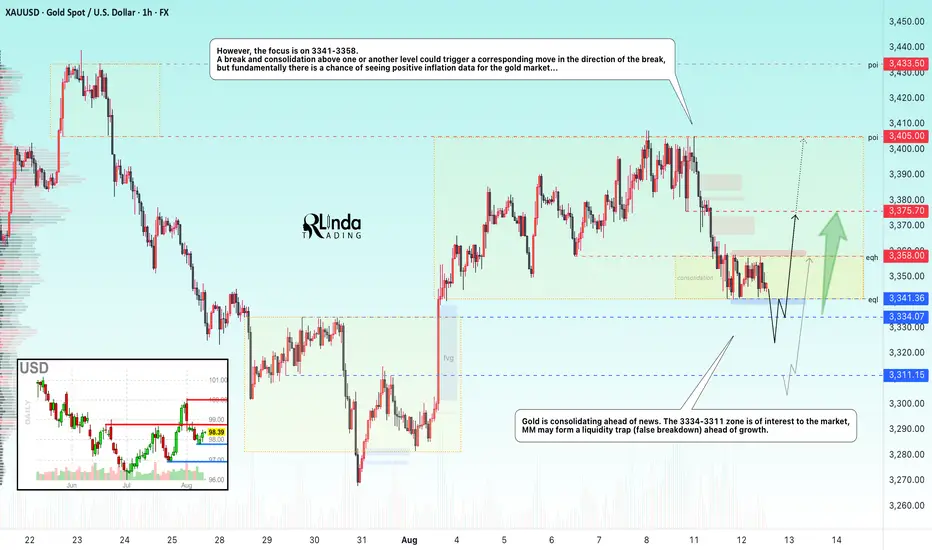
GOLD → Consolidation ahead of CPI data...FX:XAUUSD is consolidating ahead of news. Inflation is on the horizon, and further developments for the dollar and gold will depend on the data. Globally, gold is in a bullish trend, but locally we are seeing a correction...
Gold is rebounding slightly from $3,341 ahead of US CPI data for July and against the backdrop of the extension of the US-China trade truce until November. Investors are assessing the prospects for a Fed rate cut, expecting inflation to remain within 2.8% (core inflation is 3%). Weaker-than-expected data could cause the dollar to fall and support gold, while stronger data could resume the downward trend.
Technically, on D1-H4, gold is consolidating in a symmetrical triangle pattern and the price is in the support zone. There is a possibility that Trump may not make a mistake with inflation data, as he did with employment data...
Support levels: 3341, 3334, 3311
Resistance levels: 3358, 3375, 3405
The 3335-3310 zone attracts MM with an open FVG, which the market may partially close, forming a liquidity trap before continuing growth. However, it is also worth watching the boundaries of the current local consolidation, as a breakout of one or the other boundary could trigger a strong impulse.
Best regards, R. Linda!
Gold 30Min Engaged ( Buy and sell Reversal Entry Detected )Time Frame: 30-Minute Warfare
Entry Protocol: Only after volume-verified breakout
🩸Bullish Reversal - 3329
🩸Bearish Reversal - 3370
➗ Hanzo Protocol: Volume-Tiered Entry Authority
➕ Zone Activated: Dynamic market pressure detected.
The level isn’t just price — it’s a memory of where they moved size.
Volume is rising beneath the surface — not noise, but preparation.
🔥 Tactical Note:
We wait for the energy signature — when volume betrays intention.
The trap gets set. The weak follow. We execute.
XAUUSD Continuation fallowing PullbackGold is currently retesting the support zone and showing signs of potential upside movement. The market is reacting to expectations of Fed policy easing, which is supporting gold prices. Upcoming ISM PMI data is a key catalyst — stronger-than-expected figures could cause volatility.
Gold declined from the 3374 level, showing a false breakout to the downside.
Key support is forming around 3360 — if broken, a bearish trend may resume at 3342nIf the 1H candle closes above 3370, this could indicate renewed bullish momentum.
Resistance to watch: 3400 and 3420.
You May find more details in the chart.
Ps; Support with like and comments for better analysis.

XAUUSD Buying Opportunity from Key Support ZoneXAUUSD – Gold Price Analysis for August 11, 2025: Buying Opportunity from Key Support Zone
In today’s session, gold (XAUUSD) on the H1 timeframe is pulling back after breaking the short-term support zone at 3,376 – 3,378 and moving down towards 3,356 – 3,358 – which aligns with the 0.618 Fibonacci retracement of the previous bullish swing. This is a key support area where buyers may step in if the market reacts positively.
1. Technical Analysis
EMA: Price is trading below the short-term EMA, showing sellers in control, but the gap is small, leaving room for a potential rebound.
Fibonacci: The 0.618 level around 3,356 acts as a technical pivot and strong support.
RSI: Approaching oversold territory, signaling a possible technical bounce.
Trendline: Price is testing the medium-term ascending trendline from late July. Holding this level would strengthen the bullish outlook.
2. Key Price Levels
Near-term Resistance: 3,376 – 3,378
Major Resistance: 3,383 – 3,384 and 3,393 – 3,395
Near-term Support: 3,356 – 3,358
Major Support: 3,340
3. Trading Strategies
Primary Scenario: Buy around 3,356 – 3,358, stop loss below 3,348, take profit at 3,376 – 3,378, extended targets at 3,383 – 3,393.
Alternative Scenario: If price breaks below 3,348 with strong volume, consider selling towards 3,340 – 3,328.
Today’s bias remains buying at support – taking profit at resistance. Traders should closely monitor price action at these levels to optimize entries.
Follow for more actionable gold trading strategies in the upcoming sessions.

Gold Maintains Bullish Momentum – Eyes $3,400📊 Market Summary:
Gold surged past the $3,385 resistance to reach a new high at $3,390, driven by weaker-than-expected ISM Services PMI data. The U.S. dollar softened and Treasury yields dipped, fueling the rally. However, after hitting the peak, some profit-taking emerged, causing gold to pull back slightly and currently trade around $3,383.
________________________________________
📉 Technical Analysis:
• Key Resistance:
$3,390–$3,395 – short-term local high. If this zone breaks, the next target is $3,400+.
• Nearest Support:
$3,380, followed by the previous breakout level at $3,365, both likely to act as support during any pullback.
• EMA 09 (Daily):
Price remains above the 9-day EMA, confirming the continuation of the short-term uptrend.
• Momentum / Volume / Candlestick:
RSI is holding above 60 – bullish. However, a long upper wick near $3,390 suggests short-term selling pressure or hesitation.
________________________________________
📌 Outlook:
Gold is showing bullish momentum, with the uptrend confirmed after breaking above $3,385. If price holds above $3,380, there's a strong possibility of testing the $3,400 level. However, a failure to sustain above this zone could lead to a retest of $3,365.
________________________________________
💡 Suggested Trade Strategy:
🔺 BUY XAU/USD : $3,380–$3,383
🎯 TP: 40/80/200 pips
❌ SL: $3,377

8/12: Key Support at 3343–3337, Resistance at 3366–3372Good morning, everyone!
Yesterday, the market saw a one-sided drop, with selling pressure on the 4H chart largely released. However, the daily bullish structure has been damaged. Given the size of yesterday’s decline, there’s a decent chance of an intraday rebound today.
Key support levels to watch are 3343–3337 and 3328–3323, while resistance sits at 3352–3358 and 3366–3372–3378. Trading should focus on these zones.
With today’s news-driven volatility likely to exceed yesterday’s, if the downtrend continues, I see 3312–3298 as an attractive buying opportunity. My overall bias for the day remains buying on dips, with potential short opportunities near resistance.


Gold Retesting Support 3,350–3,345-Short-Term Buying Opportunity📊 Market Overview
Gold is currently trading around 3,350 USD/oz, slightly higher than the previous session thanks to expectations that the Fed will cut interest rates amid a weakening USD. The market remains cautious ahead of upcoming U.S. inflation data, which could provide new momentum for gold prices. Additionally, President Trump’s confirmation that gold imports will not face tariffs has helped stabilize investor sentiment.
📉 Technical Analysis
• Key Resistance: 3,400 – 3,410 USD/oz
• Nearest Support: 3,345 – 3,350 USD/oz
• EMA09: Price is currently below the EMA09 on the H1 timeframe → short-term downward pressure still persists.
• Candlestick / Volume / Momentum: After a sharp drop on August 11, price is sideways around the support zone; RSI on H1 is about 56, not yet overbought, indicating potential for a rebound if support holds.
📌 Outlook
Gold could rebound short term from the 3,350–3,345 zone if U.S. inflation data comes in lower than expected and the USD continues to weaken. However, if price breaks below 3,345 with strong selling pressure, the downtrend may extend to 3,335 or 3,330.
💡 Suggested Trading Strategy
BUY XAU/USD: 3,346 – 3,343 USD/oz
🎯 TP: 40/80/200 pips
❌ SL: 3,339 USD
SELL XAU/USD: 3,407 – 3,410 USD/oz
🎯 TP: 40/80/200 pips
❌ SL: 3,413 USD

Wait for a pullback and then test the previous high#XAUUSD
The gold market closed positively on the daily chart, with strong support near 3345-3340 below. The market trend is still dominated by bulls,🐂 but the daily moving average support is too far from the high point. It is not ruled out that it may retreat to the moving average support near 3345-3340,📊 and then rise again.🚀
From the monthly chart, 🌙although the monthly chart closed positive, the market is generally converging at a high level. Upper resistance remains, and a breakout is unlikely without breaking through this resistance level (no further discussion will be given).📉
Judging from the weekly chart, the Bollinger Bands have shrunk, and the MACD indicator has formed a death cross with large volume, indicating weak fluctuations at the weekly level.😩
Judging from the daily chart, 📊the current technical indicators are tending to the zero axis, and the rapid upward correction of the smart indicator indicates that the price fluctuation tends to rebound. The current focus is on yesterday's high around 3385. It is expected to break through 3430. The lower support Bollinger band middle track and moving average tend to stick together around 3346-3340.🌈
Judging from the hourly chart and 4H chart, 📊the overall rhythm tends to fluctuate and fall. The short-term pressure from above is around 3375-3385, and a break above will definitely lead to an increase.📈
On the whole, pay attention to yesterday's NY starting point near 3365-3360, and the strong support below is 3346-3340. The hourly and 4H charts tend to fluctuate and fall, so for short-term trading we need to short on rallies. 📉
Intraday trading suggestions are as follows:
1. Consider going long currently around 3365-3360📈, targeting 3374-3380🎯. If it breaks through, look for 3400.
2. Go long if it retraces below 3355-3340, targeting 3375-3385. Wait for further adjustments.🐂
3. If the price first reaches the resistance level of 3375-3385 and holds, consider going short with a small position and anticipate a pullback towards 3365-3355.🐻
Gold short opportunityGold completed its mini bull flag target and re-entered a micro rising channel, a potentially bearish structure.
With price now testing a key supply zone, we’re watching for rejection to initiate a short, targeting the major demand zone below.

XAUUSD Analysis – August 12 – 4H ChartOn the 4H timeframe, gold is forming a Bullish Harmonic structure (likely a Gartley or Bat pattern), with point D appearing around the strong support zone 3,349 – 3,346 USD, aligning with the 0% Fibonacci level and previous swing low.
1. Technical Breakdown
Harmonic Pattern:
A → B: Strong bearish leg.
B → C: Retracement to the 61.8 – 78.6% Fibo zone.
C → D: Decline to the 88.6 – 100% Fibo zone, touching a strong support area and giving potential reversal signals.
Fibonacci Retracement Key Levels:
50%: 3,352 USD.
61.8%: 3,353 – 3,354 USD.
78.6% – 88.6%: 3,355 – 3,356 USD (near-term resistance target).
Volume: Bullish wick candles at point D with higher volume, indicating bottom-picking activity.
EMA: Price is currently testing the short-term EMA; a successful breakout could open the way toward higher resistance levels.
2. Trading Scenarios
Scenario 1 – Buy following the Harmonic pattern (Preferred):
Entry: 3,349 – 3,350 USD.
Stop Loss: 3,343 USD (just below point D by ~6–7 USD).
TP1: 3,352 USD (Fibo 50%).
TP2: 3,355 USD (Fibo 61.8%).
TP3: 3,358 USD (major resistance + Fibo 78.6%).
RRR: ~4.8 as seen on the chart, suitable for short-term swing setups.
Scenario 2 – Sell against the pattern (High Risk):
Only consider if price breaks strongly below 3,343 USD with high volume.
Target: 3,338 – 3,335 USD.
3. Key Notes
Prioritize buying as long as price holds above point D with bullish confirmation on H1–H4 timeframes.
If price rallies but fails to break above 3,355 USD, consider partial profit-taking and moving SL to breakeven.
Risk management: limit to 1–2% per trade, avoid FOMO entries.

At which support zone will the correction wave end?✏️The accumulation of Gold price in today's trading day from Fibocacci 0.5-0.618 is raising the question of whether the bullish wave structure will continue. Previously a perfect push of Gold price from 3282 to 3406 formed a wave 3 increase, currently the decline in the beginning of the week of Gold is running in the corrective wave of wave 4. 3330 is an important zone in the bullish wave structure, if this zone is broken, the market will end the bullish wave towards ATH.
📉 Key Levels
BUY trigger The reaction of the buying candle at 3330
BUY trigger The confirmation of the candle closing above 3357 (fibonacci 0.618)
Target 3383 Higher is 3431
Leave your comments on the idea. I am happy to read your views.

XAUUSD Gold Trading Strategy August 11, 2025XAUUSD Gold Trading Strategy August 11, 2025:
At the beginning of the new week's trading session, the gold price fell sharply from the 340x area to the current 335x area.
Basic news: The US Dollar Index (DXY) fell to around 98 last week, unable to stay above 100. Although the 10-year Treasury yield rose to 4.285%, the Dollar remained under pressure, reflecting market concerns about political risks in the United States.
Technical analysis: After the price met the 340x resistance area, it fell sharply. Currently, the H1 frame MA lines have turned into resistance, but the H4 frame is still support. The H1 frame RSI is showing signs of increasing again and moving towards the average line; the H4 frame RSI is adjusting towards the oversold area. We will wait at the resistance areas and liquidity areas to trade.
Important price zones today: 3375 - 3380, 3350 - 3355 and 3395 - 3400.
Today's trading trend: SELL.
Recommended orders:
Plan 1: SELL XAUUSD zone 3378 - 3380
SL 3383
TP 3375 - 3365 - 3355 - 3330.
Plan 2: SELL XAUUSD zone 3395 - 3397
SL 3400
TP 3392 - 3382 - 3362 - 3330.
Plan 3: BUY XAUUSD zone 3353 - 3355
SL 3350
TP 3358 - 3368 - 3378 - 3390 (small volume).
Wish you a safe, successful and profitable new trading week.🥰🥰🥰🥰🥰

XAUUSD has broken out of the channelBased on my analysis, XAUUSD has broken out of the channel and reached the weekly breakout zone. I anticipate a retracement back into the channel, followed by a decline.

GOLD NEXT MOVE (expecting a bearish move)(08-08-2025)Go through the analysis carefully and do trade accordingly.
Applicable- once price reaches the 3372-75
Anup 'BIAS for the day (12-08-2025)
Current price (as per applicability)- 3370-75
"if Price stays below 3388, then next target is 3365, 3355 and 3300 and below that 3250 and above that 3400 ".
-POSSIBILITY-1
Wait (as geopolitical situation are worsening )
-POSSIBILITY-2
Wait (as geopolitical situation are worsening)
Best of luck
Never risk more than 1% of principal to follow any position.
Support us by liking and sharing the post.

THE KOG REPORT - UpdateEnd of day update from us here at KOG:
Not a bad day at all on the markets with gold holding the 3345-50 support level and giving the push upside as we wanted. We managed to complete our Excalibur targets and hit the ideal target level which was share in the NFP KOG report to complete the move.
Now, we need to play a little caution here as we have bounced the red box box as anticipated and a small RIP is in progress. Support stands at the 3364 level with resistance above 3377. We'll expect there to be a hunt above so lets make sure to protect and manage.
KOG’s bias for the week:
Bullish above 3340 with targets above 3370✅, 3373✅, 3379✅ and above that 3384✅
Bearish on break of 3340 with targets below 3330, 3320 and below that 3310
RED BOXES:
Break above 3365 for 3372✅, 3375✅, 3379✅, 3384✅ and 3390 in extension of the move
Break below 3350 for 3346, 3340, 3335 and 3330 in extension of the move
As always, trade safe.
KOG
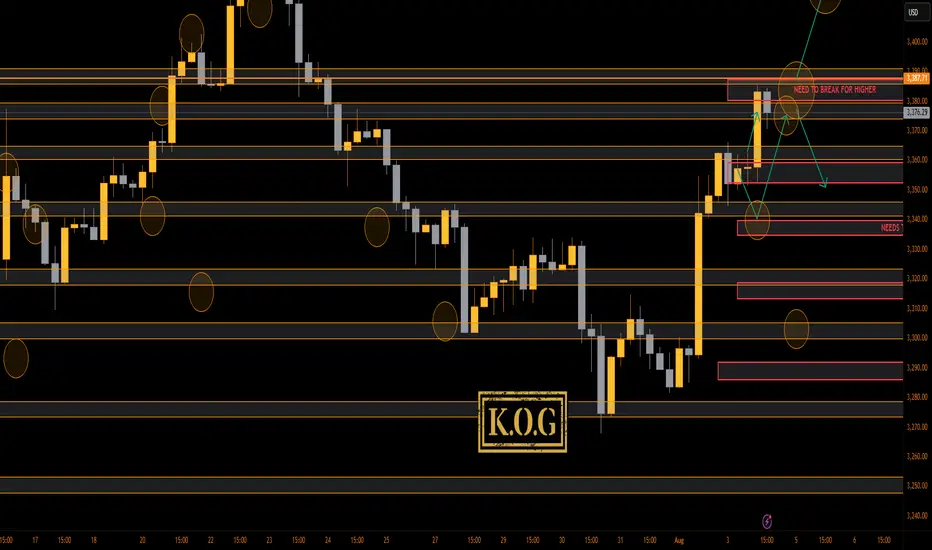
THE KOG REPORT - NFP UPDATE 1H 1H:
This is the chart we used last week for the FOMC and NFP KOG Reports. From the chart we can see the low was captured for FOMC and NFP didn’t give us an undercut low. We’ve kept the potential target box from the Report and for now we’ll stick with it. Red box defence is active below at the 3340-5 level and the ideal target stands above in the oval as long as we remain above the 3340 bias level.
KOG’s bias for the week:
Bullish above 3340 with targets above 3370, 3373, 3379 and above that 3384
Bearish on break of 3340 with targets below 3330, 3320 and below that 3310
RED BOXES:
Break above 3365 for 3372, 3375, 3379, 3384 and 3390 in extension of the move
Break below 3350 for 3346, 3340, 3335 and 3330 in extension of the move
Please do support us by hitting the like button, leaving a comment, and giving us a follow. We’ve been doing this for a long time now providing traders with in-depth free analysis on Gold, so your likes and comments are very much appreciated.
As always, trade safe.
KOG

Bearish trend for GoldAre you ready for bearish trend of Gold?
After touching upper line of channel, Gold is ready for starting bearish trend.
