GOLD → Consolidation after the rally...FX:XAUUSD is not falling back after a strong rally, but is consolidating against resistance at 3362.8. Continued high demand could allow the market to strengthen...
The price of gold halted its two-day rally, trading around $3362.8 on Monday morning after weak US employment data. This heightened concerns about the US economy and increased the likelihood of a Fed rate cut in September to 80%.
Additional pressure on the dollar came from the dismissal of BLS chief Erika McAntfer, which raised suspicions of statistics manipulation. Market attention is also focused on US-Canada trade talks, which could affect investor sentiment. Gold is consolidating for now, but its further growth will depend on the dynamics of the dollar and macroeconomic data.
Resistance levels: 3362.8, 3383, 3433
Support levels: 3345, 3334
As the market has now entered a consolidation phase, MM may form a retest of support before a possible rise in order to accumulate liquidity. However, a breakout of resistance at 3362.8 could trigger further growth.
Best regards, Linda!
XAUUSD trade ideas

Gold completes corrective structureXAUUSD August 8: Gold completes corrective structure – Buy opportunity on breakout
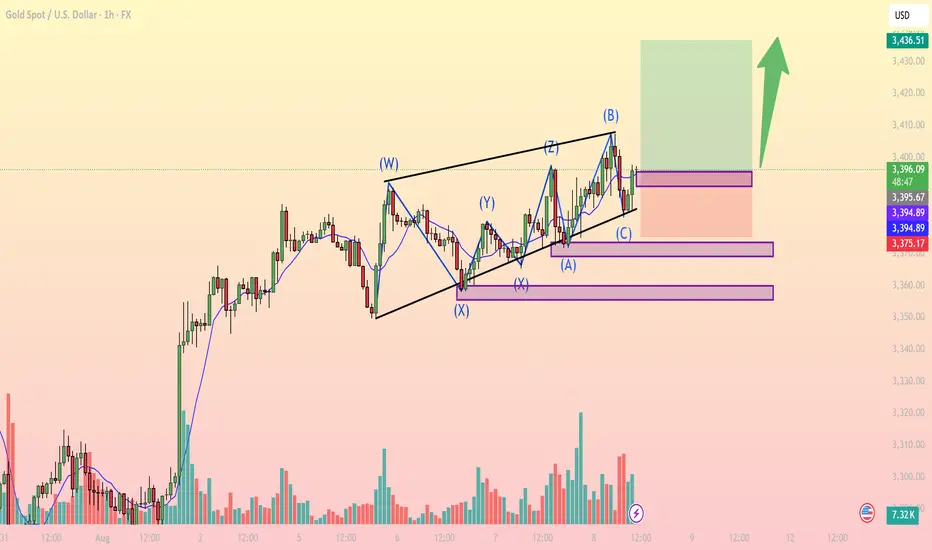
On the 1H chart, Gold (XAUUSD) has been consolidating within a complex WXYXZ corrective pattern following the strong bullish rally from August 1st. The recent (A)(B)(C) correction within wave Z appears to have completed, with price currently bouncing from a key demand zone around 3,394 – 3,395 USD.
Key bullish signals:
Corrective pattern completed: Wave (C) touched the lower trendline and showed a bullish reaction, suggesting end of the correction.
EMA bounce: Price is finding support from the short-term EMA, indicating a potential return of bullish momentum.
Rising volume: Especially after testing the 3,375 support zone, buying volume has increased, confirming accumulation.
Fibonacci confluence: The 3,394 level aligns with the 61.8% retracement of the previous bullish leg – a strong support zone for long entries.
Important price levels:
Immediate support: 3,394 – 3,395 (ideal buy zone).
Stronger support: 3,375 (stop-loss placement).
Resistance / Take Profit: 3,436 (previous high and supply zone).
Suggested Trading Strategy:
Bias: Long (Buy)
Entry: 3,395
Stop-loss: 3,375
Target: 3,436
Risk/Reward Ratio: ~1.99 – solid for an intraday setup.
Note: If price breaks below 3,375 with high volume, consider exiting early to avoid deeper downside toward 3,333.
Conclusion: Gold is likely resuming its uptrend after a complex corrective phase. This presents a potential long opportunity with a favorable risk/reward ratio if executed properly within the marked levels.
Follow for more high-quality trading setups – and don’t forget to save this idea if it fits your trading plan.
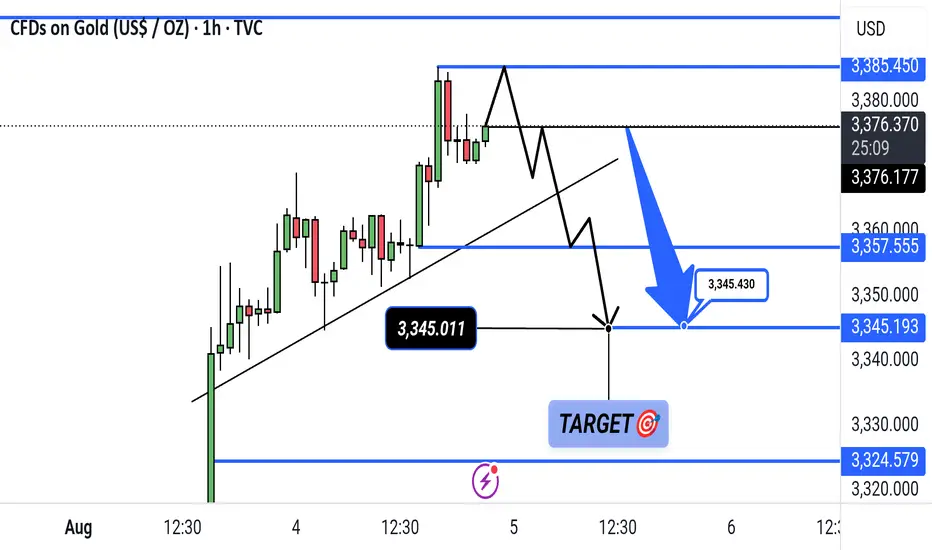
Gold Bearish Breakdown Setup – Targeting 3324 ZoneGold is showing a potential bearish setup on the 1-hour chart. A break below the key support zone at 3345 could trigger a downward move toward the target at 3324.579. Price action suggests a possible lower high formation before the drop.
DeGRAM | GOLD reached the resistance level📊 Technical Analysis
● XAUUSD rebounded from the lower channel boundary near 3,294 and reclaimed resistance at 3,357.8, confirming bullish continuation inside the rising structure.
● Breakout above the triangle’s descending resistance line opens upside toward 3,435 and possibly 3,487 on strong momentum continuation.
💡 Fundamental Analysis
● Gold found renewed support as US NFP and ISM data showed softness, weakening the dollar and lowering real yields.
● Rising geopolitical risk and increased central bank gold buying in July continue to support bullish sentiment.
✨ Summary
Long above 3,357. Target 3,435 ➜ 3,487. Setup holds while price stays above 3,294 channel base.
-------------------
Share your opinion in the comments and support the idea with a like. Thanks for your support!

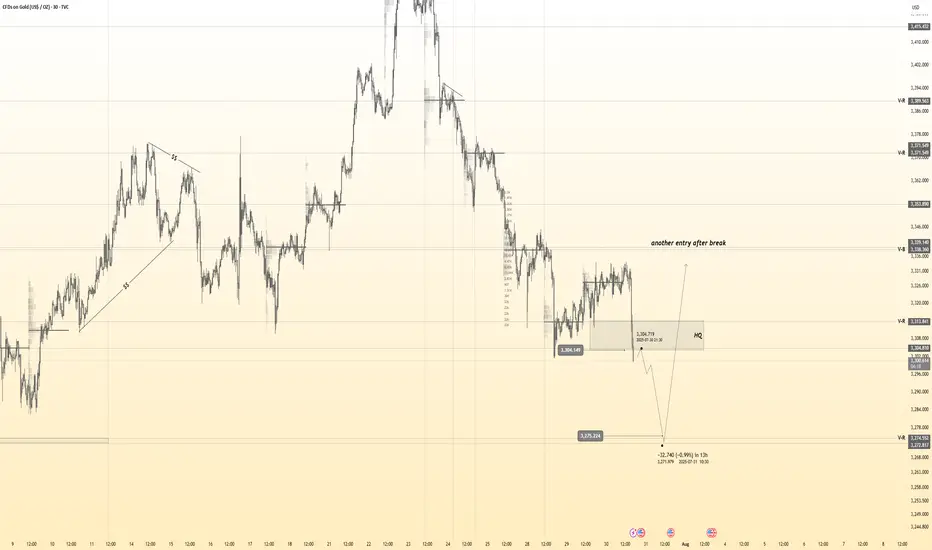
Gold Eyes QML Resistance: Ready for a PullbackHelloooo!
Gold, after gapping up strongly, has now entered the green QML (Quasimodo Level) supply zone at roughly 3,380–3,390. This zone has acted as resistance before, so a reaction here makes perfect sense.
What I see:
Engulfed Level (3,315.66): Earlier support that got taken out. This is our logical pullback target once the QML zone does its job.
Hurricane Move: The big up-spike looks exhausted now that it’s hit the QML.
Bearish Reversal Odds: if sellers step in around current levels, expect a drop back toward 3,315.
Plan: Watch for bearish candles or a failed rally inside the 3,380–3,390 area. If we see clear rejection, target a swift move down to 3,315, with a further slide possible to the 3,260 demand zone if momentum holds.

GOLD-SELL strategy monthly chart Reg. ChannelGOLD is poised to correct medium-term. The market has carried away as usual, and based on move beyond the channel, and overbought status, we should expect a solid correction downward.
Strategy SELL @ $ 3,340-3,900 and take profit near $ 2,875 for now.

XAUUSD – Bears Eye 3316 as 200 MA CracksOn the 1H chart, Gold (XAUUSD) just confirmed a break below the 200 EMA, signaling a potential momentum shift in favor of sellers. Price previously retraced into the Fair Value Gap (FVG) and failed to sustain above, which adds to the bearish sentiment.
With the rejection from the FVG and fib-based projections, my expectation is for price to push down towards the 1.618 Fib extension at 3316.50. If bearish momentum remains strong, further downside levels could be in sight at 3299 (Fib 2.0) and 3281 (Fib 2.272).
📉 Bias – Bearish
📍 Key Resistance – FVG zone
🎯 Target Levels – 3316.50 → 3299 → 3281


GOLD Price could retest Support after GrowthGold remains in a bullish zone overall, but today’s price action shows a potential short-term downtrend forming. Weak China PPI data Profit-taking ahead of the US inflation report Ongoing uncertainty in US–China trade negotiations. Tensions over microchip policy between the US and China.
Key range to watch: 3350 – 3400.
3350 is acting as a strong support — a hold above could lead to a rebound A sustained break above 3400 may open the path toward higher targets.
If you want, I can also make you a chart-ready short version for quick posting to your audience. That way, it’s concise but still professional.
Ps; Support with like and comments for better analysis Thanks for supporting.

H4 XAUUSD OutlookHello traders,
Gold continues to trade within a tight but decisive H4 structure, where every reaction is refining the path for the next impulsive move. This week’s chart is showing us well-defined supply and demand areas, each backed by clear order block structure, liquidity positioning, and confluences that align with both macro sentiment and intraday price action.
📊 Macro Context
USD Strength: The dollar remains pressured after recent US data hinted at slowing inflation momentum, keeping gold supported above key demand zones.
Geopolitical Tension: Ongoing Middle East tensions and mixed market sentiment keep safe-haven demand alive.
Upcoming Catalyst: US CPI later in the week could trigger a breakout from the current compression phase.
🎯 H4 Bias
Primary Bias: Bullish continuation while holding above 3345–3365 demand.
Secondary Bias: Bearish retracement possible only if we break below 3345 with conviction.
📍 Key H4 Structural Zones
🔴 Supply Zones
3418 – 3439 → Primary H4 Supply OB
Base: Last strong sell-off zone inside the HTF 3350–3439 supply.
Confluences: OB + liquidity grab + unfilled FVG.
3468 – 3490 → Intermediate H4 Supply OB
Base: Consolidation before the April drop, inducement above 3460.
Confluences: OB + partial FVG + RSI overbought H1/H4.
3500 – 3520 → Extended H4 Supply OB
Base: HTF OB overlap with unfilled imbalance.
Confluences: OB + D1 RSI overbought + Fibo extension 1.618.
🟢 Demand Zones
3345 – 3365 → Primary H4 Demand OB
Base: Multiple rejections + strong bounce origin.
Confluences: OB + EMA200 support + liquidity sweep.
3305 – 3325 → Intermediate H4 Demand OB
Base: Last bullish impulse before breaking 3345.
Confluences: OB + FVG fill + RSI oversold region.
3250 – 3275 → Extended H4 Demand OB
Base: Weekly/Daily OB alignment.
Confluences: OB + deep liquidity pocket + major swing low zone.
📌 Outlook Summary
Holding above 3345–3365 keeps the bullish scenario valid, targeting first 3418–3439, then 3468–3490.
A clean break below 3345 could open a deeper pullback towards 3305–3325.
Supply at 3500–3520 remains a major HTF target if both 3439 and 3490 get cleared.
Stay patient, wait for confirmation inside these high-probability zones, and remember — liquidity hunts often come before the real move.
💬 Let me know how you see Gold playing out from here — drop your thoughts,🚀🚀🚀 and follow for more structured updates!
— GoldFxMinds
Disclosure: This analysis is based on the Trade Nation feed and is for educational purposes only.

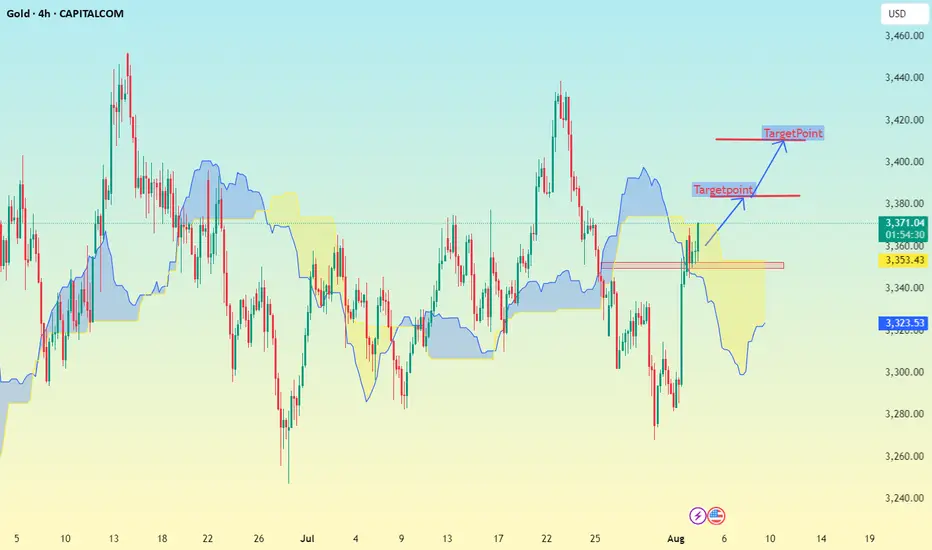
Gold 4H timeframe Based on the chart my shared (Gold 4H timeframe with Ichimoku cloud), here are the identified target points:
📈 Upside Targets:
1. First Target: 3380
This is marked just above the Ichimoku cloud breakout.
It is a short-term resistance zone.
2. Second Target: 3420
This is the higher target zone indicated in the chart.
It aligns with a previous high and potential resistance area.
---
🟡 Key Support:
Support Zone: Around 3322 – 3353
Price needs to hold above this zone to maintain the bullish momentum.
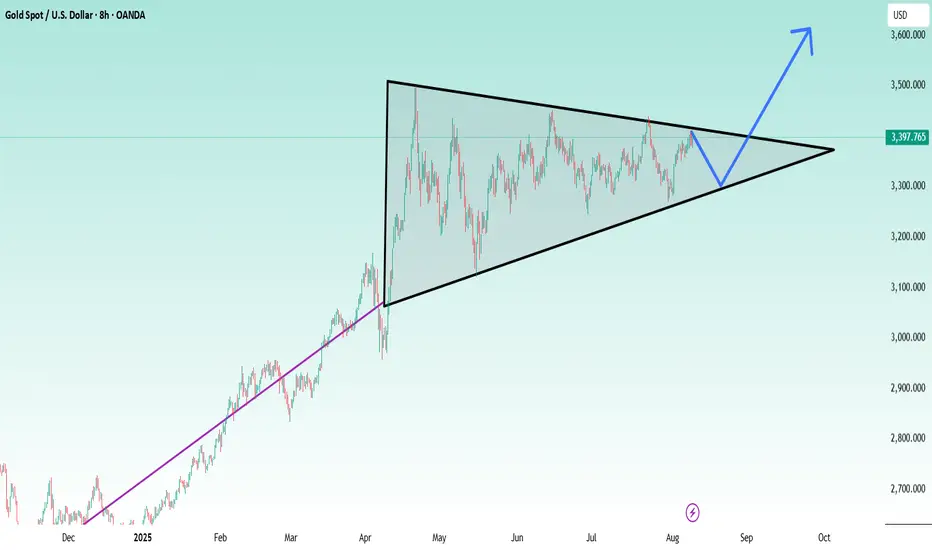
Lingrid | GOLD Weekly Market Analysis: Strong Bullish ReboundOANDA:XAUUSD market has demonstrated resilience with a strong bullish rebound following the NFP, suggesting that institutional buyers are stepping in at critical support levels. The precious metal is now testing key resistance zones that will determine whether the recovery can gain sustainable momentum.
The chart reveals a compelling technical setup with gold bouncing strongly just above the June low support zone around $3,265. This rebound has pushed price back above the $3,330 level and is now approaching the critical $3,400 resistance area. The strong bullish rebound after the NFP release indicates that the selling pressure faded, with buyers emerging at attractive levels near the June lows.
The previous pullback phase has been contained within the broader ascending channel structure, maintaining the overall bullish framework. The triangle pattern breakout to the downside appears to have been a false move, with the current rebound suggesting that the correction may be complete. The ability to hold above the previous week low has preserved the medium-term uptrend structure.
Key levels to monitor include the immediate resistance at $3,400 and the previous support-turned-resistance at $3,330. A decisive break above $3,400 would likely trigger renewed bullish momentum toward the $3,440-$3,465 zone, while failure to sustain above $3,330 could see another test of the June low support. The strong rebound from critical support levels suggests that the broader bullish bias remains intact, with this correction potentially setting up for the next leg higher.
If this idea resonates with you or you have your own opinion, traders, hit the comments. I’m excited to read your thoughts!

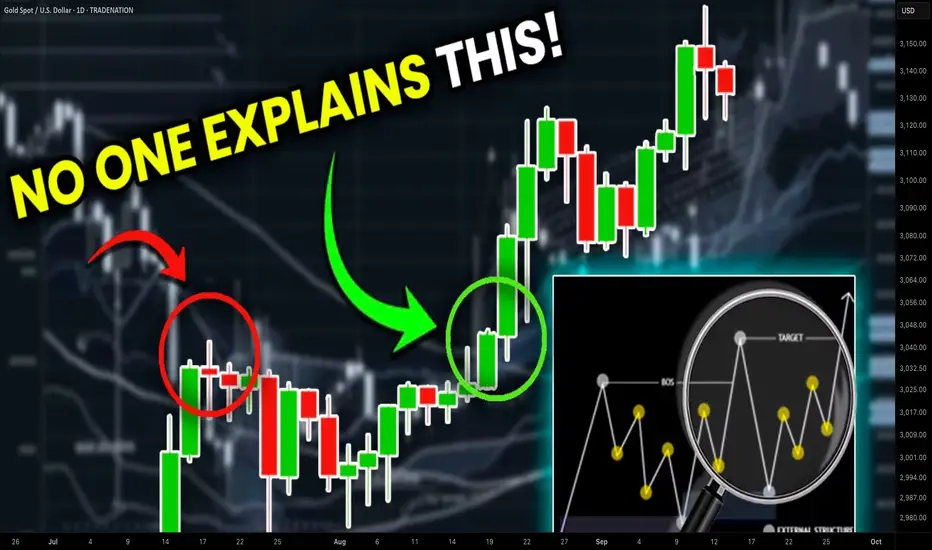
Accurate Price Model for Trading Smart Money Concepts SMC (=
If you trade Smart Money Concepts SMC, there is one single pattern that you should learn to identify.
In this article, you will learn an accurate price model that you can use to predict a strong bullish or bearish movement way before it happens.
Read carefully and discover how to track the silent actions of smart money on any market.
The only thing that you need to learn to easily find this pattern is basic Structure Mapping . After you map significant highs and lows, you will quickly recognize it.
This SMC pattern has 2 models: bullish and bearish ones.
Let's start with a bearish setup first.
Examine a structure of this pattern
it should be based on 2 important elements.
The price should set a sequence of equal lows.
These equal lows will compose a demand zone.
The area where a buying interest will concentrate.
The minimum number of equal lows and lowers highs should be 2 to make a model valid.
Exhausting of bullish moves will signify a loss of confidence in a demand zone . Less and less market participants will open buy positions from that.
At some moment, a demand zone will stop holding. Its bearish breakout will provide a strong bearish signal , and a bearish continuation will most likely follow.
This price model will signify a market manipulation by Smart Money.
They will not intentionally let the price fall, not letting it break a demand zone. A buying interest that will arise consequently will be used as a source of liquidity.
Smart money will grab liquidity of the buyers, silently accumulating huge volumes of selling orders.
Once they get enough of that, a bearish rally will start, with a demand zone breakout as a trigger.
Though, the chart model that I shared above has a strong bullish impulse, preceding its formation, remember that it is not mandatory.
The price may also form a bearish impulse first and for a pattern then.
Each bullish movement that initiates after a formation of an equal low should be weaker than a previous one.
So that the price should set a lower high every time after a formation of an equal low.
Look at a price action on USDCHF forex pair. Way before the price dropped, you could easily identify a market manipulation of Smart Money and selling orders accumulation.
A breakout of a horizontal demand zone was a final bearish confirmation signal.
Let's study its bullish model.
It has a similar structure.
The price should set a sequence of equal highs, respecting a horizontal supply zone.
Each bearish move that follows after its test should have a shorter length, forming a higher low with its completion.
This model will be also valid if it forms after a completion of a bearish impulse.
Weakening bearish movements will signify a loss of confidence in a supply zone, with fewer and fewer market participants selling that.
Its bullish breakout will be an important even that will confirm a highly probable strong bullish continuation.
Smart Money will use this price model to manipulate the market and accumulate buying orders, not letting the price go through a supply zone. They will grab a liquidity of the sellers each time a bearish move follows from a supply zone.
When they finally get enough of a liquidity, a bullish rally will initiate and a supply zone will be broken , providing a strong confirmation signal.
That price model was spotted on GBPJPY forex pair.
Smart Money were manipulating the market, not letting it continue rallying by creating a significant horizontal supply zone.
Selling orders that were executed after its tests provided a liquidity for them.
A bullish breakout of the underlined zone provides a strong bullish confirmation signal.
A breakout and a future rise could be easily predicted once this price model appeared.
Why they do it?
But why do Smart Money manipulate the markets that way?
The answer is simple: in comparison to retail traders, they trade with huge trading orders . To hide their presence and to not impact market prices much, they split their positions into a set of tiny orders that they execute, grabbing the liquidity.
The price model that we discussed today is the example how they do it.
The important thing to note about this pattern is that it efficiently works on any market and any time frame. You can use that for scalping, day trading, swing trading. And it can help you find great investing opportunities.
❤️Please, support my work with like, thank you!❤️
I am part of Trade Nation's Influencer program and receive a monthly fee for using their TradingView charts in my analysis.
Gold 30Min Engaged ( Buy & Sell Reversal Entry Detected )Time Frame: 30-Minute Warfare
Entry Protocol: Only after volume-verified breakout
🩸Bearish Reversal - 3304
🩸Bullish Reversal - 3275
➗ Hanzo Protocol: Volume-Tiered Entry Authority
➕ Zone Activated: Dynamic market pressure detected.
The level isn’t just price — it’s a memory of where they moved size.
Volume is rising beneath the surface — not noise, but preparation.
🔥 Tactical Note:
We wait for the energy signature — when volume betrays intention.
The trap gets set. The weak follow. We execute.
Gold Price Drops After Rally – What’s Next?Hello everyone, let's take a closer look at today's gold price
Gold has unexpectedly dropped significantly today after a notable rise early last Friday. The market's initial concerns stemmed from rumors that the U.S. would impose an import tax on gold, which caused some panic. However, after the White House officially clarified its position and assured the market, the initial worries eased
From a technical perspective, gold has broken through the upward trendline and is moving swiftly. According to Dow Theory, a short-term correction might occur soon, but if the price remains below key resistance levels, the decline could extend toward the Fibonacci 1.272 region, or even down to the Fibonacci 1.618 level if the downtrend persists.
Do you agree with this outlook? Share your thoughts in the comments below.
Good luck and happy trading!

GOLD Potential Bullish Fallowing the PullbackGold is currently forming a trading range, with recent price action indicating a test of support, which may mark the end of the recent pullback. Yesterday, gold retraced toward the 3391 level, showing signs of short-term recovery.
Key Market Focus
The market is closely watching developments around the Federal Reserve appointment, including the potential replacement of Chair Powell. Trade-related comments from Donald Trump are also creating uncertainty. These geopolitical and macroeconomic factors may trigger a new correction or volatility phase in gold.
Resistance: 3400 / 3425
Support: 3355 / 3350
Price action confirmed a false breakout to the downside, with strong buying interest near the 3350–3355 support zone. If the price holds above this support, it strengthens the case for a bullish continuation. A break and close above 3400 could pave the way toward 3425 and potentially higher Growth.
You may find more details in the chart.
Trade wisely Best of Luck Buddies.
Ps: Support with like and comments for better analysis Thanks

XAUUSD-symmetrical triangle patternsymmetrical triangle pattern of XAUUSD. It is consolidating in narrow area within Trangle.
XAUUSD TRADE SETUPWait for retest the entry level and bullish momentum candle then take a trade for Buy otherwise skip this setup

Gold next move (Read Description). Hello, Traders.
As you see gold has changed its direction after the NFP News. It was in down trend after the NFP News its flying to the my moon.
Gold is just flying and making breakouts of resistance areas. In my view gold wants to fly and it wants to hit buy side liquidity and then we can see the waterfall.
Gold can continue the trend and if price pullbacks it can touch the area 3365 - 3353 and then can fly.
Don’t trade against the trend, analyse the market before opening the trades.

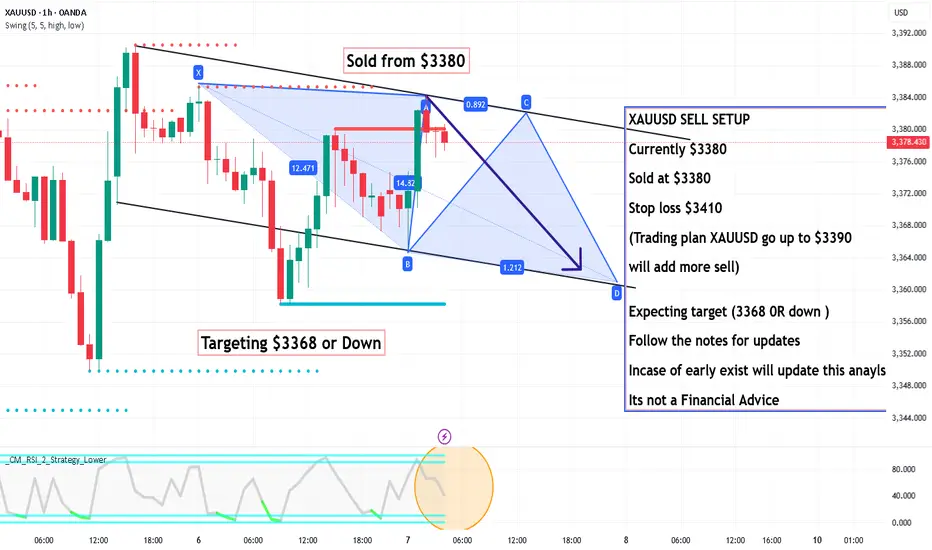
XAUUSD SELL SETUP ,Sold at $3380XAUUSD SELL SETUP
Currently $3380
Sold at $3380
Stop loss $3410
(Trading plan XAUUSD go up to $3390
will add more sell)
Expecting target (3368 0R down )
Follow the notes for updates
Incase of early exist will update this anaylsis
Its not a Financial Advice
Gold price drops, selling pressure and CPI news⭐️GOLDEN INFORMATION:
Gold (XAU/USD) found some buying interest in the Asian session, rebounding from Monday’s steep drop to the $3,341 level — its lowest in over a week. The U.S. Dollar struggled to build on its two-day advance as traders stepped to the sidelines ahead of the release of the latest U.S. consumer inflation data later today.
The Consumer Price Index (CPI) report will be pivotal in shaping expectations for the Federal Reserve’s rate-cut trajectory, which will, in turn, influence the Greenback’s direction and could provide fresh momentum for the non-yielding yellow metal.
⭐️Personal comments NOVA:
CPI expected to increase, DXY increases, selling pressure on gold. Market recovers briefly before US trading session
⭐️SET UP GOLD PRICE:
🔥SELL GOLD zone: 3379- 3381 SL 3386
TP1: $3367
TP2: $3355
TP3: $3342
🔥BUY GOLD zone: $3320-$3318 SL $3313
TP1: $3332
TP2: $3344
TP3: $3356
⭐️Technical analysis:
Based on technical indicators EMA 34, EMA89 and support resistance areas to set up a reasonable BUY order.
⭐️NOTE:
Note: Nova wishes traders to manage their capital well
- take the number of lots that match your capital
- Takeprofit equal to 4-6% of capital account
- Stoplose equal to 2-3% of capital account

XAUUSD GOLD Buy Trade
Buy trade condiational buying on Restest and confirmation of bullish candle
Chart shows SL TP Entry point
Partial booking is suggested risk free trade as soon possible ap per risk reward

Gold’s Drop: The Calm Before the SurgeThe bulls have been defeated all the way, and the current lowest has fallen to around 3350. However, after gold touched around 3350, the downward momentum has slowed down. I think it is not appropriate to be overly bearish on gold in the short term.
It can be clearly seen during the day that gold started to fall from around 3401, and the decline reached $51 around 3350. In the absence of any major negative news, I believe that the intraday retracement space has reached its upper limit, and the structural support line for gold bulls happens to be in the 3350-3340 area, so the room for gold to continue to retrace will not be too large.
Moreover, gold has recently fallen under pressure several times after standing above 3340, proving that the upper resistance still exists. In addition, there is a certain amount of selling, which has hindered the bullish momentum to a certain extent, resulting in the lack of momentum for gold bulls. After the current pullback and technical repair, due to the increase in gold liquidity and accumulation of strength, it may be more conducive for gold to hit 3400 again or even higher targets.
Therefore, in the short term, I think it is not advisable to chase gold too much; instead, we can accumulate enough cheap chips during the gold pullback, and then wait patiently for gold to rebound and hit 3380-3390 again.
