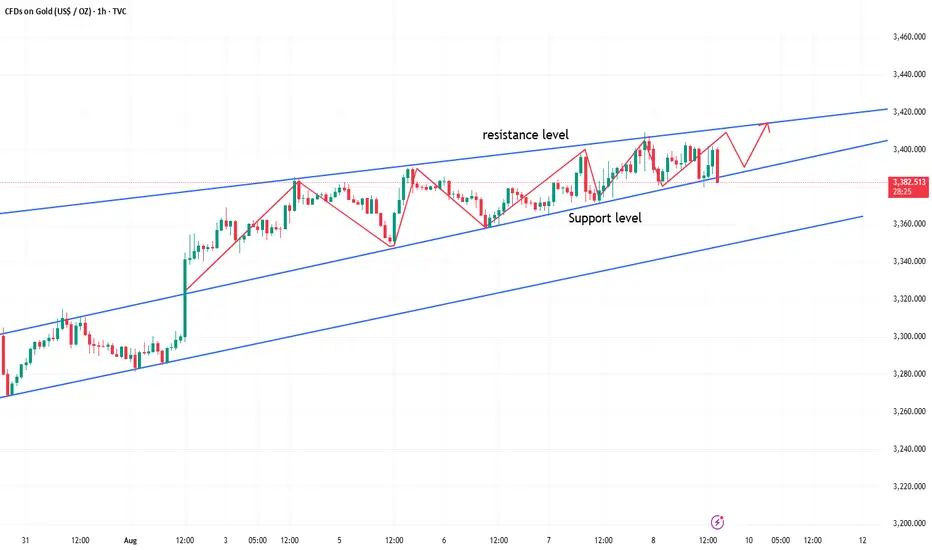
Gold targets 3430 - Bulls in controlHello IGT FOLLOWERS
Here is my Gold overview, From last couple of days gold is respecting the trend line very well in the upwards, Gold is now working on a trend line's support area around 3382/3376. Indicating strong bullish momentum. A break of 3410 could confirm further upside till 3430..
Key points :
Entry point : 3381
Support Area : 3382/3376
Follow me for more latest updates and signals
XAUUSD trade ideas

Intraday Gold Price Analysis – Key Levels and Strategy1. Technical Overview – Gold OANDA:XAUUSD on 1H Timeframe
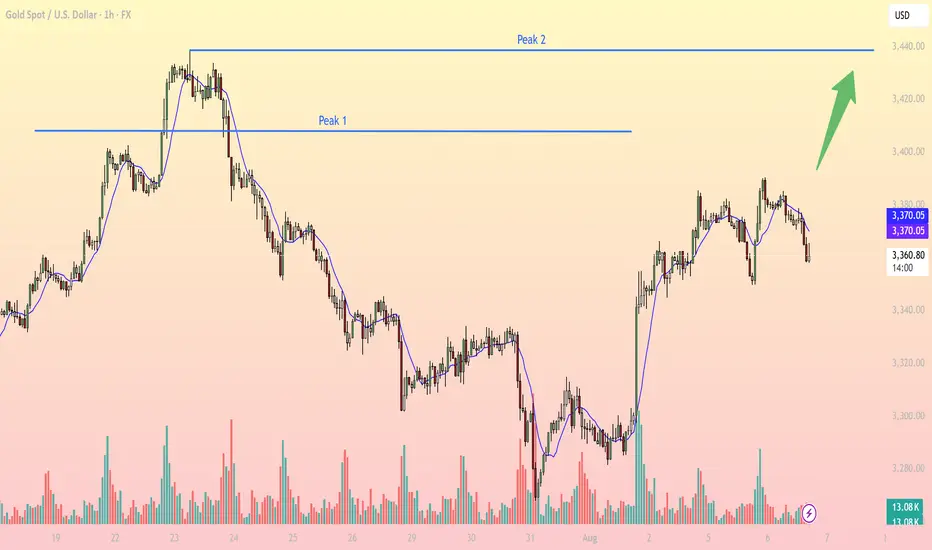
At the time of writing, gold is trading around 3,361 USD, continuing to range just below the key resistance zones after a short-term bullish recovery. Price structure is forming a potential higher low, but a clear breakout above resistance is still pending for trend confirmation.
2. Key Levels to Watch
Support 1: 3,335 – 3,340 - Near EMA10 + previous demand zone, potential bounce area
Resistance 1 (Peak 1): 3,375 – 3,380 - Previous local top, acted as rejection zone recently
Resistance 2 (Peak 2): 3,435 – 3,440 - Major breakout target from previous double top pattern
3. Indicators Analysis
EMA10 (blue line): Currently serving as dynamic intraday resistance. Price is oscillating around it, showing consolidation.
Volume Profile: Rising on bullish candles – indicates accumulation pressure, though not yet confirmed by breakout.
RSI (not shown): Likely hovering near 50 – neutral bias, awaiting directional trigger.
4. Price Behavior and Structure
Market has recovered from end-of-July selloff, creating a local bottom near 3,280.
Forming a potential cup-and-handle pattern targeting break of 3,375, with bullish continuation targeting 3,440.
Sideways movement on lower volume suggests accumulation phase before breakout.
5. Trading Strategy Suggestion (Intraday)
- Bullish Scenario:
Entry: Buy on confirmed breakout above 3,375 (Peak 1) with strong candle + volume.
SL: Below 3,360.
TP1: 3,400
TP2: 3,440 (Peak 2 – measured move from breakout)
- Reversal Scenario:
Sell on rejection from 3,375 if price forms double top or bearish engulfing candle.
SL: Above 3,380.
TP1: 3,345
TP2: 3,330
- Neutral Bias:
Wait for price to retest EMA10 and demand zone near 3,340 before entering long, especially if RSI and volume show divergence.
6. Final Notes
Price action is coiling below major resistance, hinting at a potential explosive move. Patience and level-based execution are key today. Scalpers can utilize 15m confirmation inside key zones for tighter entries.
GOLD CAN FALLING SOONAccording to M15 analysis gold market in flying pressure from last day now market maybe go down from RESISTANCE ZONE if you want then go sell from RESISTANCE ZONE is best for you Dont be greedy use money management
TRADE AT YOUR OWN RISK
REGARD ALBERT

DeGRAM | GOLD reached the resistance level📊 Technical Analysis
● XAUUSD rebounded from the lower channel boundary near 3,294 and reclaimed resistance at 3,357.8, confirming bullish continuation inside the rising structure.
● Breakout above the triangle’s descending resistance line opens upside toward 3,435 and possibly 3,487 on strong momentum continuation.
💡 Fundamental Analysis
● Gold found renewed support as US NFP and ISM data showed softness, weakening the dollar and lowering real yields.
● Rising geopolitical risk and increased central bank gold buying in July continue to support bullish sentiment.
✨ Summary
Long above 3,357. Target 3,435 ➜ 3,487. Setup holds while price stays above 3,294 channel base.
-------------------
Share your opinion in the comments and support the idea with a like. Thanks for your support!

XAUUSD LongElite Analysis
Executed in lower time frames.
I did catch the first initial violent move, close majority of the volume.
Executed second entry (More discretionary based - Not pictured)
Targeting upper liquidity pools.

Buying Trade SetupHello every one, this is Sonara FX. Possible bullish move expected. wait for rejection candle and wait for price reaction. Let's see how it will work.

Gold Regained Bullish MomentumGold Technical Update:
Gold is currently exhibiting a bullish market structure, forming a bullish flag pattern on both the 4H and Daily timeframes, alongside an ascending triangle formation. Once this pattern completes, a breakout above the 3390 resistance is likely, potentially pushing the price toward the 3400–3430 zone.
Price remains above the Ichimoku Cloud, which indicates continued bullish momentum and provides a strong support zone around 3345–3352, reinforced by moving averages and structural support levels.
Today, the price has made a higher low at 3358, compared to the previous day’s low, suggesting strength in the current uptrend. A break above the psychological level of 3400 is anticipated, which could trigger bullish continuation toward 3430.
In light of the current technical setup, I maintain a bullish outlook, expecting the trend to continue. However, this view will be reassessed if price breaks below the daily lows of Tuesday and Wednesday, and closes below the 50-day moving average.
Good luck and trade safe!

Gold Spot / U.S. Dollar (XAUUSD) 4-Hour Chart - OANDA4-hour price movement of Gold Spot (XAUUSD) against the U.S. Dollar, sourced from OANDA. The current price is $3,349.050, reflecting a decrease of $48.715 (-1.43%) as of 01:11:40. Key levels include a sell price of $3,348.830 and a buy price of $3,349.380, with a highlighted support zone around $3,348.849 and a resistance zone near $3,370.815. The chart covers the period from early August to mid-September 2025.

XAU/USD Bullish Setup Building MomentumGold has reclaimed bullish momentum after a strong bounce from the recent demand zone around 3319–3322. The chart shows a clear Change of Character (CHOCH) and subsequent Break of Structure (BOS), suggesting buyers are regaining control. Price is now trading above the Ichimoku cloud, further confirming bullish pressure. The upward arrow highlights the potential path toward the next key resistance area near 3380–3400. As long as price sustains above the previous structural break and the cloud base, continuation toward the upside remains likely. Market structure favours buying opportunities on dips, with bulls targeting a higher move in the short term.
Entry Buy: 3334
Target Point: 3404
If you found this analysis helpful, don’t forget to drop a like and comment . Your support keeps quality ideas flowing—let’s grow and win together! 💪

XAUUSD: Market Analysis and Strategy for August 6th.Gold Technical Analysis:
Daily Chart Resistance: 3430, Support: 3300
4-Hour Chart Resistance: 3400, Support: 3334
1-Hour Chart Resistance: 3390, Support: 3350.
Gold bottomed out and rebounded yesterday. After hitting 3350, the price quickly rebounded to 3390, then traded sideways. Keep an eye on the bullish trend and buy on dips. Wait for a breakout above 3390.
After reaching 3390 yesterday, the price fluctuated downward today, currently trading near 3365. A short-term pullback does not signal a change in the trend; it remains bullish. Yesterday's low of 3350 forms the bull-bear divide. If gold prices remain above this level, the bullish trend remains. Pullbacks are buying opportunities. Any stop-loss around the 3350 support level is a good time to buy. During the uptrend, there's no need to speculate on the top; for now, focus on 3390. A breakout above 3390 could target 3400-3415 for bulls.
For the NY market plan, you can buy when it stabilizes in the 3350-3356 area. The SL plan is set at 3345, and the rising target is 3385-3400.

XAUUSDSince we are bullish on XAUUSD, Price made a new high and now back on the discount of the 1hr range. I expect up down candle to send price to the buy side.

"Gold’s Next Big Move? The Hidden Entry Zone Smart Money "Gold’s Next Big Move? The Hidden Entry Zone Smart Money is Watching!"
Gold (XAUUSD) is currently consolidating after a series of higher lows, signaling sustained bullish momentum from the strong support region around $3,280–$3,300. Price has respected key structural points, forming a clean market structure with:
BOS (Break of Structure) confirming bullish intent after reclaiming prior resistance.
Bullish FVG (Fair Value Gap) acting as a liquidity zone for potential re-entries.
Multiple Higher Lows, highlighting strong buyer defense levels.
The chart indicates a possible short-term retracement into the $3,350–$3,357 entry zone, which aligns with demand structure. From this zone, buyers are expected to push toward the $3,400–$3,415 resistance target.
Key technical levels:
Entry Zone: $3,350–$3,357 (demand area)
Stop Loss: Below $3,340 to protect against deeper pullbacks
Take Profit: $3,400 psychological level and $3,414 structural resistance
Market Sentiment:
The combination of a strong support base, sustained higher lows, and bullish imbalance zones suggests a favorable risk–reward setup for long positions. A clean breakout above $3,415 could trigger a larger bullish leg toward the $3,440 resistance zone.
📈 Bias: Bullish above $3,350
💡 Watch for a reaction at the entry zone before committing to positions.

XAUUSD Rejection Signals Potential DownsideOANDA:XAUUSD is showing rejection from a clear resistance zone within the upper range of its volatility bands, with price action hinting at a potential move lower. This short setup is supported by visible bearish confluences.
✅ Bearish Confluences:
Fibonacci Resistance: Price turned lower after testing the 38.2% retracement level near $3,372.
Lower High Formation: Recent swing high is below the previous peak, maintaining a short-term bearish structure.
Volatility Band Rejection: Strong rejection from the mid-to-upper band area, signaling weakening bullish momentum.
🎯 Fibonacci-Based Targets:
TP1 – $3,332 (38.2%): First reaction area and initial support.
TP2 – $3,274 (61.8%): Key downside target within the retracement zone.
TP3 – $3,214 (100%): Full measured move to the lower band.
SL: Placed just above $3,390 to protect against a break of the bearish setup.

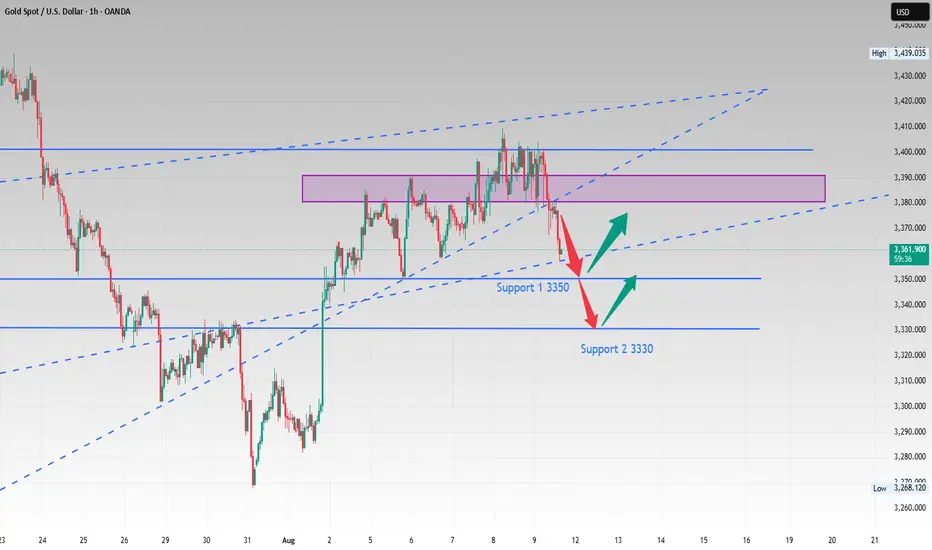
Gold trapped between 3,400.00 and 3,380 zoneAfter bouncing from 3,268.42 zone, Gold have been showing strong bullish momentum until it found itself between resistance zone 3,400.00 and support zone 3,380.00.
Zones to watch:
Support zones:3,800.00⬇️, 3,500.00⬇️
Resistance Zone:3,400.00⬆️, 3,430.00⬆️
🔎BIAS:
🔼Bullish: Break and hold above 3,400.00 could extend gains towards 3,430.00
🔽Bearish: Break below 3,380.00 may lead to 3,350.00 and even deeper pullback towards 3,330.00.
📛 Disclaimer: This is not financial advice. Trade at your own risk.

Wait for a pullback and then test the previous high#XAUUSD
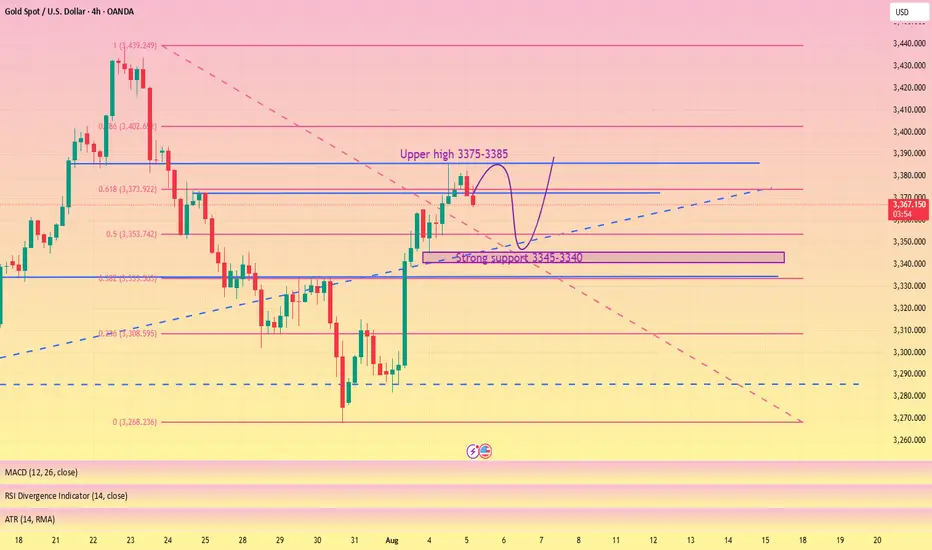
The gold market closed positively on the daily chart, with strong support near 3345-3340 below. The market trend is still dominated by bulls,🐂 but the daily moving average support is too far from the high point. It is not ruled out that it may retreat to the moving average support near 3345-3340,📊 and then rise again.🚀
From the monthly chart, 🌙although the monthly chart closed positive, the market is generally converging at a high level. Upper resistance remains, and a breakout is unlikely without breaking through this resistance level (no further discussion will be given).📉
Judging from the weekly chart, the Bollinger Bands have shrunk, and the MACD indicator has formed a death cross with large volume, indicating weak fluctuations at the weekly level.😩
Judging from the daily chart, 📊the current technical indicators are tending to the zero axis, and the rapid upward correction of the smart indicator indicates that the price fluctuation tends to rebound. The current focus is on yesterday's high around 3385. It is expected to break through 3430. The lower support Bollinger band middle track and moving average tend to stick together around 3346-3340.🌈
Judging from the hourly chart and 4H chart, 📊the overall rhythm tends to fluctuate and fall. The short-term pressure from above is around 3375-3385, and a break above will definitely lead to an increase.📈
On the whole, pay attention to yesterday's NY starting point near 3365-3360, and the strong support below is 3346-3340. The hourly and 4H charts tend to fluctuate and fall, so for short-term trading we need to short on rallies. 📉
Intraday trading suggestions are as follows:
1. Consider going long currently around 3365-3360📈, targeting 3374-3380🎯. If it breaks through, look for 3400.
2. Go long if it retraces below 3355-3340, targeting 3375-3385. Wait for further adjustments.🐂
3. If the price first reaches the resistance level of 3375-3385 and holds, consider going short with a small position and anticipate a pullback towards 3365-3355.🐻
Time for Short on GoldMassive Win since last 2 weeks on buy . Now time take a fall . Look for sell from 3380-88 .

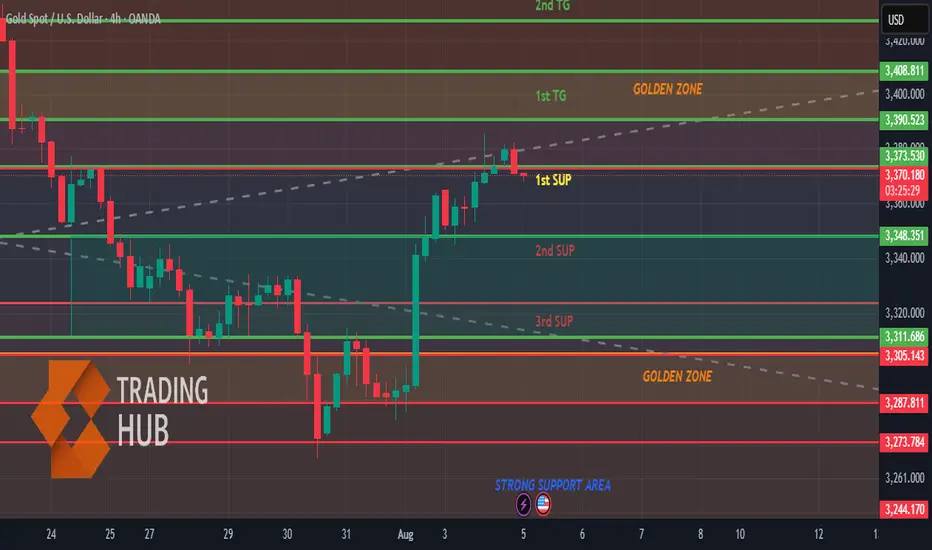
Gold (XAU/USD) - Bullish Breakout Opportunity Above Golden ZoneGold (XAU/USD) has recently shown strong bullish momentum, moving upward from a "Strong Support Area" and a lower "Golden Zone." The price is currently consolidating just below a significant resistance area, the 1st TG (Target), which is also labeled as a "Golden Zone." This presents a potential high-probability setup.
My analysis suggests that the current consolidation is a period of accumulation before the next leg of the uptrend. The key to a successful trade here will be a confirmed breakout above the 1st TG. This would indicate that buyers have absorbed the selling pressure at this resistance and are ready to push the price higher.
Bullish Scenario: The primary scenario I'm watching is a breakout above the 1st TG and its corresponding "Golden Zone" resistance. A clear 4-hour candle closing above this area would be a strong bullish signal.
Bearish Scenario: A failure to break the resistance, followed by a sharp move back down below the current consolidation level (1st SUP), would invalidate the bullish thesis and suggest a potential deeper retracement.
Trading Plan:
Long Entry: Enter a long position on a confirmed breakout and close above the 1st TG (Golden Zone) resistance level.
Profit Target 1: The 2nd TG level, which sits at the top of the chart.
Stop Loss: A stop loss should be placed below the 1st SUP level to protect against a false breakout or a reversal.
Gold Maintains Bullish Momentum – Eyes $3,400📊 Market Summary:
Gold surged past the $3,385 resistance to reach a new high at $3,390, driven by weaker-than-expected ISM Services PMI data. The U.S. dollar softened and Treasury yields dipped, fueling the rally. However, after hitting the peak, some profit-taking emerged, causing gold to pull back slightly and currently trade around $3,383.
________________________________________
📉 Technical Analysis:
• Key Resistance:
$3,390–$3,395 – short-term local high. If this zone breaks, the next target is $3,400+.
• Nearest Support:
$3,380, followed by the previous breakout level at $3,365, both likely to act as support during any pullback.
• EMA 09 (Daily):
Price remains above the 9-day EMA, confirming the continuation of the short-term uptrend.
• Momentum / Volume / Candlestick:
RSI is holding above 60 – bullish. However, a long upper wick near $3,390 suggests short-term selling pressure or hesitation.
________________________________________
📌 Outlook:
Gold is showing bullish momentum, with the uptrend confirmed after breaking above $3,385. If price holds above $3,380, there's a strong possibility of testing the $3,400 level. However, a failure to sustain above this zone could lead to a retest of $3,365.
________________________________________
💡 Suggested Trade Strategy:
🔺 BUY XAU/USD : $3,380–$3,383
🎯 TP: 40/80/200 pips
❌ SL: $3,377

Wait patiently, 3350 is the key, if it falls below, look at 3330Gold experienced frequent fluctuations last Friday night. After opening today at around 3,400, it quickly fell back. Gold has already fallen below last Friday's low. 🐻
It is expected to retrace to test the support level of 3357-3350 today📈. If the support level is not broken, the bulls may rebound at any time.🐂
If it unexpectedly falls below, it may accelerate its decline to around 3330📉, where there is also support, and you can go long in the short term when it approaches📊.
On the whole, the main strategy during the day is to go long based on support and callback. If it touches 3357-3350 for the first time, you can consider going long with a light position.✅
GOLD: Bullish Continuation & Long Trade
GOLD
- Classic bullish setup
- Our team expects bullish continuation
SUGGESTED TRADE:
Swing Trade
Long GOLD
Entry Point - 3360.0
Stop Loss - 3353.1
Take Profit - 3373.4
Our Risk - 1%
Start protection of your profits from lower levels
Disclosure: I am part of Trade Nation's Influencer program and receive a monthly fee for using their TradingView charts in my analysis.
❤️ Please, support our work with like & comment! ❤️

Gold once again fell into range consolidation, how to operate inToday, Friday, gold finally closed above 3380 after Thursday's close. It initially surged to a high near 3408 on Friday's opening.
Gold is currently consolidating above 3380.
Over the past two days, gold has largely fluctuated between 3360 and 3360. After closing above 3380 yesterday, the current range has shifted to 3380-3400.
The hourly chart also shows the current range between 3380 and 3400.
Of course, 3380 is currently a significant support level.
If it falls below 3380 again, the range could fall back to 3380-60.
On the other hand, the current resistance above is around 3400 points.
If it stabilizes above 3400 (based on today's high, a new high would essentially indicate stability), the subsequent range would become 3400-3450.
This means that after stabilizing at 3400, there's a possibility of continued higher highs.
Of course, gold is currently trading between 3380 and 3400, depending on where it breaks in the US market.
Whichever way the breakout occurs, follow the trend.
Another possibility is that it could continue to consolidate between 3389 and 3400.
If this is the case, then you can simply buy low and sell high within the range.
XAUUSD Bearish OutlookXAUUSD seems bearish at the H3 timeframe, hovering above the support line of the VWAP line below its blue centre-line. A drop below 3339.875 could lead to sellers reaching price targets of 3242.758 and 3208.965.
If bulls gain strength and break the 3458.765 level, then the setup will be invalid.
To pips and lots, happy trading,
K.
Not trading advice

Gold trading rhythm is perfectly matchedIn the previous strategy, we recommended maintaining a high-selling and buying-low strategy for gold. We accurately predicted the high point near 3397 and arranged short positions near 3395. It then fell steadily to around 3371. Judging from the current gold trend, gold rose and then fell in the European session, touching around 3397, which is exactly the pressure level of the upward channel trend line. The Bollinger Bands in the 4H cycle closed, and the indicators temporarily showed signs of differentiation, but the overall market was resistant to declines at high levels. The current short-term support is around 3375-3370. If it does not break the short-term, it will still be volatile. If it falls below, the strong support of 3360 will be seen. The upper pressure levels are 3385, 3398-3400. In terms of operation, we still maintain a high-altitude, low-multiple short-term strategy. I will give the specific operation ideas at the bottom, remember to pay attention in time!
