ACCORDING TO DXYAccording to dxy Gold maybe will move 500 to 700 pips on Monday. So if you want to sell 1st session if 1H close below 3395 than make sell and last tp 3378 and wait for buy signal.
XAUUSD trade ideas

Gold market outlook on the H4 chart. Possible BUYWeekly storyline bullish
Daily storyline bullish
H4 storyline bearish
Two POV observations
Sell side: Price reacted from a daily obstacle ( DSs ) but still has a long way to break its confirmation swing on the H4 ( ? ). We hope to see H4 storyline change to bullish around the swing low area without breaking it ( ? )
Buy side: price rejects from a daily SnR level ( DBs ) and breaks its confirmation swing on the H4 ( + ) so we hope to join price on the 60% discount level.
Nb: Even though we’re still bullish on the weekly and daily, price refused to break PDC on the H4 chart right after a daily obstacle touch. Could be messy. Stay safe and always afford your risk

XAUUSD BUYProbably buy gold if it not go under the triangle. Im waiting for a breakout. What do you think?
Give me some feedback and what do you think about gold. I have trading about 3 months, so im a Newbie🧐💰

Gold Technical Analysis - Bearish Bias Below $3,384Gold is currently trading near $3,373 within an ascending channel but showing signs of weakness. A rejection near the $3,384–$3,390 resistance zone could trigger a downside move toward key supports at $3,350, $3,338, and $3,326. If price breaks below the channel midline, bearish momentum may strengthen. However, a bounce from support could push gold back toward the upper range. Keep an eye on breakout zones for the next move.
🔑 Key Levels to Watch
- Resistance: $3,384 → $3,390: Strong resistance zone
- Support: $3,350 → $3,338 → $3,326
- Breakout Zones: Below $3,338: Opens room to $3,310 and below. Above $3,390: May lead to fresh highs toward $3,410+
🧭 Trend Outlook
- Short-Term: Bearish bias within the ascending channel, especially if price breaks below mid-channel.
- Medium-Term: Neutral to bullish as long as the lower channel trendline holds.
- Momentum: Losing bullish momentum; potential for downside correction.
Price is at a decision point within the ascending channel. A clean break below the mid-channel and $3,365 area can accelerate downside correction. Stay alert to key support zones and any reversal signals.
Note
Please risk management in trading is a Key so use your money accordingly. If you like the idea then please like and boost. Thank you and Good Luck!

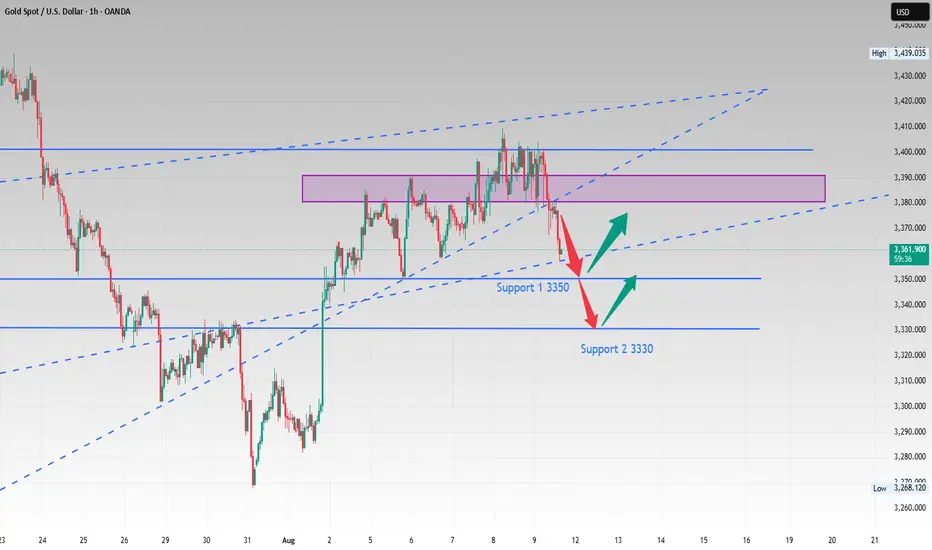
Wait patiently, 3350 is the key, if it falls below, look at 3330Gold experienced frequent fluctuations last Friday night. After opening today at around 3,400, it quickly fell back. Gold has already fallen below last Friday's low. 🐻
It is expected to retrace to test the support level of 3357-3350 today📈. If the support level is not broken, the bulls may rebound at any time.🐂
If it unexpectedly falls below, it may accelerate its decline to around 3330📉, where there is also support, and you can go long in the short term when it approaches📊.
On the whole, the main strategy during the day is to go long based on support and callback. If it touches 3357-3350 for the first time, you can consider going long with a light position.✅
XAUUSD swing readyH1-H4 TIMEFRAME SETUP
Currently XAUUSD is following the implusive down Trend as we mentioned once 3370 breaks 3345 is on mark I expecting market will renounce from 3335-3342 zone.
What possible scenarios we have ?
• Market has to gives closing of H4 above 3335-3340 for the implusive bounce for HH on D1 & H4 candles ,also I'm ready for buying at & my Targets are 3358 then 3370
• secondly If gold breaks to 3332-3330 and candle closes below then our buying will be invalid and market will retest 3310
#XAUUSD

1 hrs BPRClear Buying area is near BPR
Look in the 1 hr BPR area, once it is tapped make to check for confirmation in small time frame for entry
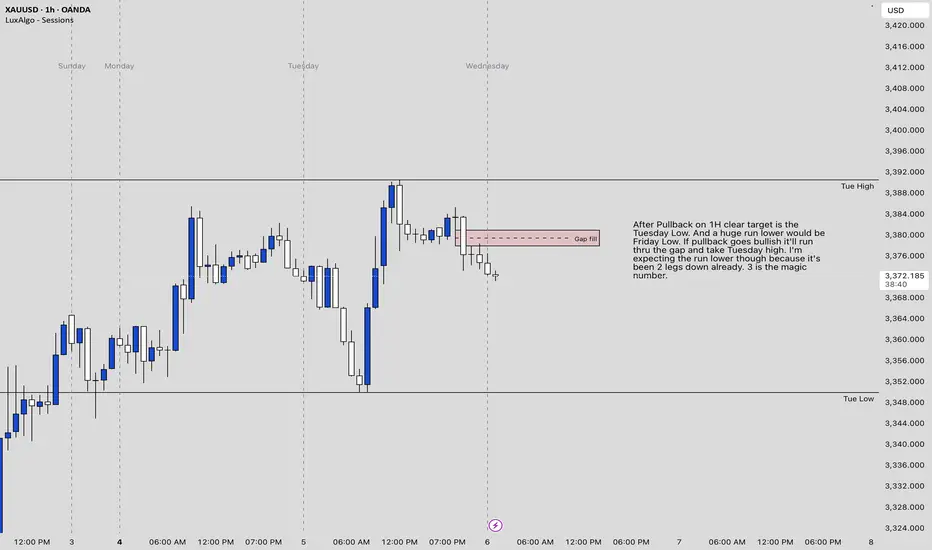
Gold Analysis - Possible big move inboundI left it all on the chart. But it appears gold is prepping for the third leg down after a massive move up. It could take a few days but it's free range all the way to Friday's low. It could be invalidated if the pullback is strong enough. But the gap was filled and its been 2 consecutive pushes downwards. A huge drop seems imminent from my perspective.
One final squeeze and XAUUSD could explode from supportXAUUSD is currently trading in a tight consolidation range at support, indicating signs of increasing tension. After a sharp decline, the price has been moving sideways in a narrowing structure. The consolidation around this low, the contraction of sellers and buyers in a low volatility squeeze, could be a signal we can use. This type of price action often signals that sellers are getting exhausted, prompting buyers to enter the market.
The lack of deep retracements combined with increasingly shallow sell-offs suggests that bearish momentum is weakening. This often happens during the consolidation phase before a breakout. If buyers can push the price above with a strong close, this could trigger a breakout and lead to a continuation of the uptrend.
Ideally, if the price reacts positively and forms a bullish confirmation, it will set up a solid continuation entry point, with upside potential towards the next target of $3,370.
Until then, buyers are closely watching for signs of commitment. However, the breakout has not been confirmed yet, but the squeeze has occurred and pressure is building.
I am just sharing my thoughts on the chart, this is not financial advice. Always confirm your setup and manage your risk appropriately.

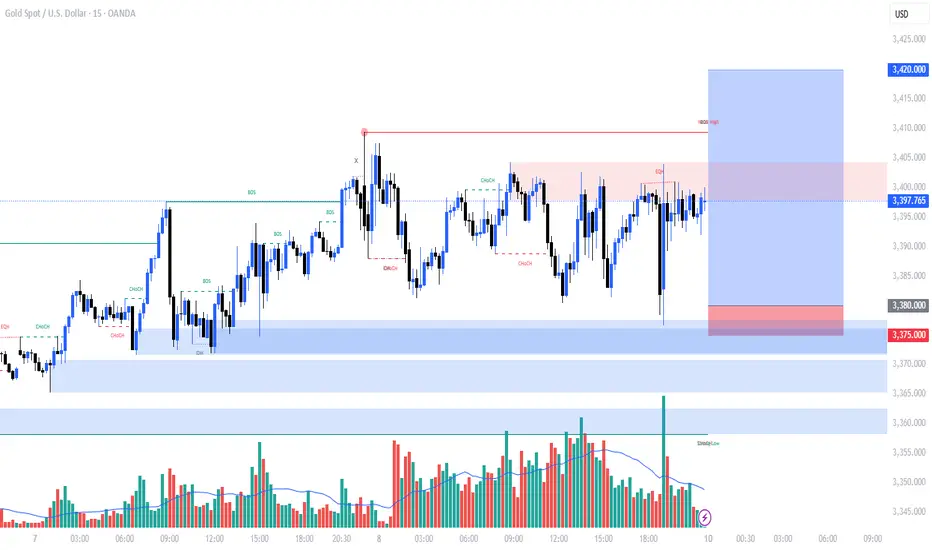
MY ANALYSIS ON XAUUSDLet's go through a top-down analysis for XAUUSD using the charts you've provided, starting from the 4-hour timeframe down to the 15-minute timeframe. I'll highlight key levels and POIs (order blocks, breaker blocks, and FVG) for possible trade setups.
1. 4-Hour Timeframe (Overall Market Structure)
* Market Structure: From the 4-hour chart, the market is in a bullish structure as it is making higher highs and higher lows.
* Key POI (Order Block / Breaker Block): There is a recent order block formed around 3,360.000, where the market pushed strongly upwards after a consolidation phase. This could be an area of interest if price revisits this level.
* Liquidity Sweep / Inducement: A potential inducement occurred when price broke the 3,375.000 level earlier, sweeping liquidity before pushing higher. This move suggests price could look to continue its upward momentum after a retrace.
* FVG: There's a gap between 3,375.000 and 3,380.000, which might get filled on a retrace. If the market revisits this level, we could expect a continuation.
2. 1-Hour Timeframe (Refining POIs)
* Market Structure: The price action continues to reflect a bullish trend , with higher highs and higher lows. The structure on this timeframe aligns with the 4-hour view.
* Key POI (Order Block / Breaker Block): There's another order block formed near 3,385.000 – 3,390.000. This is where the market saw a sharp upward movement, indicating a potential support zone for a retracement.
* Liquidity Sweep / Inducement: On this timeframe, we observe a small sweep of liquidity around 3,375.000, where price broke a minor support before rallying. This suggests further potential upside if the market returns to this level.
* FVG: There’s a noticeable gap around 3,400.000 – 3,405.000. If price comes back down into this zone, it could fill the gap before continuing the upward trend.
3. 15-Minute Timeframe (Entry Setup)
* Market Structure: The price continues to be bullish with a series of higher highs and higher lows in recent price action. Price is currently consolidating near the recent highs.
* Key POI (Order Block / Breaker Block): There is an order block near 3,395.000 where a sharp move upwards occurred. This could act as a potential entry point if price revisits it.
* Liquidity Sweep / Inducement: There's a liquidity sweep around 3,380.000, where price broke below before pushing upwards. If price returns to this area, we could expect a potential bounce to the upside.
* FVG: A small FVG is visible near 3,395.000. If price fills this gap and finds support, a long position could be considered.
---
TRADE SETUP
Bias: Bullish (uptrend).
* Buy Setup:
* Entry: Look for a price retracement to the order block near 3,395.000 – 3,380.000 (15-minute timeframe).
* Stop Loss: Place a stop below the recent swing low (around 3,375.000) to minimize risk.
* Target: The next target is around 3,400.000 – 3,410.000 , with a secondary target at the recent high near 3,420.000 on the 4-hour timeframe.
This setup aligns with the overall bullish structure and key points of interest. If price comes back into these zones, watch for confirmation signals like rejection or reversal candlestick patterns to enter.
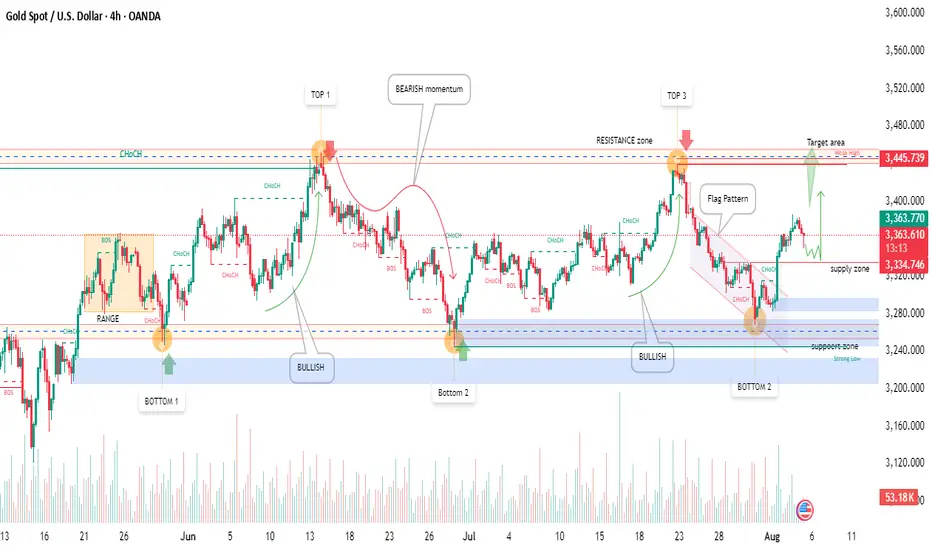
Gold(XAU/USD) 4H 5Aug2025 Price Analysis-Bullish Setup in Play!🧠 Technical Overview:
Gold has shown a solid bullish structure after rebounding from a strong support zone marked around the $3,250 area. We witnessed a textbook flag pattern breakout followed by a Change of Character (ChoCH) confirming bullish momentum.
🔹 Support Zones:
Strong demand near $3,250 – $3,280
Bullish reaction visible from Bottom 2
🔹 Resistance Zones:
Key supply zone at $3,334 – $3,356
Target area near the weekly high at $3,445
🏹 Trade Idea:
A bullish continuation is expected from the current zone after price retested the flag breakout.
🔸 Entry Zone: $3,334 – $3,356 (supply flip)
🔸 Target: $3,445 (Weekly High)
🔸 Stop Loss: Below $3,280 (support zone)
📊 Market Sentiment:
✅ Bullish momentum confirmed by multiple ChoCHs
✅ Strong buying volume at support
❗ Watch for price action confirmation at current supply zone
🏁 Summary:
Gold is currently respecting bullish structure with a clear path toward the $3,445 target. Traders can look for long opportunities after confirmation within the supply zone.
💬 What’s your outlook on Gold? Bullish or Bearish? Comment below!
continue to maintain gold purchase, 3400⭐️GOLDEN INFORMATION:
Gold prices edged higher on Monday, supported by growing expectations of a Federal Reserve rate cut following last Friday’s disappointing U.S. Nonfarm Payrolls report. XAU/USD is trading around $3,375, up 0.39% on the day.
Speculation over a potential policy shift has strengthened, with markets now pricing in an 87% chance of a rate cut at the Fed’s September 17 meeting — a boost for the non-yielding yellow metal.
Last week’s labor data revealed early signs of weakness in the job market. The U.S. Bureau of Labor Statistics (BLS) revised May and June payrolls down by a combined 258,000 jobs, reinforcing dovish remarks from Fed Governor Christopher Waller, who downplayed tariff-driven inflation and emphasized concerns about the Fed’s full employment mandate.
⭐️Personal comments NOVA:
Uptrend, gold price is maintaining stability. Heading towards 3400, before the expectation of interest rate cut is becoming more and more obvious.
⭐️SET UP GOLD PRICE:
🔥SELL GOLD zone: 3415- 3417 SL 3422
TP1: $3405
TP2: $3394
TP3: $3380
🔥BUY GOLD zone: $3311-$3313 SL $3306
TP1: $3325
TP2: $3338
TP3: $3350
⭐️Technical analysis:
Based on technical indicators EMA 34, EMA89 and support resistance areas to set up a reasonable BUY order.
⭐️NOTE:
Note: Nova wishes traders to manage their capital well
- take the number of lots that match your capital
- Takeprofit equal to 4-6% of capital account
- Stoplose equal to 2-3% of capital account

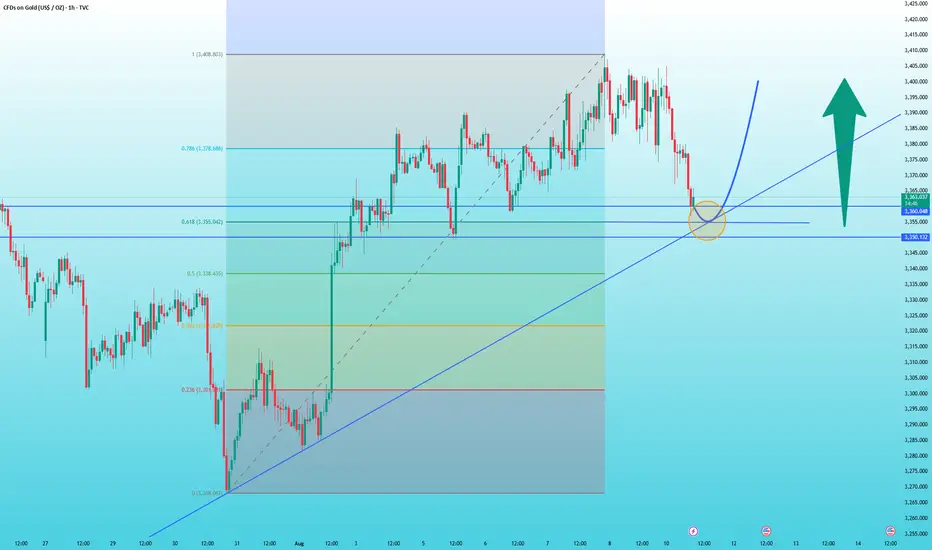
Gold ushers in a good buying opportunityAfter today's rapid pullback, the current price of gold has come near the key support level, which is the 3350-3360 range.
Based on the Fibonacci retracement indicator for the 3268-3408 uptrend, the 618 support level is located at 3355. Furthermore, the rising trendline also suggests downward support at 3350-3360.
Thus, I believe it's a good idea to enter a long position if the price retraces back to the 3350-3360 range.
Settings are as follows:
3350-3360 BUY
Take Profit Target 1: 3380
Take Profit Target 2: 3340
Stop Loss 0.5 Support: 3338
Personal opinion, for reference only
Gold on short term correction?Gold is likely to be on a short term correction, possibly in preparation for a bullish CPI. gold might actually head to 3400 after CPI release come next week.

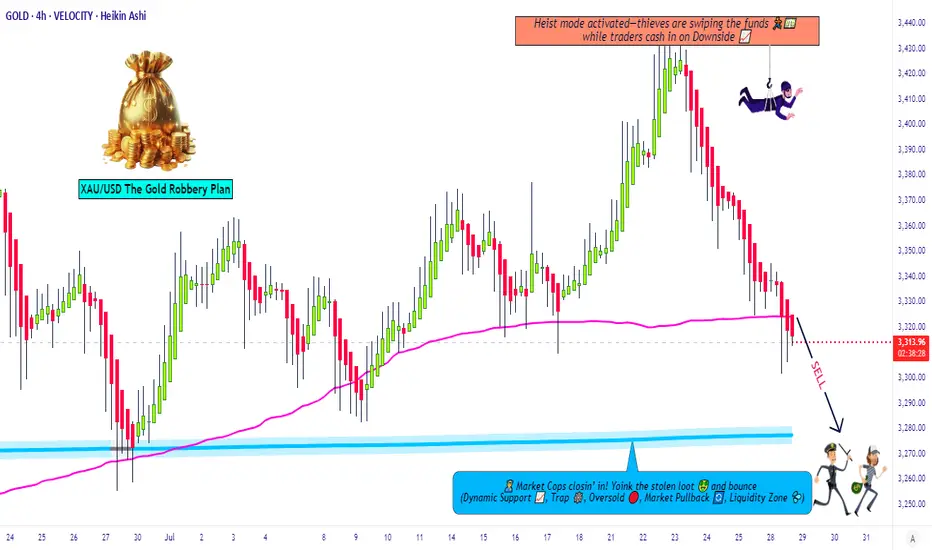
Gold Robbery Blueprint: Smart Bears on the Move Now!💣 XAU/USD GOLD HEIST PLAN: Robbery Begins at Resistance Zone! 🔐💰
🌟Hi! Hola! Ola! Bonjour! Hallo! Marhaba!🌟
Dear Money Makers & Market Robbers, 🕵️♂️💸🚀
Welcome to another strategic strike by Thief Trading Style™—where smart analysis meets bold execution. We're targeting XAU/USD (Gold) in this scalping/day-trade opportunity, primed with fundamentals, technicals, and pure robbery logic.
🔍 THE GAME PLAN
We're looking at a neutral zone turning bearish, and here’s how the robbery unfolds:
🔑 ENTRY POINTS
🎯 “Vault wide open” signal!
Initiate short orders at current price zones or set layered SELL LIMITS near swing highs on 15M/30M charts. We're running a DCA-style pullback entry for max loot.
🕵️♀️ Entry isn't about one shot—it's about precision raids.
🛑 STOP LOSS: THE ALARM SYSTEM
Set SL just above the nearest swing high (4H timeframe preferred).
Use candle wick tips as your defense line (Example: 3350.00).
Adjust SL based on risk appetite and number of orders stacked.
🎯 TARGET: THE GETAWAY PLAN
💸 First Vault: 3280.00
💨 Or escape earlier if price action signals reversal. Protect your gains. Professional thieves don't get greedy.
📊 WHY WE’RE ROBBING HERE
This level is a high-risk barricade zone—police aka "market makers" are strong here.
We spotted consolidation, oversold signals, trend reversal setups, and a bullish trap disguised as support. A perfect time to strike. 🧠🔍
📰 FUNDAMENTAL & SENTIMENTAL CHECKPOINTS
🔎 Stay updated with:
Global news drivers
Macro & Intermarket analysis
COT reports & future trend targets
👉 Check the 🔗🔗🔗
⚠️ TRADING ALERT - STAY SAFE DURING NEWS BOMBS!
Avoid entries during major economic data releases.
Use trailing SL to protect running profits.
Monitor volatility spikes & price anomalies.
💖 JOIN THE CREW, BOOST THE HEIST!
If this plan adds value to your trades, hit that Boost Button 💥
Support the Robberhood and help grow the gang of smart money snipers 🕶️💼💣
Every boost = more ammo for next mission. Let's rob the market—not each other. 🚀🤑
📌 Remember: Market is fluid. Stay sharp, adapt quick, and trade like a shadow.
Catch you soon in the next grand heist 🎭💼
#XAUUSD #GoldTrade #ScalpingStrategy #DayTrading #ThiefTrader #RobTheMarket #BoostForMore #NoChaseNoCase
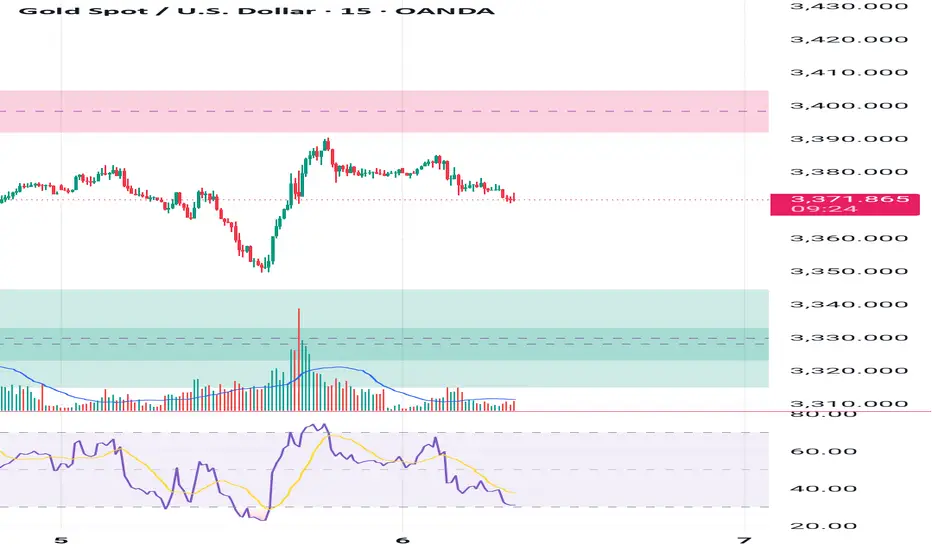
Gold Breaks $3,352 Support – Further Downside Risk📊 Market Overview:
• Spot gold is now trading at $3,352–3,356/oz, sliding sharply on profit-taking and uncertainty over potential U.S. import tariffs on gold.
• Weak buying interest at support pushed the price below the 200-hour MA, opening the door for deeper declines.
📉 Technical Analysis:
• Key resistance: $3,360–$3,365
• Nearest support: $3,345; next at $3,330
• EMA 09: Price remains below EMA09 → short-term trend is bearish
• Momentum: RSI below 45, sellers maintain control
📌 Outlook:
• Gold may continue to decline toward $3,345 or $3,330 if the H1 candle closes below $3,350.
• Only a break back above $3,365 with strong volume could trigger a short-term reversal.
💡 Suggested Trading Strategy:
SELL XAU/USD: $3,362–3,365
🎯 TP: 40/80/200 pips
❌ SL: $3,368
BUY XAU/USD: $3,345–$3,348 (only if clear bullish reversal candlestick forms)
🎯 TP: 40/80/200 pips
❌ SL: $3,342

Prediction Xxauusd keeps rejecting of this box on the 3 hour if we see a close above we will see the 90s


XAU/USD to break out - next target 3500Gold Technical Outlook & Macro Setup
Gold appears to be forming a bullish flag pattern on the daily chart, following a brief dip in late July that didn’t gain traction. If prices can hold above the $3,406–$3,412 range, the trend remains upward. A daily close above this level, followed by a break of the early August high near $3,418, could trigger a move toward the June highs in the $3,448–$3,458 zone, and potentially up to the psychological level of $3,500.
This $3,500 target aligns with a classic flag breakout projection—adding the height of the flagpole (around $130) to the breakout base near $3,400. Supporting this view, COMEX gold futures hit an intraday record of ~$3,534 on August 8, showing the upside potential even as spot prices consolidate just below the June 13 peak of ~$3,448.
Key Macro Catalysts This Week
Several economic events this week could influence gold’s direction:
Reserve Bank of Australia (RBA) Rate Decision – Tuesday, August 12 at 2:30 pm AEST (4:30 pm NZT). A dovish outcome could weaken the USD slightly, which tends to support gold.
U.S. CPI (July) – Tuesday, August 12 at 8:30 am ET (Wednesday, August 13 at 12:30 am NZT). This is the main event for market volatility, especially for the dollar and real yields.
UK GDP (June) – Thursday, August 14 at 6:00 pm NZT.
China’s July Economic Data – Industrial production and retail sales expected between Thursday and Friday (August 14–15). These could affect global risk sentiment and the dollar.
U.S. PPI (July) – Friday, August 15 at 8:30 am ET (Saturday, August 16 at 12:30 am NZT), rounding out the inflation picture.
Trading Levels to Watch
Bullish Scenario: A daily close above $3,406–$3,412, followed by a break of $3,418, opens the door to $3,448 and potentially $3,500. Expect resistance near $3,500.
Bearish Scenario: A close below ~$3,395–$3,384 suggests the flag pattern is still developing, and gold may remain range-bound until macro data provides a clearer direction.
Bottom Line: The technical setup supports a bullish breakout toward $3,500. This week’s economic data will likely determine whether that move materialises.

U.S. Slaps 39% Tariff on Swiss Gold BarsU.S. Slaps 39% Tariff on Swiss Gold Bars, Shaking the Global Bullion Market
By Hirad Aryanejad – Macroeconomic & Gold Markets Analyst
---
The United States has moved to impose a 39% tariff on imports of one-kilogram and 100-ounce gold bars from Switzerland — a shock decision that could ripple across the global bullion market.
In a letter dated July 31, 2025, the U.S. Customs and Border Protection (CBP) reclassified these widely traded bullion products — critical to the Comex futures market — as “semi-manufactured”, making them subject to duties.
Previously, they were classified as “unwrought, nonmonetary gold” , exempting them from earlier tariff rounds.
---
A Blow to the World’s Largest Refining Hub
The decision follows former President Donald Trump’s broader tariff package on all Swiss goods, announced after rejecting Switzerland’s proposal for a 10% tariff in exchange for \$150 billion in U.S.-bound investment.
Switzerland — the world’s largest gold refining hub — exported roughly $61.5 billion in gold to the U.S. over the 12 months ending June 2025. The new tariff could add nearly $24 billion in duties.
Christoph Wild, President of the Swiss Association of Manufacturers and Traders of Precious Metals, called the ruling “another blow” to Swiss-U.S. gold trade, warning that exports may become “economically unviable”.
---
Market Reaction: Record Gold Prices
The ruling triggered an immediate market shock. Gold futures in New York surged past $3,500 per troy ounce, hitting a record $3,534 on August 8, before pulling back slightly.
Analysts say the rally was driven by both the tariff announcement and gold’s safe-haven appeal amid escalating trade tensions and geopolitical uncertainty.
Some traders described the CBP’s decision as “shocking” and possibly mistaken, predicting legal challenges ahead. The lack of clarity has already caused certain shipments to freeze in transit.
---
The Critical Role of Switzerland in Bullion Logistics
Global bullion trade depends on a triangular supply chain:
Raw gold refined in Switzerland Cast into kilo bars for the U.S. market or 400-ounce bars for London Delivered to satisfy Comex contracts and central bank reserves
This logistical network is now under threat. UBS strategist Joni Teves has questioned whether U.S. gold futures trading can remain viable if tariffs on deliverable products persist.
The Swiss Precious Metals Association noted that the CBP’s clarification applies to all 1kg and 100oz gold bars imported into the U.S. not only those from Switzerland — raising the stakes for global trade flows.
---
Negotiations and Uncertainty Ahead
Switzerland continues to negotiate with Washington to reduce the tariff burden, but uncertainty remains.
The White House is reportedly preparing a clarification on the bullion tariffs that could determine whether the market stabilizes or faces prolonged disruption.
Until then, gold industry players — from major banks to refining houses — are bracing for further volatility, both in pricing and physical supply chains.
---
Keywords: gold market news, Swiss gold bars, U.S. gold tariffs, Comex gold futures, bullion trade, Switzerland gold exports, precious metals refining, gold price surge, macroeconomic analysis.
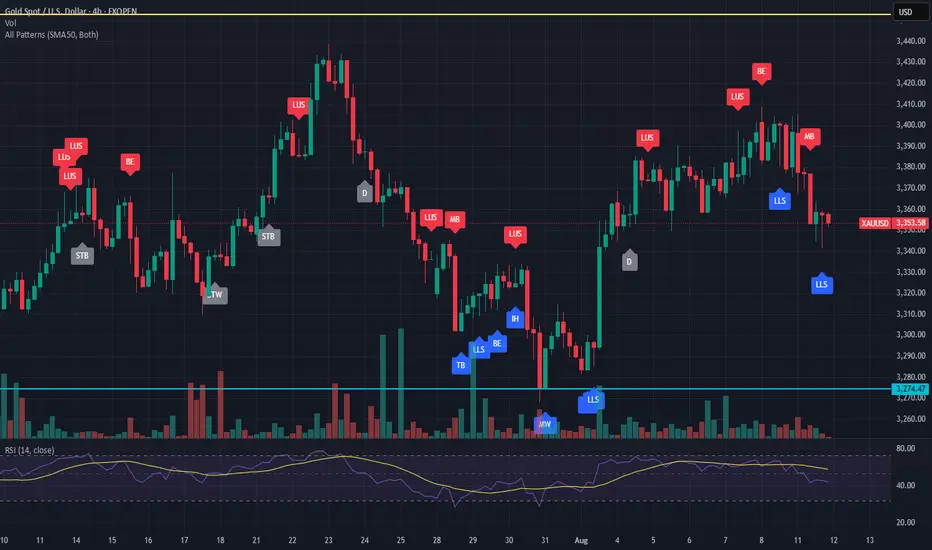
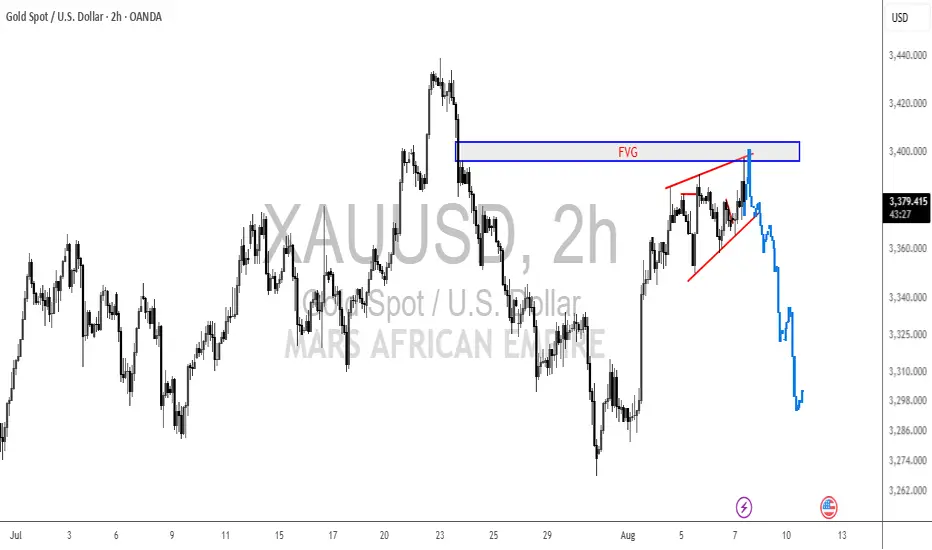
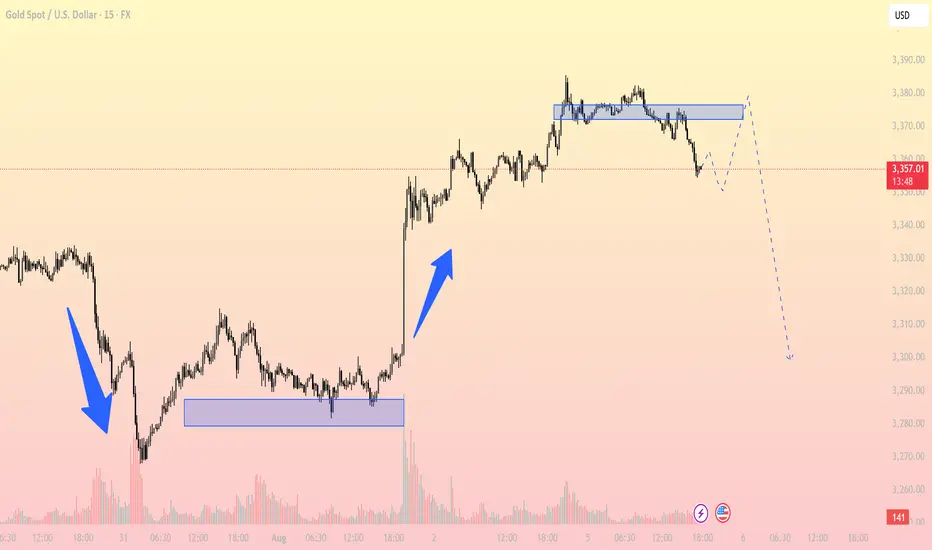
Gold Showing Distribution Signs – Is a Bearish Reversal in Play?Technical Analysis
1. Key Support & Resistance Levels
Short-term Resistance: 3,375–3,380 USD (previous consolidation zone now acting as supply)
Major Support: 3,300 USD (prior breakout base, possible Fibonacci target zone)
Intermediate Support: 3,335 USD (intraday low during the current correction)
2. Structure & Trend
The chart shows a strong bullish impulse on August 2, breaking out of a prolonged consolidation base.
After the breakout, price entered a distribution phase around 3,375 where momentum stalled and volume declined.
A clear breakdown from the distribution zone is now underway, suggesting increased selling pressure and a possible retest of lower demand areas.
3. Price Action Behavior
Price is currently attempting a pullback retest toward the broken structure near 3,370–3,375.
There’s potential for a small head and shoulders pattern, with the neckline near 3,335. A confirmed break below this level could accelerate the move down to 3,300.
4. EMA & RSI Outlook
EMA20 is beginning to turn downward and may soon cross below the EMA50, hinting at a short-term bearish trend shift.
RSI (not shown but worth watching) is likely cooling off from overbought levels, providing space for further downside.
Trading Strategy Ideas:
Sell on pullback to resistance:
Entry zone: 3,370–3,375
Target: 3,335 and 3,300
SL: 3,382
Short-term Buy if RSI oversold + bullish price action: 3,335
Target: 3,370
SL: 3,325
Gold is showing signs of weakness after a sharp rally. The breakdown from the distribution zone indicates a shift in sentiment. If price fails to reclaim 3,375 and confirms below 3,335, the 3,300 support could be the next key destination.
Follow to receive more high-quality trading strategies in upcoming sessions. Save this idea if you found it useful!
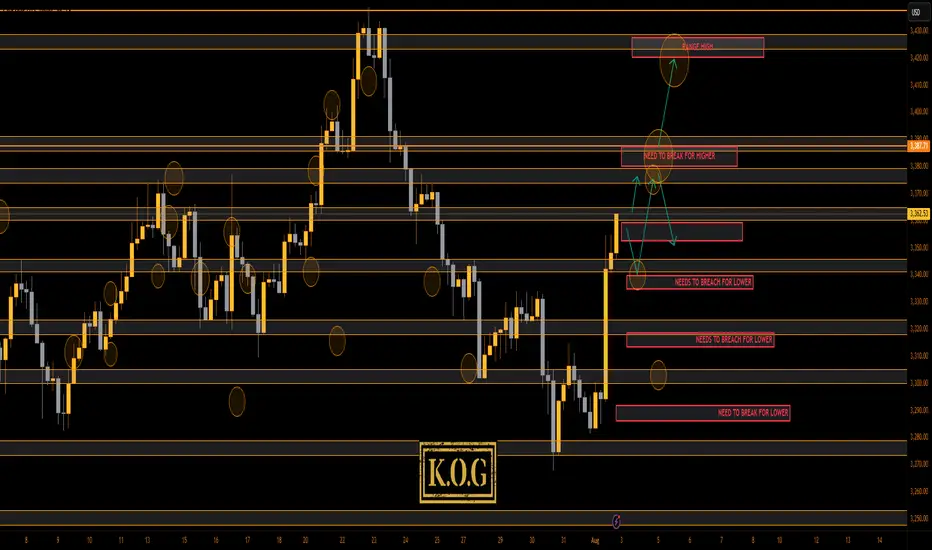
THE KOG REPORT THE KOG REPORT:
Due to there being no KOG Report last week so we won’t reference it, however, we did post the FOMC and NFP reports for the wider community to help them navigate the moves, which as you can see from the pinned ideas worked well.
So, what can we expect in the week ahead?
After the move we observed for NFP on Friday we would like to see some retracement in the sessions ahead. Looking at the 4H chart we have a reversal in play, but we still have no break out of this range! We’re simply playing the highs and the lows while price chops and whipsaws within it, which could be causing some new traders confusion and frustration.
We have a support level below 3350 and below that 3340 which will be the bias level for this week as bullish above. We then have the intra-day resistance level 3365-70 while there is an extension of the move into the 3385 level. Ideally, what we want to see here is support levels hold or a quick continuation on the open into the higher red box levels and the a potential for a RIP. That RIP however is most likely going to be a scalp unless we come down and break below that 3345-50 level.
We want to see how this reacts at these higher levels and if we do get a break of the boxes, otherwise, there is a chance we see another curveball like we suggested a couple of weeks ago, and we correct this whole move back downside with the first hurdle being 3340-35 on the flip.
We’re going to keep it simple here for now and usual we’ll update during the week once we have a clearer understanding of whether this wants to attempt a new all time high or not.
Please note, our liquidity indicator is suggesting a little higher but a pullback is on the way.
We’ll keep you updated.
KOG’s bias for the week:
Bullish above 3340 with targets above 3370, 3373, 3379 and above that 3384
Bearish on break of 3340 with targets below 3330, 3320 and below that 3310
RED BOXES:
Break above 3365 for 3372, 3375, 3379, 3384 and 3390 in extension of the move
Break below 3350 for 3346, 3340, 3335 and 3330 in extension of the move
Please do support us by hitting the like button, leaving a comment, and giving us a follow. We’ve been doing this for a long time now providing traders with in-depth free analysis on Gold, so your likes and comments are very much appreciated.
As always, trade safe.
KOG