Opportunities only come to those who are preparedThe market expects the probability of the Federal Reserve cutting interest rates in September to be over 70%, with some institutions even predicting as high as 93.6%. Fed officials have recently released dovish remarks. If the rate cut is implemented, it will reduce the opportunity cost of holding gold, which is good for gold prices. The US has imposed tariffs on India and Switzerland, exacerbating global trade tensions and boosting demand for gold as a safe haven. The deadlock in the Iran nuclear talks and the shipping risks in the Red Sea have increased market risk aversion. Focus is on US initial jobless claims data and speeches by Fed officials. If the data is stronger than expected, it may suppress expectations of a rate cut and be bearish for gold. If the US dollar strengthens or geopolitical risks ease, gold prices may come under pressure and fall. Today, gold mainly showed a high-level fluctuation trend, hitting a high of $3397.25/oz in European trading before falling sharply. It is currently trading around $3382. Although gold prices are still in an upward channel, they have recently shown a high sideways trend. The market lacks unilateral driving factors. Gold can be shorted at high levels. It is recommended to short gold in batches around the highs of 3390-3405.
XAUUSD trade ideas

XAU/USD Buy Setup 1H Analysis Trendline breakout.Instrument: Gold Spot / USD
Timeframe: 1H (1 Hour)
Chart Tools Used:
Ichimoku Cloud
Trendline breakout
Target projection (highlighted in blue arrow and price levels)
Volume not shown directly but momentum is clear from breakout
---
💹 Buy Setup Analysis
✳ Current Price: $3,362.895
🔼 Entry (Buy): Around $3,363.590 (as marked on the chart)
🎯 Targets:
Target Number Price Level Approx Gain % Move
1st Target $3,393.481 ~$30 ~0.89%
2nd Target $3,433.864 ~$70 ~2.06%
🔻 Stop-Loss (Suggested): Below Ichimoku Cloud, ideally near $3,315.860 or $3,322.672
---
🧠 Strategy Logic
The chart shows a clean bullish breakout of the trendline and Ichimoku cloud.
Strong upward momentum candle confirms the breakout.
Targets are based on measured move and previous resistance zones.
Volume and sentiment look bullish, aligning with the breakout.
A pullback to the breakout zone (~$3,340–$3,350) would be healthy for re-entry.
---
📝 Summary of Buy Setup
Parameter Value
Entry $3,363.590
Target 1 $3,393.481
Target 2 $3,433.864
Stop-Loss $3,322.672–$3,315.860 (zone below cloud)
Risk-Reward ~2:1 to 3:1 based on SL/TP choice

Gold Showing Distribution Signs – Is a Bearish Reversal in Play?Technical Analysis
1. Key Support & Resistance Levels
Short-term Resistance: 3,375–3,380 USD (previous consolidation zone now acting as supply)
Major Support: 3,300 USD (prior breakout base, possible Fibonacci target zone)
Intermediate Support: 3,335 USD (intraday low during the current correction)
2. Structure & Trend
The chart shows a strong bullish impulse on August 2, breaking out of a prolonged consolidation base.
After the breakout, price entered a distribution phase around 3,375 where momentum stalled and volume declined.
A clear breakdown from the distribution zone is now underway, suggesting increased selling pressure and a possible retest of lower demand areas.
3. Price Action Behavior
Price is currently attempting a pullback retest toward the broken structure near 3,370–3,375.
There’s potential for a small head and shoulders pattern, with the neckline near 3,335. A confirmed break below this level could accelerate the move down to 3,300.
4. EMA & RSI Outlook
EMA20 is beginning to turn downward and may soon cross below the EMA50, hinting at a short-term bearish trend shift.
RSI (not shown but worth watching) is likely cooling off from overbought levels, providing space for further downside.
Trading Strategy Ideas:
Sell on pullback to resistance:
Entry zone: 3,370–3,375
Target: 3,335 and 3,300
SL: 3,382
Short-term Buy if RSI oversold + bullish price action: 3,335
Target: 3,370
SL: 3,325
Gold is showing signs of weakness after a sharp rally. The breakdown from the distribution zone indicates a shift in sentiment. If price fails to reclaim 3,375 and confirms below 3,335, the 3,300 support could be the next key destination.
Follow to receive more high-quality trading strategies in upcoming sessions. Save this idea if you found it useful!
Gold prices plummeted, will the bulls fight back strongly?
International gold prices continued to fall on Monday. Last Friday, the White House announced it would issue an executive order clarifying its position on gold bar tariffs. As the market digests the initial impact of US tariffs, which could disrupt the circulation of gold bars, both spot and futures prices have fallen. Elsewhere, President Trump and Russian President Vladimir Putin plan to meet in Alaska on Friday to discuss ending the war in Ukraine.
A gold market outlook!
Gold opened high and closed low today, having fallen $55 to date. With the price now re-entering the key support level of 3350, whether it can rebound is the key to today's market. I am currently bullish on 3350, as it was a key support level during previous periods of multiple resonance. A break below this level would be highly unfavorable for bulls.
In the short term, 3350 is the starting point for the non-farm payroll report. If it breaks, it could potentially reach the early-month low of 3340. Today, I suggest continuing to try a long position at the current level of 3349. The defensive retracement point is at the early-month low of 3340, hoping for a pullback. The upward trend is towards 3365-73!
Gold: Enter a long position directly at the current price of 3349-50, with a defensive level at 40 and a target of 3365-73!

Gold’s Balancing Act – Pressure Builds at the Pivot ZoneGold is moving within a defined upward channel, currently trading near 3,378, with both buyers and sellers focusing on the same critical area — the 3,360–3,370 pivot zone.
A sustained hold above this zone could shift momentum in favor of the bulls, opening the path toward 3,400 and the channel ceiling at 3,416.
Conversely, a decisive break below 3,360 may trigger further downside, with potential targets at 3,340 and 3,320. This is the type of level where markets commit to a direction — and once that decision is made, price movement often accelerates.
What’s your view?
Do you see gold holding this support for another rally, or is a breakdown more likely this week? Share your thoughts and analysis in the comments below.
Disclaimer:
This is not financial advice. Please ensure you apply prudent risk management in all trading decisions.

Gold comets that came in Earth's orbit Gold mining is very popular. They are many different products and Earth's orbit and they have all become a part of mining since the beginning of time in which there are many more products to be mined for.
XAUUSD - The bullish backdrop remains strongOverall Market Sentiment
The bullish background remains strong: the dollar index is putting pressure on gold, while geopolitical tensions and expectations of a rate cut by the Fed are increasing demand for the safe-haven asset
Direction by indicators: on Investing.com — 9 “Buy” signals against 3 “Sell” signals on moving averages and a neutral overall state
Support and resistance levels
Key support levels: $3,320 and $3,368–$3,340. A rebound from this zone could serve as a starting point for growth
Resistance: it is important to break $3,400 — a psychological and technical barrier, above which a directional move to $3,450 and beyond will open
Short-term scenario (LiteFinance): gold is testing resistance in the $3,380–$3,391 zone; a drop from there could lead to $3,330 → $3,268, and a breakout to the upside would accelerate growth to $3,493–$3,515
Union traders are noting the movement after the breakout of $3,375: possible targets are $3,390, $3,402.56 and $3,416.39. A breakout below $3,374.91 could send gold to $3,358.25, $3,350.01 and $3,341.18
1H chart analysis: Gold confidently broke through the $3,350 level, opening a bullish scenario, confirmed by macro dynamics and expectations of monetary policy easing

Daily Gold Mapping (XAUUSD) — 7 August 2025
Market Bias: Bullish with Short-Term Rejection Possibility
Key Levels to Watch:
Resistance Zone (H4 Fresh Supply)
3383 - 3386
- Price is approaching a fresh H4 resistance area.
- We are eyeing this zone for a potential short-term rejection or pullback, suitable for scalping short entries.
- However, this zone is not a confirmed reversal unless price gives clear bearish structure.
Support Zone (H4 Demand + Double Bottom)
3362.5 - 3359.5
- A solid H4 support base has formed here.
- Double bottom structure hints at strong bullish sentiment from buyers defending this area.
- If price returns to this zone, we anticipate potential buy entries as continuation of bullish trend.

Gold (XAU/USD) - Trading Signals Post-Trend BreakoutIntroduction:
Analysis of Gold (XAU/USD) on lower timeframes, focusing on the breakout from an ascending trendline.
Technical Analysis:
Pattern: Breakout below $3,380.00, potential drop to $3,335.00 or $3,300.00.
Levels: Support at $3,335.00 and $3,300.00; resistance at $3,380.00.
Scenario 1:
If a strong bullish candle forms at $3,335.00, go long to $3,380.00 (stop loss behind bullish candle).
From $3,380.00 with candle confirmation, go short to $3,300.00 (stop loss at $3,412.00).
Scenario 2:
If price drops to $3,300.00 without rebounding, go long with a strong bullish candle to $3,400.00 (stop loss at $3,275.00).
Risk Management:
Risk-to-Reward: Scenario 1 (1:2), Scenario 2 (1:3).
Conclusion:
Breakout below $3,380.00 suggests a drop to $3,335.00 or $3,300.00. Await candle confirmation for long or short entries.
Disclaimer:
This analysis is for informational purposes only and not financial advice. Conduct your own research.
Tags: #Gold, #XAUUSD, #TradingSignal.
Time: Now (02:10 PM CEST, August 11, 2025).

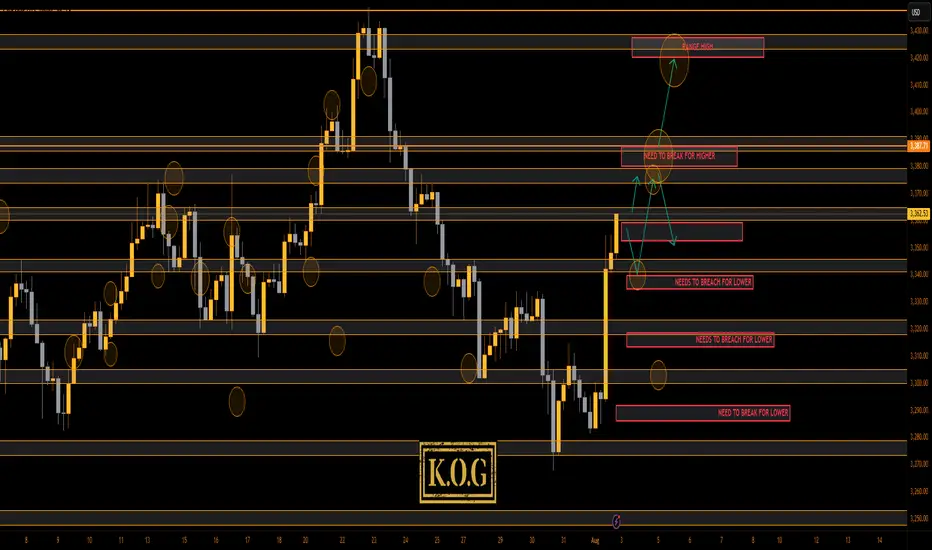
THE KOG REPORT - NFP UPDATE 1H 1H:
This is the chart we used last week for the FOMC and NFP KOG Reports. From the chart we can see the low was captured for FOMC and NFP didn’t give us an undercut low. We’ve kept the potential target box from the Report and for now we’ll stick with it. Red box defence is active below at the 3340-5 level and the ideal target stands above in the oval as long as we remain above the 3340 bias level.
KOG’s bias for the week:
Bullish above 3340 with targets above 3370, 3373, 3379 and above that 3384
Bearish on break of 3340 with targets below 3330, 3320 and below that 3310
RED BOXES:
Break above 3365 for 3372, 3375, 3379, 3384 and 3390 in extension of the move
Break below 3350 for 3346, 3340, 3335 and 3330 in extension of the move
Please do support us by hitting the like button, leaving a comment, and giving us a follow. We’ve been doing this for a long time now providing traders with in-depth free analysis on Gold, so your likes and comments are very much appreciated.
As always, trade safe.
KOG


August 11 Gold AnalysisAugust 11 Gold Analysis
⚠️ Key Events
1. The Federal Reserve Chair Succession Turmoil
- On August 10, U.S. Treasury Secretary Bensoner publicly announced that he was searching for a successor to Powell. The new chair must meet three key criteria: overall control, market credibility, and forward-looking decision-making (rather than relying on historical data).
- Trump continues to pressure the Fed to cut interest rates, even threatening Powell with a leadership change. Powell responded forcefully, stating that "monetary policy must be completely depoliticized," but acknowledging that the economic impact of tariffs is still being assessed.
- Market Impact: The Fed's independence faces its most severe challenge in a decade. If Powell leaves early, expectations for aggressive easing will rise, but the risk of political interference will undermine the long-term credibility of the U.S. dollar, which is fundamentally positive for gold.
2. The Impact of the Gold Bar Tariff Policy
- On July 31, U.S. Customs and Border Protection (CBP) imposed high tariffs on 1 kg gold bars (the mainstream delivery size on the New York Mercantile Exchange). It is not yet clear whether 400 ounce gold bars in the London market will be exempted. - Supply chain crisis erupts: Global gold flows are hindered, and refiners are considering melting large gold bars into 1-kilogram bars before re-importing them into the US (increasing costs). A former JPMorgan Chase director bluntly stated, "I never thought gold would be affected by tariffs," highlighting market panic.
- Hidden dangers in the futures-spot price gap: Tensions over physical delivery are intensifying. If the policy continues, the gold futures premium (previously reaching $100) may widen again.
📉 Economic Data and Policy Interaction
- Probability of a rate cut soars to 90%:
Trump's pressure coupled with a weakening economy (July's ISM non-manufacturing index of 50.1, below expectations of 51.5) has led Donghai Futures to predict a September rate cut, tipping the balance of Fed independence.
- Tonight's CPI release becomes a key catalyst:
If July's core CPI rises by 0.3% month-over-month as expected, it will reinforce the case for a rate cut. If inflation exceeds expectations due to tariffs, it may temporarily suppress gold prices, but will hardly halt the easing trend.
🧭 Technical Structure and Key Positions
- Daily charts battle for the psychologically important 3400 level: A sharp drop to 3382 in the Asian session preceded a rebound, indicating that the 3380-3400 range is a crucial barrier for both bulls and bears.
- Offensive and Defensive Roadmap:
- Bullish Defense Line: 3355 (20/50-day moving average intersection) → 3279 (100-day moving average)
- Breakout Target: A break above 3400 will challenge 3452 (June peak) → the historically important 3500 level.
- Pattern suggests an imminent market reversal: The weekly "ascending triangle" consolidation is at its final stage. If support at 3370 holds, the medium-term target is $3600.
💡 Trading Strategy: Focus on Policy Fissures and Data Pulses
1. Short-Term Opportunities:
- If the price retraces to 3360-3370 (daily support) before the CPI release, establish a light long position with a stop-loss below 3350, targeting 3408-3417.
- If the price stabilizes above 3400 after the data release, go long, targeting 3450; if it unexpectedly falls below 3350, exit and wait and see.
2. Medium-Term Strategy:
- Gradually establish long positions on pullbacks below 3300, betting on a September rate cut and a political uncertainty premium. "Gold's long-term upward trend remains unchanged"—central bank gold purchases and the weakening US dollar provide solid support.
Trade with caution and manage risk! Wish you a smooth trade!

XAUUSD Ascending Channel Run to Supply Trade IdeaGold (XAUUSD) remains in a bullish trend 📈, forming higher highs and higher lows within a well-defined ascending channel ↗️. Price is approaching a recent swing high near resistance 🧱, and I’m watching for a short-term pullback into channel support 🔄 before a potential continuation higher toward the supply zone above 🎯.
This structure aligns with Wyckoff’s markup phase ⚡, where pullbacks serve as tests (LPS) before further upside. As long as price holds above the channel’s lower boundary 🛡️, the bullish bias remains intact — a break below would invalidate the setup ⚠️. Not financial advice.

XAU/USD — Gold at Key Support, Potential for GrowthMarket Overview:
Gold is trading around 3,351 after pulling back from a recent high. Price has bounced off the 3,340–3,345 support zone, which aligns with the EMA144 on the H4 chart. The bullish structure remains intact, and the corrective decline may serve as a base for a new upward impulse.
Technical Signals & Patterns:
• Support zone at 3,340–3,345;
• ABCD pattern targeting the 3,439–3,453 zone;
• EMA144 acting as dynamic support;
• Divergence on AO indicator suggests a possible bullish reversal.
Key Levels:
Support: 3,340, 3,310
Resistance: 3,439, 3,453
Scenario:
• Primary: holding above 3,340 could lead to growth toward 3,439 and 3,453.
• Alternative: a break below 3,340 may increase pressure and target 3,310.

XAUUSD Gold Trading Strategy August 7, 2025XAUUSD Gold Trading Strategy August 7, 2025:
Gold prices are steady as US President Donald Trump has imposed an additional 25% tariff on Indian goods due to India's continued purchases of Russian energy. This new measure raises the current 25% tariff on Indian goods to 50%.
Fundamental news: The current market pulse is still mainly revolving around the tariff story initiated by Trump, in which spot gold is trading in a fairly narrow range. Gold is still waiting for further impact from the Fed's interest rate cut process, a weaker dollar will create support for non-yielding gold.
Technical analysis: The trading range of gold prices is currently narrowing, RSI on H1 and H4 frames is approaching the overbought zone. Gold prices have recovered, but resistance zones such as 3400 - 3405 and 3420 - 3425 can be short-term profit-taking areas for investors. Liquidity zones and Fibonacci frames show that the upward force of gold prices is showing signs of slowing down.
Important price zones today: 3373 - 3378, 3400 - 3405 and 3420 - 3425.
Trading trend today: SELL.
Recommended orders:
Plan 1: SELL XAUUSD zone 3402 - 3404
SL 3407
TP 3399 - 3390 - 3380 - 3360 - OPEN.
Plan 2: SELL XAUUSD zone 3423 - 3425
SL 3428
TP 3420 - 3410 - 3390 - 3370 - OPEN.
Plan 3: BUY XAUUSD zone 3373 - 3375
SL 3370
TP 3378 - 3388 - 3400 (small volume).
Wishing you a safe, successful and profitable trading day.💗💗💗💗💗

XAUUSD WEEKLY TIMEFRAME ANALYSIS Looking at this XAU/USD weekly chart, here’s the detailed analysis:
---
1. Market Structure
Pattern: The market is forming an ascending triangle — higher lows on the trendline and a relatively flat resistance zone around $3,390 – $3,420.
Trend: The broader structure is bullish; price has been in a strong uptrend since late 2024 with healthy pullbacks.
---
2. Key Levels
Resistance zone: $3,390 – $3,420 (multiple rejections here).
Trendline support: Rising support currently near $3,300 and climbing each week.
Breakout target: If price closes above $3,420, the measured move from the triangle suggests a potential rally toward $3,500 – $3,550.
Breakdown risk: A weekly close below $3,300 trendline could signal a deeper pullback toward $3,200.
---
3. Price Action Signals
Bullish bias if: Price breaks and closes above the horizontal resistance with strong volume.
Bearish risk if: Price fails to break resistance and closes below trendline — could indicate trend exhaustion.
---
4. Context With COT Report
If the latest COT report shows increasing non-commercial (speculator) net longs and falling shorts, this supports the bullish breakout case.
If non-commercial longs are declining or shorts increasing, it suggests that this resistance may hold, possibly leading to a pullback.
---
5. Summary
Primary bias: Bullish continuation toward $3,500+ if resistance breaks.
Alternative bias: Pullback to $3,200 if trendline fails.
Watch the next 1–2 weekly candles for a decisive move — this is a classic pressure build-up before a breakout.

Short-time short on gold, planning to long soon🔍Gold (XAUUSD) Technical Analysis – Dual Bias Strategy
Current Trade: Short-term Sell
Overall Plan: Preparing for a Long (Buy) Entry
Thoughts
I’m currently taking advantage of the short-term bearish pressure on gold but staying prepared for a long re-entry once price hits key demand zones. This dual-bias strategy allows me to trade with the trend while managing risk and maximizing opportunities on both ends.


Xau Usd Neyork time buy set up (05/08/2025)XAU USD Can buy with below level as swing as well as intraday
BUY FROM 3352/58
tp1- 3272
tp-2-3284
tp3-3393
tp4- 3410
SL- 3347/45 (for swing i prefer to hold
i use SMC/ fib tools. and truly a price action method for this entry
THE KOG REPORT THE KOG REPORT:
Due to there being no KOG Report last week so we won’t reference it, however, we did post the FOMC and NFP reports for the wider community to help them navigate the moves, which as you can see from the pinned ideas worked well.
So, what can we expect in the week ahead?
After the move we observed for NFP on Friday we would like to see some retracement in the sessions ahead. Looking at the 4H chart we have a reversal in play, but we still have no break out of this range! We’re simply playing the highs and the lows while price chops and whipsaws within it, which could be causing some new traders confusion and frustration.
We have a support level below 3350 and below that 3340 which will be the bias level for this week as bullish above. We then have the intra-day resistance level 3365-70 while there is an extension of the move into the 3385 level. Ideally, what we want to see here is support levels hold or a quick continuation on the open into the higher red box levels and the a potential for a RIP. That RIP however is most likely going to be a scalp unless we come down and break below that 3345-50 level.
We want to see how this reacts at these higher levels and if we do get a break of the boxes, otherwise, there is a chance we see another curveball like we suggested a couple of weeks ago, and we correct this whole move back downside with the first hurdle being 3340-35 on the flip.
We’re going to keep it simple here for now and usual we’ll update during the week once we have a clearer understanding of whether this wants to attempt a new all time high or not.
Please note, our liquidity indicator is suggesting a little higher but a pullback is on the way.
We’ll keep you updated.
KOG’s bias for the week:
Bullish above 3340 with targets above 3370, 3373, 3379 and above that 3384
Bearish on break of 3340 with targets below 3330, 3320 and below that 3310
RED BOXES:
Break above 3365 for 3372, 3375, 3379, 3384 and 3390 in extension of the move
Break below 3350 for 3346, 3340, 3335 and 3330 in extension of the move
Please do support us by hitting the like button, leaving a comment, and giving us a follow. We’ve been doing this for a long time now providing traders with in-depth free analysis on Gold, so your likes and comments are very much appreciated.
As always, trade safe.
KOG
Gold Ascending Triangle Breakout: Targeting $3,463XAU/USD is currently trading at $3,385.91 and has been consolidating in a tight ascending triangle pattern on the weekly chart for the past four months. This structure has formed after a strong impulse move earlier in the year and is now coiling beneath a significant resistance zone at $3,386 to $3,400. Each weekly rejection from this level has added strength to the ceiling, while the consistent formation of higher lows suggests institutional accumulation. Volume has been declining steadily during this period, a classic sign of compression and imminent breakout potential. Fibonacci extensions from the April impulse leg point toward upside targets of $3,463 (1.618), $3,586 (2.0), and $3,708 (2.618). A weekly close above $3,400 with strong volume would confirm the breakout and likely trigger a momentum-driven move toward these levels. Invalidation would occur with a weekly close below $3,330 or a clear break of trendline support. In the current macroeconomic climate—defined by central bank uncertainty, inflationary pressures, and geopolitical tension—gold remains a key hedge. This 4-month consolidation reflects not weakness, but pressure building beneath the surface. As with all sustained triangles, the longer the base, the stronger the breakout. A move from this structure could define the next major phase for gold heading into Q4 2025.

GOLD Reacts Perfectly at Reversal Zone — What’s Next? GOLD Reacts Perfectly at Reversal Zone — What’s Next?
As anticipated in Friday’s analysis, Gold delivered a clean bearish move, dropping from 3400 to 3350 after reacting precisely within our identified reversal zone.
Looking ahead, I expect further downside potential in the coming days. However, a short-term correction may occur ahead of the U.S. CPI release, as markets recalibrate expectations.
Caution is advised — volatility may increase around the data event, and any retracement could offer new entry opportunities for the next leg lower.
You may watch the analysis for further details!
Thank you and Good Luck!
PS: Please support with a like or comment if you find this analysis useful for your trading day

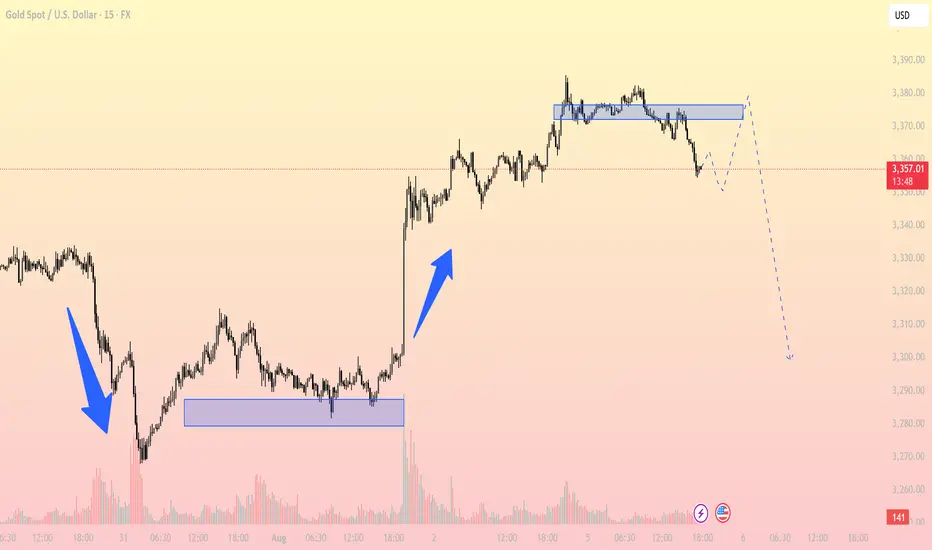
Gold spot/ U.S DollarHere is my first prediction of gold in next few days.
As you can see on the chart, I expect the price to experience decline, then goes for rebounding from 3,301 to 3,338. It won't be farfetched to consider the price starting a rally to retest the resistance above.
