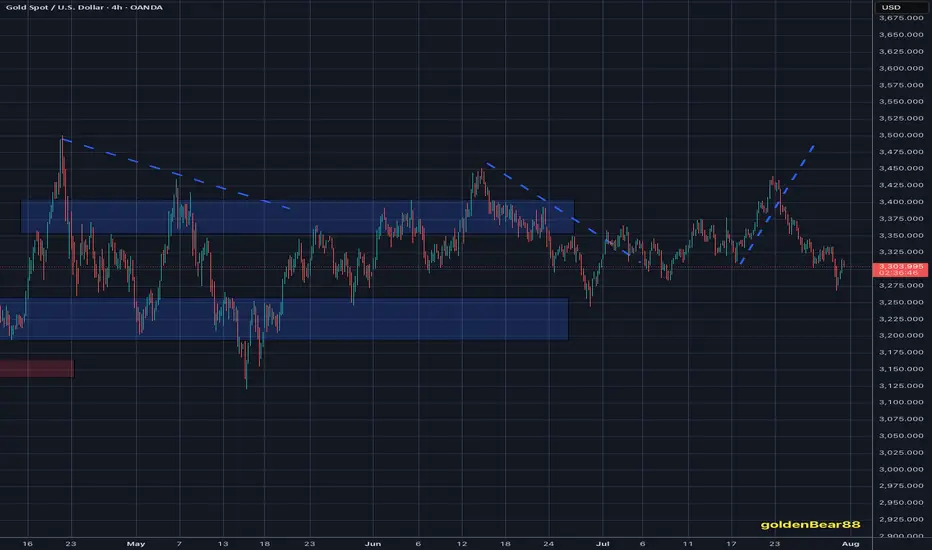
XAUUSD – Downtrend Confirmed, Bears in ControlOn the H4 timeframe, gold has completely broken its short-term uptrend structure and formed a series of lower highs and lower lows. Every bounce is rejected at the strong resistance zone of 3,326 – 3,333 USD, confirming the clear downtrend.
Although the recently released Core PCE index was lower than expected, this is not enough to drive a recovery as other data, such as the Employment Cost Index and statements from the Fed, still show persistent inflationary pressure. Therefore, the monetary policy remains hawkish, causing money to flow out of gold.
Currently, the price is approaching the critical support zone of 3,247. If this level is broken, the scenario of further declines to 3,192 is entirely possible.
XAUUSDG trade ideas

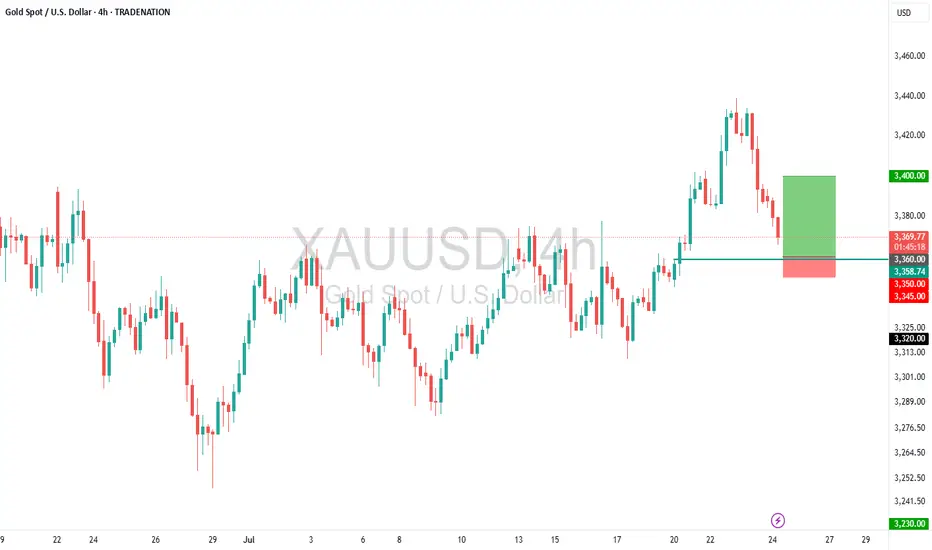
Gold (XAUUSD) – Buy the Dip Toward Key SupportTrade Idea
Type: Buy Limit
Entry: 3360.00
Target: 3400.00
Stop Loss: 3350.00
Duration: Intraday
Expires: 25/07/2025 06:00
Technical Overview
The primary trend remains bullish, supported by recent price structure and sentiment.
Price is correcting lower, and is approaching Fibonacci retracement support at 3360.00.
A Buy Limit at 3360.00 aligns with bespoke support and offers a low-risk entry opportunity.
The target at 3400.00 is modest but achievable within the current intraday cycle
Upcoming Events to Watch
24/07/2025 at 14:45 – S&P Global Manufacturing & Services PMIs (US) could add volatility and act as a catalyst for a reversal from support.
Key Technical Levels
Resistance: 3400.00 / 3420.00 / 3435.00
Support: 3360.00 / 3340.00 / 3320.00
Disclosure: I am part of Trade Nation's Influencer program and receive a monthly fee for using their TradingView charts in my analysis.
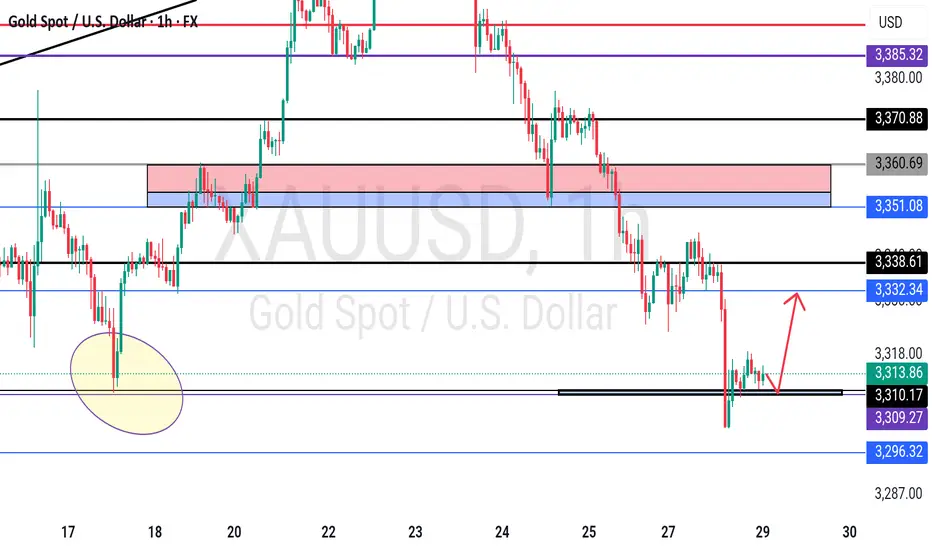
Analysis for the next week (XAUUSD) Hello Traders, Happy Weekend.
The market is going to open tonight, As you see the down trend is running, the price is falling like a waterfall.
Now the market is on the support area according to H1 & H4 TimeFrame.
The market is respecting the support area and there is a Trend line support according to D1 TimeFrame.
The market is respecting the Trend line and support area.
According to my analysis gold will drop till 3287 to 3271.
If gold fly, it can fly till 3350 then it will fall.
Stay tune for update.
Kindly share your views and leave positive comments here, Thanks.

GOLD Range-Bound Before Fed – Breakout Above 3349 Unlocks 3374GOLD | Bullish Momentum Builds Ahead of Fed Decision – Key Range Between 3349 and 3312
Fundamental Insight:
Gold is slightly higher as the U.S. dollar weakens ahead of the Fed’s rate decision. Markets await signals on future policy, which could drive sharp moves in gold.
Technical Outlook:
Gold remains bullish while above 3320, with upside potential toward 3349.
A 1H close above 3349 confirms breakout momentum, opening the path toward 3374, and potentially 3401.
A break below 3320, especially below 3312, would invalidate the bullish setup and trigger downside toward 3285, then 3256.
Currently range-bound between 3349 and 3312 — watch for breakout confirmation to determine the next trend direction.
Key Levels:
• Support: 3320 – 3285 – 3256
• Resistance: 3349, 3374 – 3401
Bias: Bullish above 3320
📍 Watch Fed volatility – breakout expected soon

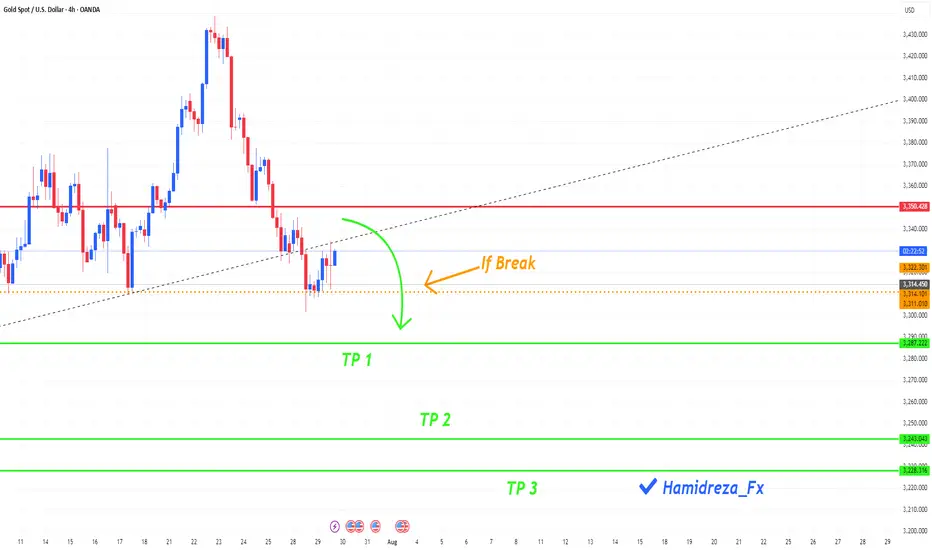
Do you think gold is on a correction?
Hi my dears
Gold looks set to hit lower targets if it breaks the orange dotted line
What do you think?
The weekly timeframe has confirmed the bearish trend.
If you liked my analysis, just like me by liking and commenting.
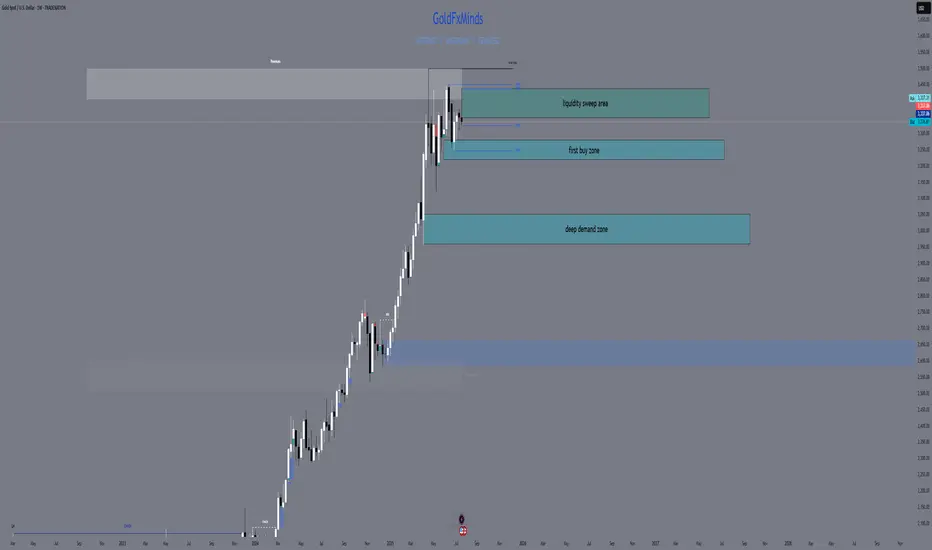
XAUUSD FULL WEEKLY STRUCTURE MAPHello traders! 🌟
We’re stepping into a pivotal week for gold (XAUUSD), and the weekly chart tells a story of tension, liquidity hunts, and potential big moves. Let’s dive into the three truly critical zones, backed by SMC/ICT logic, Fibonacci, EMAs, RSI, and fair‑value gaps — all in one elegant map. 🎨✨
🔹 HTF Overview & Macro Pulse
Current Price: 3336
Weekly Trend: Bullish overall, but momentum is fading as price coils under premium highs.
EMAs (5/21/50/200):
EMA5 & EMA21 are flattening beneath price, hinting at stall.
EMA50 sitting near 3120 as a deep support magnet.
RSI (Weekly): Cooling from ~75 down to ~66, showing bearish divergence vs those upper wicks.
Fair‑Value Gaps:
Unfilled 3365–3405 zone above — institutional imbalance still waiting.
Partially filled 3280–3320 below — common reaction pocket.
Fibonacci Extensions (1984 → 3365 high): 127.2% at 3405, 161.8% at 3439 — the exact top of our supply wick.
Macro Catalysts This Week
Wed (Jul 30): FOMC + Fed Statement
Thu (Jul 31): Core PCE + Unemployment Claims
Fri (Aug 1): NFP + ISM Manufacturing
Prepare for violent spikes into one of our zones — then trade the reaction.
🔸 The Three TRUE Weekly Zones
W1 Supply (Ultimate Wick Zone)
🔥 3350 – 3439
This entire wick from May–July is YOUR one and only supply zone on weekly.
Pure liquidity sweep area
Confluence: unfilled fair‑value gap, 127–161.8% Fib, RSI divergence
Every touch here is a short‑trap until we see a full weekly close above 3439.
W1 Demand (Primary Buy Zone)
🌊 3220 – 3285
The last robust order block & BOS base before gold ran vertical.
Confluence: filled FVG, weekly OB body, EMA21 target, RSI back at 50
Ideal sniper entry after a news‑driven sell‑off into this range.
Deep Discount Block
🛡️ 2960 – 3050
The origin of the full 2024–2025 bull trend — true institutional accumulation.
Confluence: March 2024 CHoCH base, EMA50/200 proximity, 78.6–88.6% Fib retrace
Only for a major quarterly reset; not on the immediate radar unless USD spikes dramatically.
🧭 Strategy & Execution
Short Bias: Wait for a liquidity spike into 3350–3439 (likely around FOMC/NFP), then watch for a clean rejection candle.
Long Bias: After a thrust down into 3220–3285, look for wick‑based rejection plus EMA21 hold and a bullish engulf on weekly.
Avoid the mid‑zone between 3285–3350 — that’s noise, not structure.
Patience is everything. Let price sweep, then let us strike. The real power trades this week will be born from clear structure — not guesswork.
💬 What’s your favorite zone to watch? Drop a comment below!
👍 Smash that like🚀🚀🚀 if you found this map helpful, and hit follow for more GoldFxMinds sniper blueprints.
Disclosure: Analysis based on Trade Nation’s TradingView feed. I’m part of their Influencer Program.
GoldFxMinds 💛
Excellent Selling opportunities deliveredGold delivered excellent re-Sell opportunities and as soon as DX started gaining value after GDP numbers, I was confident in Selling direction. I have Sold Gold on #3,324.80 towards #3,318.80 first, then #3,310.80 extension. Then I have Bought Gold (aggressive set of Scalping orders from #3,302.80 - #3,303.80 belt) closed on #3,306.80 and pre-Fed set of Selling orders on #3,294.80 - #3,296.80 closed below on #3,280's. Final order was #3,270.80 Buy which I kept towards #3,292.80 Resistance. All in all spectacular session for me and my Traders.
Technical analysis: As discussed, as long as #3,300.80 - #3,305.80 former Resistance holds, I was aware that Gold was more likely to push towards #3,270’s for a #2-Month Low’s test, still however within the Hourly 4 chart’s Buying accumulation zone. This week was / is packed with Fundamental announcements and real trend should be revealed (as today’s session Fundamental catalyst interfered and was already digested by markets), since today’s Price-action delivered the session High test around #3,300.80 benchmark and most likely market will close above it, triggering most of the late Sellers Stop-losses and as Bond Yields reversed and DX printed another series of Bullish candles above the Hourly 4 chart’s Support, Gold again reversed above #3,300.80 psychological barrier and is comfortably seen Trading above it. This shows how unstable market has become and that I should expect side Swings on Short-term, but those are not cause for an alarm as underlying Medium-term trend remains Bullish and I am there ready with my key entry points to Profit on this perfect Price-action for my current Trading model.
My position: I do not expect Gold to continue soaring with DX on such numbers and my practical suggestion is to Sell every High's that Gold deliver (in & out as I prefer to do).
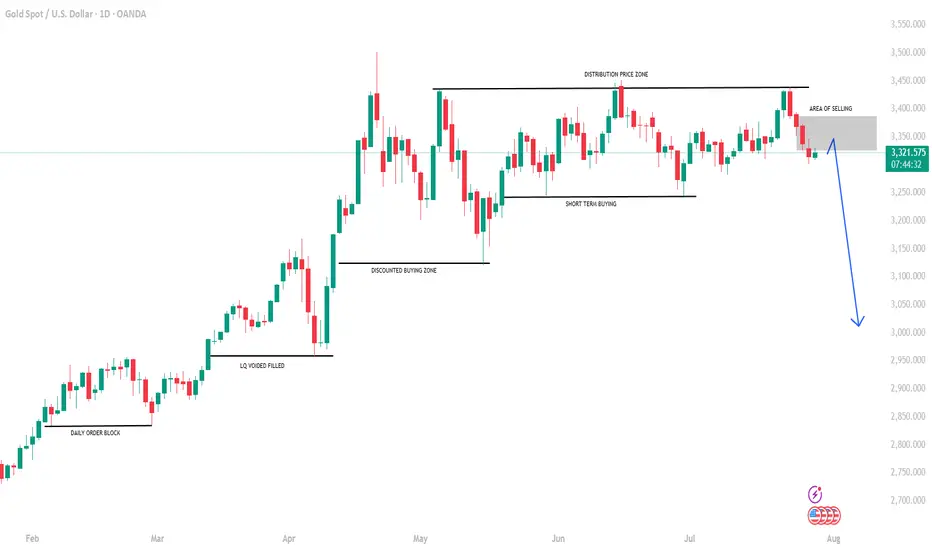
GOLD - One n Single Area, what's next??#GOLD... market just reached at his ultimate area as we discussed in our last week analysis and in Friday analysis as well.
The area is 3309-10
Keep close and don't be lazy here.
NOTE: we will go for cut n reverse below 3309 in confirmation.
Good luck
Trade wisley
GOLD: Time for massive drop? +3000 pips move! Gold has failed to breakthrough the previous resistance indicating a strong sellers hold around $3440 region. Now since the price has stared dropping we can see it dropping around $2800 in long term. In order for this to happen we need strong confirmation, which will help us understand the possible volume.
Agree with our idea?
Like and comment!
gold 4hour say: put sellstop in lowpersonaly i predict mini crash on gold and waiting for it , now we have powerfull 3angel pattern we must put sellstop in last low , buystop on last high
sellstop stoploss = last high
if sellstop open like new traders , dont close it soon , wait minimum 2 week ,understand?
ALERT= if gold can break last high , it can start new up trend, wave , so if you have old sells ,you must put SL or hedge buystop in last low
if sell
wishhhhhhhhhhhhhh youuuuuuuuuuuuuuuu win

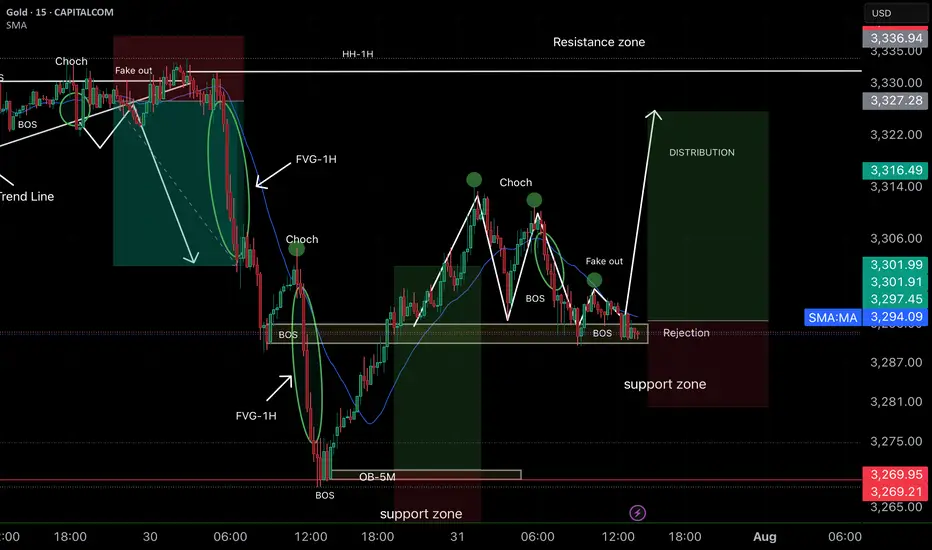
Smart Money Concepts (SMC) ✅ Analysis strengths:
• Correct identification of BOS (Break of Structure) and CHoCH, which indicate a change in direction.
• The support zone is marked and respected with rejection, reinforcing the probability of a rebound.
• The projection toward the distribution zone and HH of 1H is consistent, as there are inefficiencies (FVG) pending mitigation.
• The previous fake out clears liquidity and creates room for strong bullish momentum.
15-minute timeframe for XAU/USDKey Elements and Observations:
Price Action:
The price initially shows a downtrend, breaking below a previous low, indicated by "BMS" (likely "Break in Market Structure" or "Break of Market Structure").
Following the break, the price consolidates and then shows a strong upward movement, breaking above a resistance level, again marked by "BMS." This suggests a potential shift in momentum from bearish to bullish.
Order Blocks (OB):
5 Min OB (Blue Box, Top Left): There's a "5 Min OB" marked at a higher price level earlier in the chart. This represents a bearish order block, where significant selling pressure was previously observed.
15 Min OB (Teal Box, Bottom Right): A "15 Min OB" is identified at a lower price level (around 3326.00 - 3330.00). This is likely a bullish order block, indicating an area where institutions or large players placed buy orders, leading to a bounce in price.
Break in Market Structure (BMS):
Two "BMS" labels are visible:
The first BMS (red dashed line below 3330.00) indicates a break of a support level during the downtrend.
The second BMS (red dashed line above 3330.00) indicates a break of a resistance level during the subsequent uptrend, confirming a potential shift in market bias to bullish.
Entry, Stop Loss, and Take Profit (Trade Setup):
Entry (Green Line): The suggested entry point for a long (buy) position is at approximately 3339.50. This entry aligns with a retest of a previous resistance level that has now turned into support, or potentially the lower boundary of a small bullish order block or fair value gap.
Stop Loss (Red Line/Red Box): The stop loss is set at 3335.50. This is placed below a recent low or significant support level, specifically within a red-shaded area that likely represents a "Supply/Demand" zone or an area where the trade would be invalidated.
Take Profit (Green Line/Green Box): The take profit target is 3354.00, resulting in a "Profit" of 3354.00. This target is placed at a significant resistance level or an area where price might reverse. The white shaded box above the entry, extending to the take profit, highlights the potential profit zone.
Risk-Reward Ratio: While not explicitly calculated, the visual representation suggests a favorable risk-reward, with the potential profit (green box) appearing larger than the potential loss (red box).
Pivot Point (P):
A "P (3345.227)" is marked on the chart, likely indicating a pivot point, which can act as a dynamic support or resistance level. The current price is trading above this pivot point, further supporting a bullish bias.
"BMS: 61.36%" (Bottom Right):
This percentage likely refers to a "Break in Market Structure" metric or a specific trading indicator that quantifies the strength or probability of the market structure shift. 61.36% suggests a reasonably strong confirmation.
Implied Trading Strategy:
The chart depicts a bullish reversal strategy, likely based on "Smart Money Concepts" or "ICT" (Inner Circle Trader) principles. The strategy involves:
Identifying a shift in market structure: Price breaking highs after breaking lows, signaling a change from bearish to bullish.
Utilizing Order Blocks: Using the 15 Min OB as a foundational support level and potentially looking for entry confirmations around it.
Waiting for a Retest/Pullback: The entry around 3339.50 suggests waiting for a pullback after the initial bullish impulse. This could be a retest of a broken resistance level, a fair value gap (FVG), or a small bullish order block within the larger 15 Min OB.
Placing Stop Loss Strategically: Below a significant low or invalidation point.
Targeting Previous Highs/Resistance: Setting the take profit at a logical resistance level where previous selling pressure was observed.

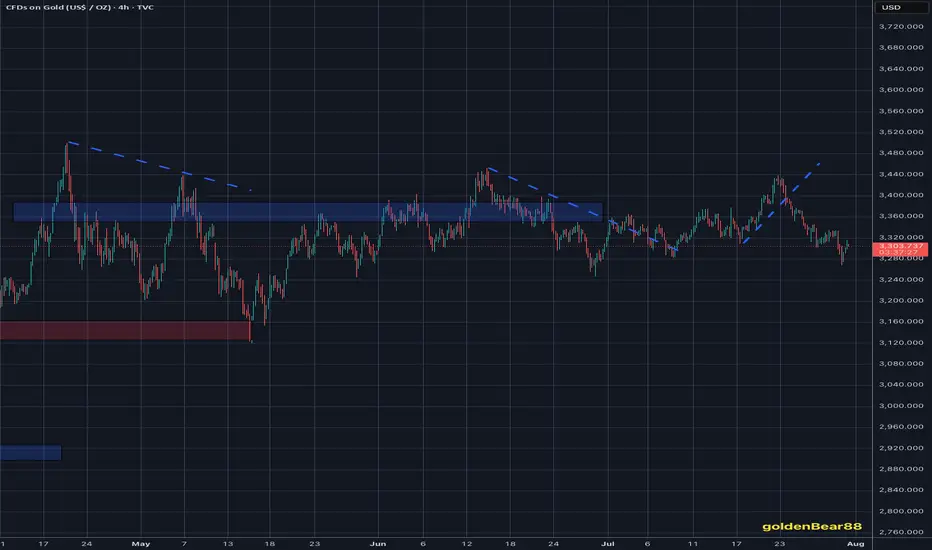
Gold short opportunityGold completed its mini bull flag target and re-entered a micro rising channel, a potentially bearish structure.
With price now testing a key supply zone, we’re watching for rejection to initiate a short, targeting the major demand zone below.

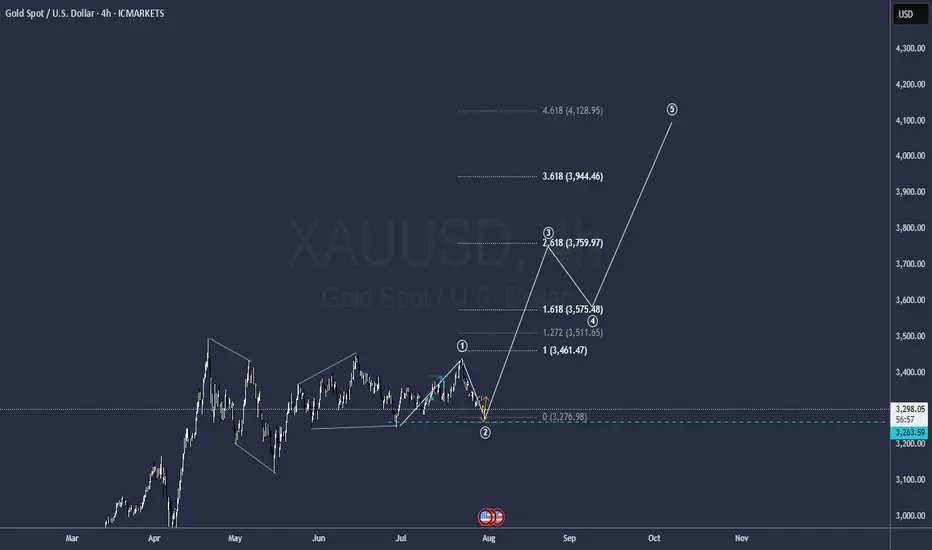
GOLD to all time highsIt is ready
a bitch wave one correction seems to be over so get ready to hit 4.000
GG
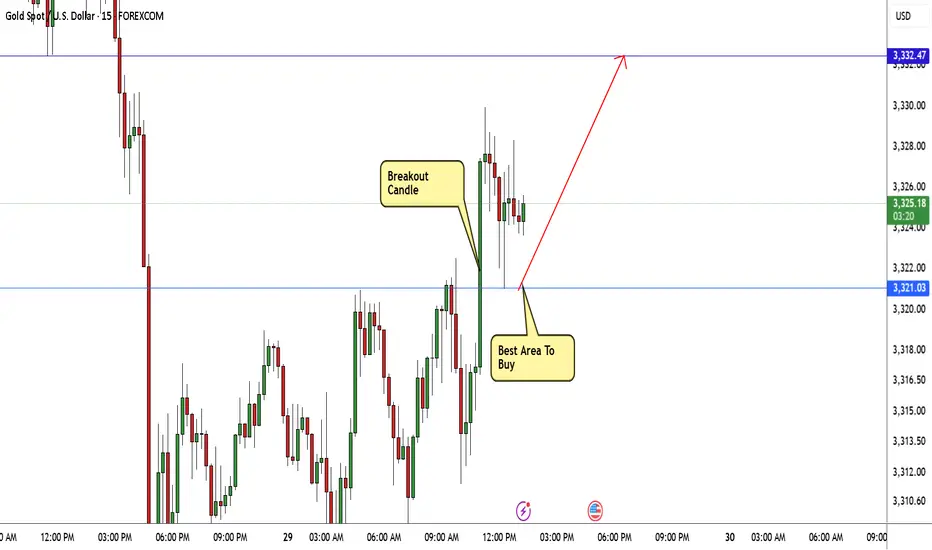
GOLD Breakout Done , Long Setup Valid To With Great ProfitHere is My 15 Mins Gold Chart , and here is my opinion , we finally above 3321.00 and we have a 15 Mins Candle closure above this strong res , so I'm waiting the price to go back and retest this res and new support and give me a good bullish price action to can enter a buy trade , and if we have a 4H Closure Above This res this will increase the reasons for buyers , just wait the price to back a little to retest it and then we can buy it . if we have a daily closure below it this idea will not be valid anymore .

GOLD WILL BOUNCEHappy new week Families, Gold is expected to bounce back to the up side from my indicated buy zone. All the best of the week.

XAUUSDHello Traders! 👋
What are your thoughts on GOLD?
Over the past week, gold has been consolidating within a defined range, fluctuating between two key zones.
A break above the marked resistance zone (around $3380-3390) would confirm the start of the next bullish wave, opening the path toward higher targets.
As long as price remains above the identified support zone, our outlook stays bullish.
Key Levels to Watch:
Resistance: Breakout above $3380 needed to confirm continuation
Support: Holding this zone is essential to maintain the bullish structure
Is gold ready for a breakout after consolidation? Share your thoughts below! 🤔👇
Don’t forget to like and share your thoughts in the comments! ❤️

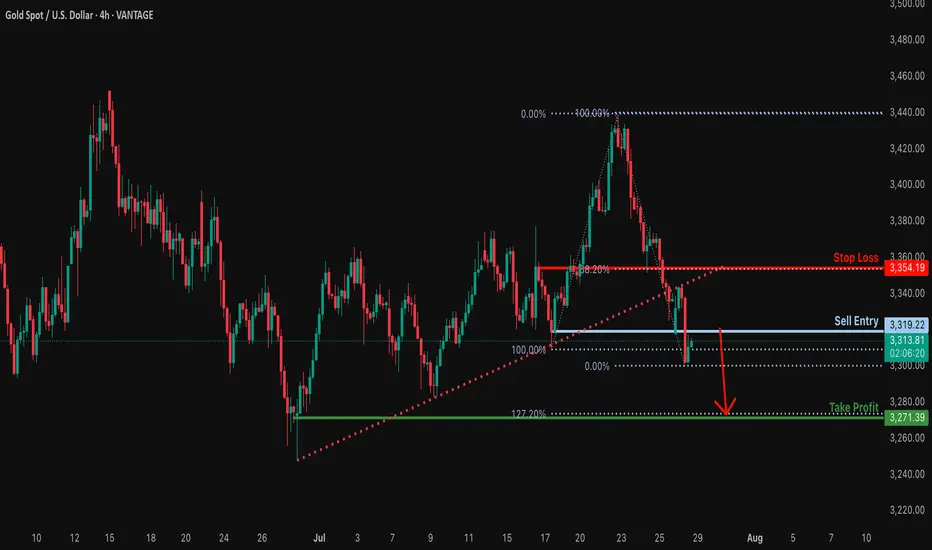
Bearish reversal?XAU/USD is rising towards the resistance level, which serves as a pullback resistance and could drop from this level to our take-profit target.
Entry: 3,319.22
Why we like it:
There is a pullback resistance.
Stop loss: 3,354.19
Why we like it:
There is a pullback resistance that aligns with the 38.2% Fibonacci retracement.
Take profit: 3,271.39
Why we like it:
There is a swing low support that lines up with the 127.2% Fibonacci extension.
Enjoying your TradingView experience? Review us!
Please be advised that the information presented on TradingView is provided to Vantage (‘Vantage Global Limited’, ‘we’) by a third-party provider (‘Everest Fortune Group’). Please be reminded that you are solely responsible for the trading decisions on your account. There is a very high degree of risk involved in trading. Any information and/or content is intended entirely for research, educational and informational purposes only and does not constitute investment or consultation advice or investment strategy. The information is not tailored to the investment needs of any specific person and therefore does not involve a consideration of any of the investment objectives, financial situation or needs of any viewer that may receive it. Kindly also note that past performance is not a reliable indicator of future results. Actual results may differ materially from those anticipated in forward-looking or past performance statements. We assume no liability as to the accuracy or completeness of any of the information and/or content provided herein and the Company cannot be held responsible for any omission, mistake nor for any loss or damage including without limitation to any loss of profit which may arise from reliance on any information supplied by Everest Fortune Group.
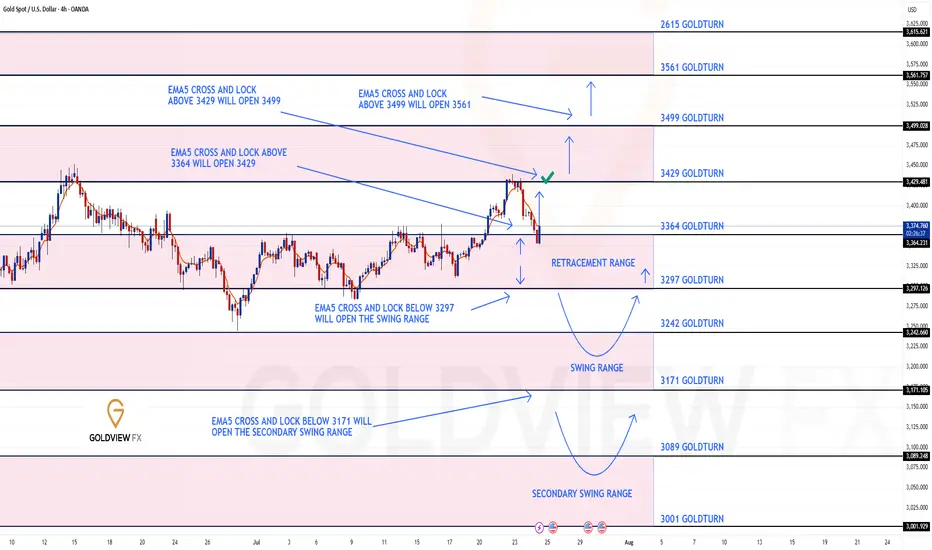
GOLD 4H CHART ROUTE MAP UPDATEHey Everyone,
After completing our 1h chart idea update yesterday, please see our 4chart idea also played out to perfection!!!
We started with our Bullish target hit at 3364 followed with ema5 cross and lock opening 3429. This was also hit perfectly with no further cross and lock above 3429 confirming the perfect rejection.
We are now seeing price play into the retracement zone and will continue to look for reactions on the lower Goldturn, inline with our plans to buy dips.
We will keep the above in mind when taking buys from dips. Our updated levels and weighted levels will allow us to track the movement down and then catch bounces up.
We will continue to buy dips using our support levels taking 20 to 40 pips. As stated before each of our level structures give 20 to 40 pip bounces, which is enough for a nice entry and exit. If you back test the levels we shared every week for the past 24 months, you can see how effectively they were used to trade with or against short/mid term swings and trends.
The swing range give bigger bounces then our weighted levels that's the difference between weighted levels and swing ranges.
BULLISH TARGET
3364 - DONE
EMA5 CROSS AND LOCK ABOVE 3364 WILL OPEN THE FOLLOWING BULLISH TARGETS
3429 - DONE
EMA5 CROSS AND LOCK ABOVE 3429 WILL OPEN THE FOLLOWING BULLISH TARGET
3499
EMA5 CROSS AND LOCK ABOVE 3499 WILL OPEN THE FOLLOWING BULLISH TARGET
3561
BEARISH TARGETS
3297
EMA5 CROSS AND LOCK BELOW 3297 WILL OPEN THE SWING RANGE
3242
3171
EMA5 CROSS AND LOCK BELOW 3171 WILL OPEN THE SECONDARY SWING RANGE
3089
3001
As always, we will keep you all updated with regular updates throughout the week and how we manage the active ideas and setups. Thank you all for your likes, comments and follows, we really appreciate it!
Mr Gold
GoldViewFX
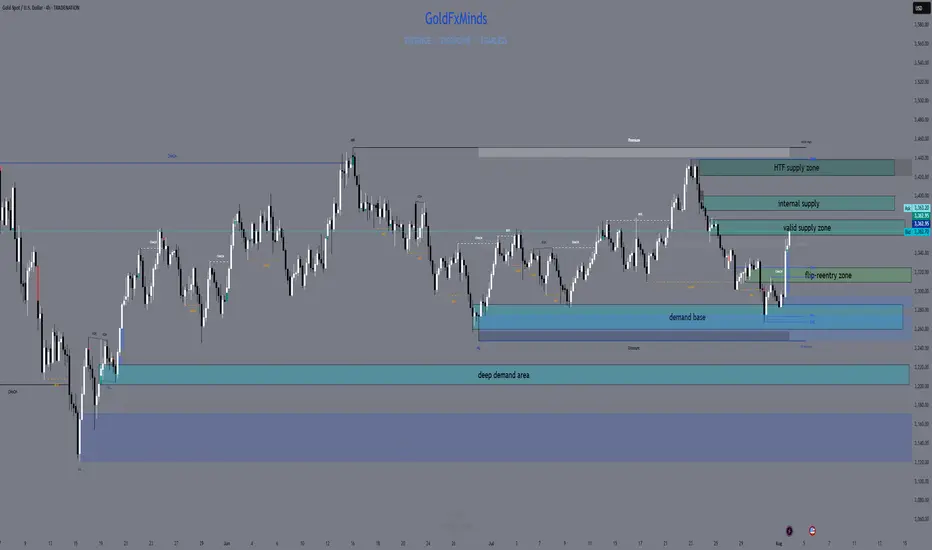
XAUUSD H4 Outlook – August 4, 2025Structure is bullish — but supply is layered. Precision now matters more than bias.
—
Gold is trading at 3362, sitting right inside the heart of a key structural zone. After a strong breakout from 3285–3260, price reclaimed imbalance, broke internal structure, and powered higher into premium. The trend is bullish — but we’ve just stepped into stacked supply.
Let’s break down every zone that matters now, from top to bottom:
🟥 3360–3375 – Valid H4 Supply Zone
This is the first active supply block — the origin of the last bearish leg. It holds a clean OB + imbalance and is currently being tested for mitigation.
We're inside it right now. This zone is critical:
→ If price breaks and holds above it, continuation is likely
→ If we reject here, it confirms sellers are defending their level
🟥 3385–3398 – Internal Supply Trap
A secondary supply zone built from previous order flow.
If bulls push through 3375 without rejection, this is the next area to watch for weakness.
This zone often creates fake breakouts, especially when momentum slows. RSI is already showing signs of exhaustion approaching this level.
🟥 3420–3440 – HTF Supply Trap
This is the top — the last unmitigated supply on the weekly.
It's not in play yet, but if bulls break above 3398 decisively, this is where the bigger trap could form.
Any long into this zone must be backed by strong structure and continuation candles — otherwise, it’s a liquidation magnet.
🟫 3322–3310 – Flip Reentry Zone
If we reject from current supply, this is the first high-probability reentry for bulls.
It’s where the last CHoCH confirmed, and it aligns with EMA confluence and minor imbalance.
Buy setups from here must be confirmed on M15/M30 — no blind longs.
🟦 3285–3260 – Breaker Demand Base
The true origin of the bullish move.
This zone caused the structural flip — clean OB, FVG stack, and liquidity sweep.
If price returns here, it becomes a must-hold for bullish continuation. One of the best sniper zones for longs.
🟦 3222–3205 – Final Demand Layer
Deep structure zone holding imbalance + previous HL base.
Only comes into play if 3260 fails. A break below this would shift bias to neutral or bearish on H4.
🎯 Bias Summary
✔️ H4 bias = bullish
✔️ Price is inside 3360–3375 supply
✔️ EMA 5/21/50 aligned, but RSI is elevated
⚠️ This is not a breakout — it’s a test zone
🔁 Execution Plan
📍 Rejection from 3360–3375 → sell scalp toward 3322
📍 Clean break of 3375 → watch for next short at 3385–3398
📍 Failure of 3398 → HTF draw toward 3430–3439
📍 Pullback toward 3322–3310 → potential long zone
📍 Clean drop to 3285 → high-RR buy area
📍 Break below 3260 → only valid demand left is 3222
—
This is not the time to chase. It’s the time to stalk.
You’re in premium. Supply is active. Let structure decide — you just execute with clarity.
—
Which zone are you watching for your next move?
Comment your bias below 👇🏼 Smash the ❤️ if this brought clarity, and follow GoldFxMinds to trade with precision every day.
Disclosure: Chart based on Trade Nation feed (TradingView).
XAUDUSD SELL LIMITSymbol: XAU/USD
Timeframe: 15 Minutes (15m)
Trade Direction: Short (Sell)
Exact Entry Price:
3,295.254
Entry Rationale: This point is located within the FVG (Fair Value Gap) and at the 78.0% Fibonacci level (Optimal Trade Entry - OTE zone), which has a high potential for a price reaction and attracting sell orders.
Exact Stop Loss:
3,305.953
Stop Loss Rationale: This price is set slightly above the high of the bearish Order Block and also above the Swing High at 3,302.658 to protect the trade from a potential liquidity grab (Stop Hunt).
Exact Take Profit (TP1):
3,270.916
Take Profit Rationale: This target is set at the recent low. This area acts as a sell-side liquidity pool and is the next logical target for the price after pulling back to the supply zone.
