XAUUSDG trade ideas
XAUUSD position takenI have taken a trade in XAUUSD at 3340 ( Target : 3700, SL : 3296).
Why I have taken this trade ?
It has made an ascending triangle pattern .
It is near its support line.
If you build a fixed range volume profile you will find that
it is at Point Of Control.


Gold in Correction modeAs you can see in the analysis now gold is in correction mode and according to CRT also gold have to tap 3277 so be ready for 3277 by anytime as trade tentions are also cooling down which lead to dollar go up and gold go down.
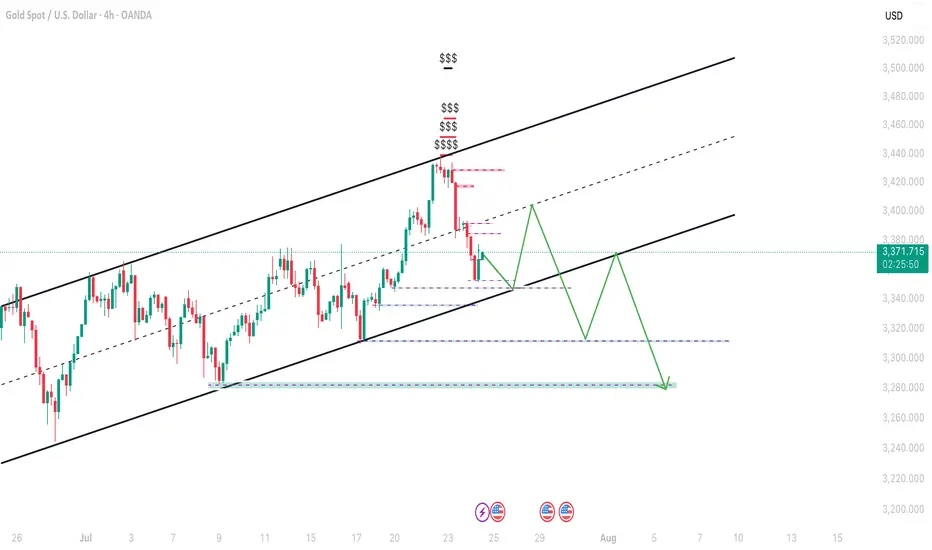
Gold Price Analysis July 24After a correction of about 50 prices in yesterday's session, gold is showing a necessary "breathing" in the long-term uptrend. This is a positive signal, showing that the market is accumulating before continuing its journey towards a new ATH around the 3500 area.
Currently, gold prices are fluctuating within the boundary zone limited by two upper/lower trendlines - creating a clear structure of support and resistance. Avoid trading against the trend if this boundary zone is broken.
📌 Trading plan:
Strategy: Prioritize BUY when price sweeps to support zone
Active buy zone: 3375 (reaction price)
Potential buy zone: 3363 (deep support)
Target: 3431 in the immediate future → further towards 3490
Support: 3375 – 3363
Resistance: 3418 – 3431 – 3490
#GOLD Will Keep Growing!
HI,Traders !
#GOLD keep trading in An uptrend
along the rising support So as the gold
is approaching A the support we will be
Expecting a bullish rebound !
Comment and subscribe to help us grow !

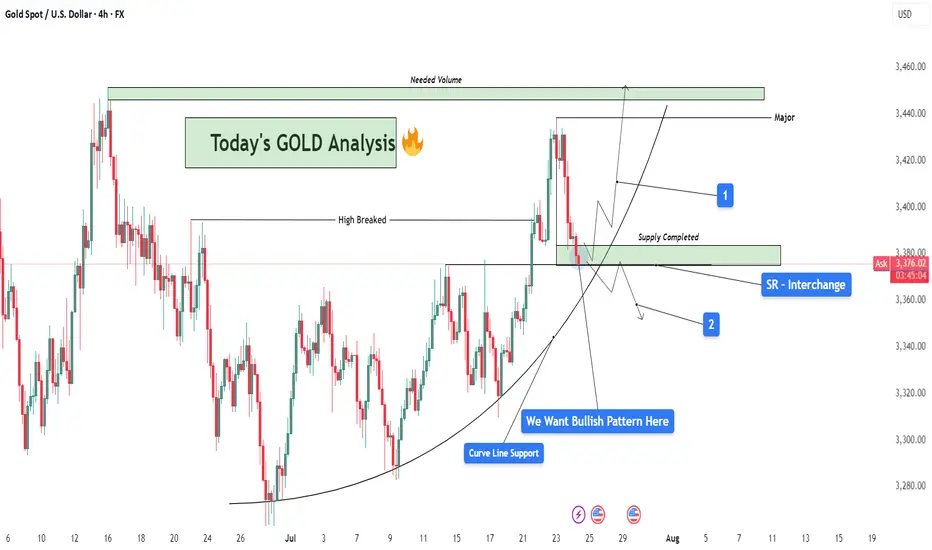
GOLD Analysis : SR Interchange , Reversal Zone + High Break🧠 Market Context & Structural Overview:
Gold has been trading within a clearly defined bullish structure after forming a rounded base pattern in early July, indicating accumulation by smart money. The market recently broke through a key horizontal resistance (previous swing high), marking a potential bullish continuation phase. However, we are now witnessing a pullback — a healthy corrective phase — that is currently testing multiple high-probability confluences.
🧱 Key Technical Zones Explained:
🔹 1. SR Interchange Zone – High Probability Reversal Area:
This area (roughly between $3,360 and $3,380) acted as previous resistance (supply) and has now flipped into support.
This is a textbook Support-Resistance Interchange (SR Flip) — a concept where prior resistance becomes new support.
Traders often look for entries here, especially when it aligns with other technical factors.
🔹 2. Curve Line Support – Dynamic Buyer Strength Indicator:
A curved trendline, often referred to as a parabolic support, has been respecting price structure for over two weeks.
Price is now sitting exactly on this support, signaling potential for another impulsive bullish leg if momentum builds.
🔹 3. Supply Zone Completed – Correction Phase Active:
The supply zone above (approx. $3,420–$3,440) has already been tapped and respected by the market.
This “completed” supply may now act as resistance unless broken with strong volume — we now watch how price reacts at the current pullback zone.
📊 What the Candles Are Telling Us:
The latest candles show some hesitation from sellers — wick rejections and smaller body candles hint at buyer interest at this level. However, confirmation is crucial. We want to see a bullish reversal pattern such as:
Bullish engulfing
Morning star
Pin bar (hammer)
Break and retest of minor resistance inside the SR zone
🔮 Scenarios to Watch:
✅ Scenario 1 – Bullish Continuation (Ideal Setup):
If a bullish reversal forms at this support zone:
Expect a potential rally back to the $3,420–$3,440 resistance area.
If this zone breaks with high volume, price could target the major supply zone near $3,465+, where we’ll need “Needed Volume” for a decisive break.
⚠️ Scenario 2 – Bearish Breakdown (Alternative View):
If the curve support and SR zone fail to hold:
Expect a drop towards $3,345 – $3,320 — where next structural support lies.
This would suggest a deeper retracement or range formation before bulls can regroup.
🧩 Strategy & Psychology:
“We want bullish pattern here.”
You’ve highlighted the importance of not entering impulsively. This is about trading with confirmation, not prediction. Waiting for a valid bullish pattern reduces risk and increases probability.
This is where smart traders win — waiting patiently for confirmation at a zone of confluence.
🧠 Learning Mindset – Why This Zone Matters:
Combines horizontal support, curved trendline, and broken structure retest.
This zone is the battleground between bulls and bears — whoever wins here will likely control short-term momentum.
Newer traders can study this as a classic example of multi-confluence trading, which combines price action, market structure, and dynamic trendlines.
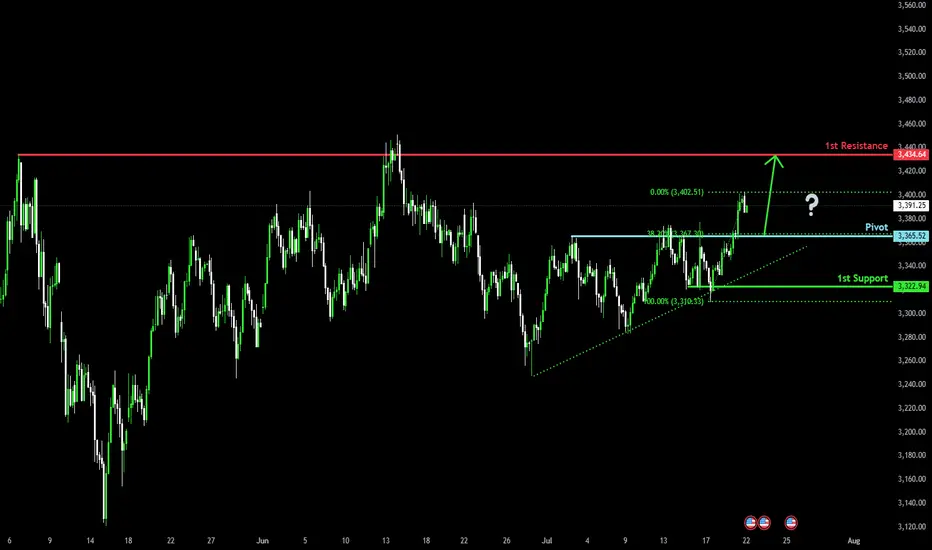
Falling towards pullback support?The Gold (XAU/USD) is falling towards the pivot which has been identified as a pullback support and could bounce to the 1st resistance.
Pivot: 3,365.52
1st Support: 3,322.94
1st Resistance: 3,434.64
Risk Warning:
Trading Forex and CFDs carries a high level of risk to your capital and you should only trade with money you can afford to lose. Trading Forex and CFDs may not be suitable for all investors, so please ensure that you fully understand the risks involved and seek independent advice if necessary.
Disclaimer:
The above opinions given constitute general market commentary, and do not constitute the opinion or advice of IC Markets or any form of personal or investment advice.
Any opinions, news, research, analyses, prices, other information, or links to third-party sites contained on this website are provided on an "as-is" basis, are intended only to be informative, is not an advice nor a recommendation, nor research, or a record of our trading prices, or an offer of, or solicitation for a transaction in any financial instrument and thus should not be treated as such. The information provided does not involve any specific investment objectives, financial situation and needs of any specific person who may receive it. Please be aware, that past performance is not a reliable indicator of future performance and/or results. Past Performance or Forward-looking scenarios based upon the reasonable beliefs of the third-party provider are not a guarantee of future performance. Actual results may differ materially from those anticipated in forward-looking or past performance statements. IC Markets makes no representation or warranty and assumes no liability as to the accuracy or completeness of the information provided, nor any loss arising from any investment based on a recommendation, forecast or any information supplied by any third-party.
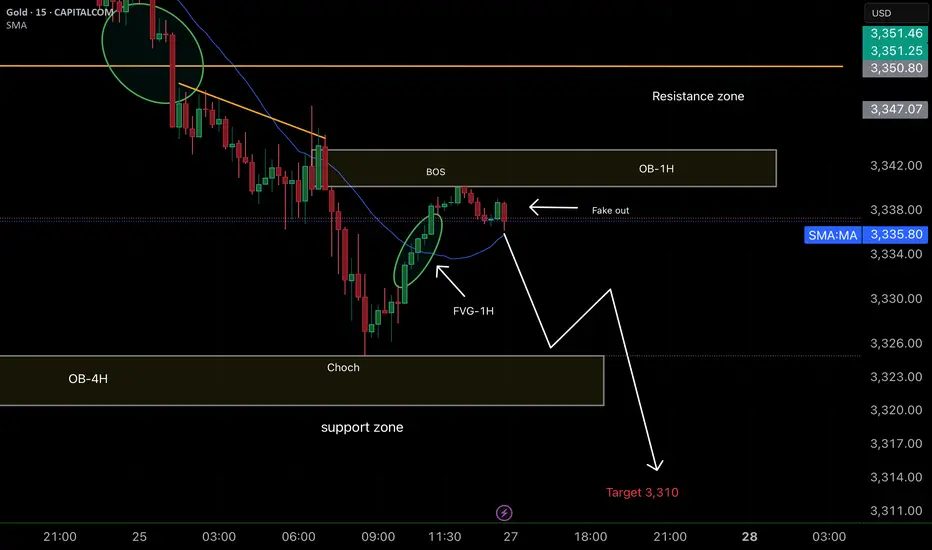
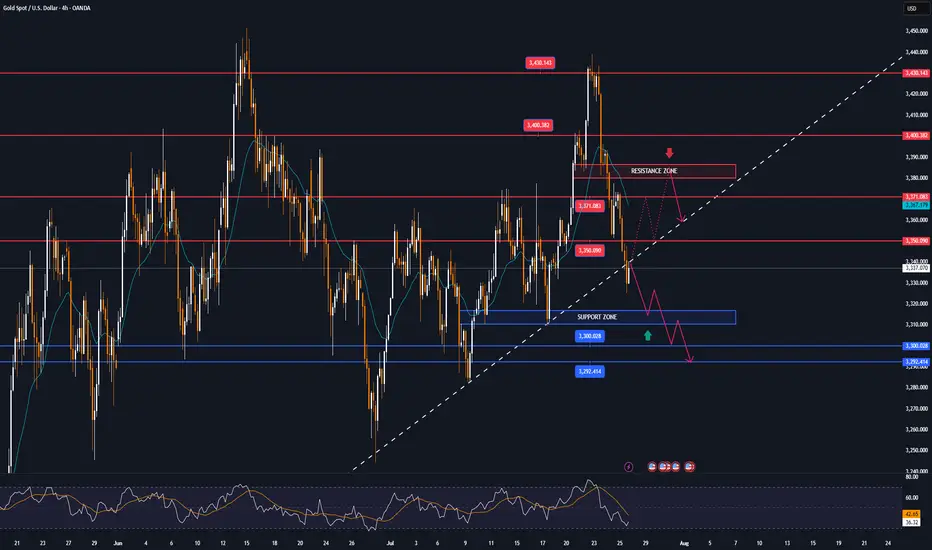
Smart Money concepts (SMC) Positive points of the analysis:
1. Clarity in the market structure (CHoCH + BOS):
It is clear that the market made a CHoCH and then confirmed it with a Break of Structure (BOS), which validates the downward trend change.
2. Well-identified fake out:
The "fake out" just after the BOS and within the 1H-OB is typical institutional behavior. This bullish wick is a trap to induce liquidity before the fall. Excellent reading.
3. Confluence zone (1H-OB + 1H-FVG):
The price rises to mitigate the 1H-FVG within the 1H-OB, providing a very good entry opportunity.
Furthermore, this occurs within the resistance zone, which gives it even more weight.
4. Support zone and target at 3310:
The TP is very well projected at 3310, just below the current support zone. If it breaks that zone, it is highly likely that it will reach the target.
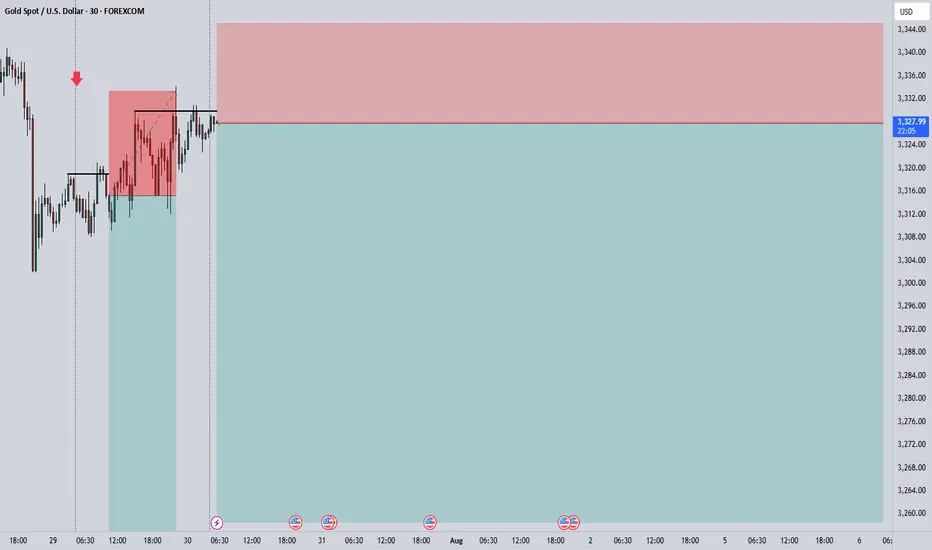
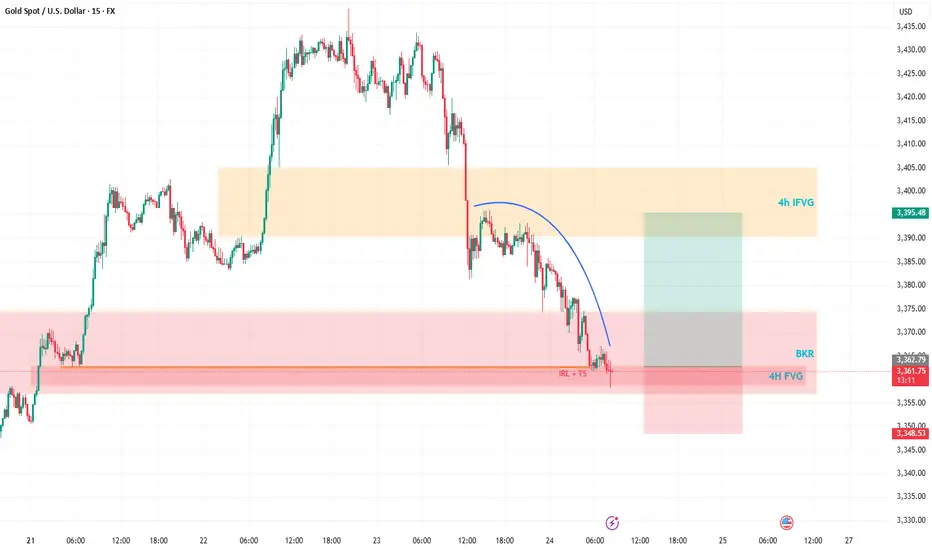
Gold’s Wild Ride: A Trader’s Take on What’s NextHey Fellow Traders! 👋
Gold’s been an absolute beast this week, smashing through both buyers and sellers like it’s playing a high-stakes game of market whack-a-mole! 😅 After Wednesday’s wild moves and today’s follow-up, Gold’s keeping us all guessing.
Right now, I’m not locking in a long-term bias—Gold’s too unpredictable for that. But here’s the exciting part: I’m eyeing a short-term long opportunity. Why? The price just dipped into a 4H Fair Value Gap (FVG) and tagged a Breaker, setting up a potential bounce. 📈
My plan? I’m expecting Gold to sweep up the highlighted liquidity and charge toward the 4H Inversion Fair Value Gap (IFVG). Once it hits that zone, I’ll be glued to the charts, watching for its reaction to decide the next move. 🧐
As always, trade smart! Set your stops, size your positions wisely, and don’t let Gold’s volatility catch you off guard. Protect your capital first—always! 💡
What’s your take on Gold right now? Are you jumping on this setup or waiting for more confirmation? Drop your thoughts in the comments below, give this post a like, and follow for more updates! 👇 Let’s keep the trading convo going! 🔥
GOLD Bearish Breakout!
HI,Traders !
#GOLD is trading in a strong
Downtrend and the pair
Broke the key horizontal
Level around 3318.97 which
Reinforces our bearish
Bias and we will be
Expecting a further
Bearish move down !
Comment and subscribe to help us grow !

Gold short-term bearish
From the Bollinger daily line, as shown in the figure below, the gold price should still test the lower track of $3,280 in the future. The short-term upward trend line has also been broken, and this yellow line has now become a pressure.
From the moving average system, the daily line is chaotic, and the gold price goes up and down without order and rules to cross the moving average, so the daily moving average system has no reference significance. From the weekly line, the gold price has the need to step back on the 20-week moving average of $3,277 to $3,280.
So, if I look at the bearish, I can only see $3,277 to $3,280. No deeper decline can be seen, and no more signals appear. Therefore, shorting is relatively short. Or it is short within the daily Bollinger track, not structural short or trend short. Everything has a law, just oscillation.
So, I think that even if there is a short in the future, it is the end of the short. It is the right way to stop when you see good results. Even though the current gold price has fallen due to the short-term positive tariff negotiations between Trump, Japan and the European Union, the tariff level is still much higher than before, which will undoubtedly bring more uncertainty to future economic growth. Many other factors are not conducive to a sharp drop in gold prices. The overall situation is that the basic trend of gold price increases is intact.
Therefore, the high point of $3345.30 has become the watershed between long and short positions. You can use this as the dividing line for long and short operations. There is nothing wrong with setting a loss above $3345.30 to short in batches. There is nothing wrong with placing a long position at 3346. The market trend is very uncertain, so it all depends on what order you want to make.

Still a chance for gold bulls?
💡Message Strategy
The gold market was volatile this week, and gold prices ultimately closed lower for the week.
Gold prices have failed to stabilize above $3,400 an ounce after a bullish breakout. The technical outlook highlights the recent indecision of gold bulls. Looking ahead to next week, the Fed's policy statement and US-China trade talks could trigger the next big move for gold.
These important factors may trigger the market next week
1. The Fed will announce its monetary policy decision after its policy meeting on July 29-30.
Before the Fed meeting, the U.S. Bureau of Economic Analysis will release its first estimate of annualized growth in gross domestic product (GDP) in the second quarter.
2. Next Friday, the U.S. Bureau of Labor Statistics will release the July employment report.
If the non-farm payrolls (NFP) increase by more than 100,000, it may indicate that the labor market is in good enough condition for the Fed to prioritize controlling inflation and support the dollar when making policies.
If the new non-farm payrolls data reaches or falls below 70,000, the dollar may find it difficult to find demand before the end of next week and help gold gain bullish momentum.
3. Market participants will be closely watching the headlines of the US-China negotiations.
If the two sides make further progress in trade and economic relations, risk flows may dominate the actions of financial markets, making it difficult for gold to find demand.
📊Technical aspects
The short-term technical outlook highlights the hesitation among gold buyers. The daily chart shows that the relative strength index (RSI) remains just below 50, and gold is struggling to move away from both the 20-day simple moving average (SMA) and the 50-day SMA after breaking above both levels earlier this week.
If the price of gold falls to the key support level of $3,310 and fails to break down (trend line support/Fibonacci 61.8% retracement level), it will force a large number of shorts to exit the market and may further test the $3,340 range (psychological level/Fibonacci 76.4% retracement level).
Combined with the current trend, the downward momentum of gold has weakened, and it is seeking support to restart the long position
💰Strategy Package
Long Position:3310-3320,SL:3290,Target: 3340

Gold under pressure as USD strengthensGold is facing significant selling pressure as the US dollar regains momentum. Currently, XAU/USD is trading near $3,337, down over $31 from the session high, and pressing directly against the ascending trendline.
The stronger USD is making gold—an asset that yields no interest—less attractive to investors. If this dollar strength continues, the likelihood of a trendline break and further downside is very high.
On the economic front, U.S. jobless claims have fallen to their lowest level in three months, signaling a resilient labor market despite sluggish hiring. This stable jobs data is expected to support the Fed’s decision to hold interest rates steady at 4.25–4.50% in the upcoming policy meeting, even amid rising inflation pressure driven by President Donald Trump’s tariff policies.
At this moment, sellers are in control. Traders should closely watch upcoming support zones and trading volume to spot reasonable entry points.
Good luck!

Correction in Play, Long-Term BUY Opportunity Ahead XAUUSD 24/07 – Correction in Play, Long-Term BUY Opportunity Ahead
🧭 Market Outlook
Gold has dropped sharply from the 343x region, exactly as outlined in yesterday’s plan. Price has broken below the ascending trendline on the H1 chart and is now tapping into lower liquidity zones (FVG + OBS), signaling continuation of the short-term bearish move.
Key context to watch:
Traders are awaiting final decisions on US global trade policy agreements.
Next week’s FOMC meeting may confirm expectations of an interest rate cut.
Later today, markets will react to US PMI data and Jobless Claims, which could trigger volatility.
📊 Technical View
While the higher timeframe trend (D1/H4) remains bullish, the short-term structure has broken, and the market is now exploring unfilled liquidity pools below. Once these are swept, we anticipate a strong long-term BUY opportunity.
🎯 Trading Plan for Today
📌 Short-Term Strategy:
Look for short-term SELL setups on retracements toward resistance zones. Wait for clear rejection signals before entering.
📌 Mid/Long-Term Strategy:
Prepare to BUY from major Key Levels once price taps into deep liquidity zones. Ensure confluence and good risk/reward before entering.
🔎 Key Levels to Watch
🔺 Upper Resistance Zones:
3393 – 3404 – 3414 – 3420 – 3428
🔻 Lower Support Zones:
3375 – 3366 – 3352 – 3345 – 3330
🔽 Trade Setups
✅ BUY ZONE: 3352 – 3350
SL: 3345
TP: 3356 → 3360 → 3364 → 3370 → 3375 → 3380 → 3390 → 3400
🔻 SELL ZONE: 3414 – 3416
SL: 3420
TP: 3410 → 3406 → 3400 → 3395 → 3390 → 3380
⚠️ Risk Reminder
No major economic news is scheduled for today, but unexpected political statements or geopolitical tensions could cause price spikes.
✔️ Always follow your SL/TP strictly.
✔️ Avoid entering without solid confirmation.
✔️ Watch how price reacts to the levels above.
📣 Follow MMF on TradingView
If this trading roadmap helps your strategy,
📌 Follow the MMF team on TradingView for daily actionable setups, real levels, and no-nonsense analysis based on real market conditions.
🎯 Real trades. Real zones. Real discipline.

XAUUSD M30 BEST BUYING ZONE 📈 Gold is in a strong buying trend!
As always, I follow the trend — and right now, the trend is bullish. Here's what to look for:
✅ Strong Buying Zone
Look to buy if you see a solid bullish candlestick confirmation in this area.
📍 Alternative Entry Point
If price sweeps below 3416, we’ll look for a potential buy opportunity there — but again, only with candlestick confirmation.
🔓 Open Your Layers
Be prepared for both setups. Follow the market reaction and adapt accordingly.
⚠️ Risk Management is Key
No matter how strong the trend looks, always stick to your risk management rules. Discipline protects profits! 💼
🚀 Let’s ride the trend and stay smart!

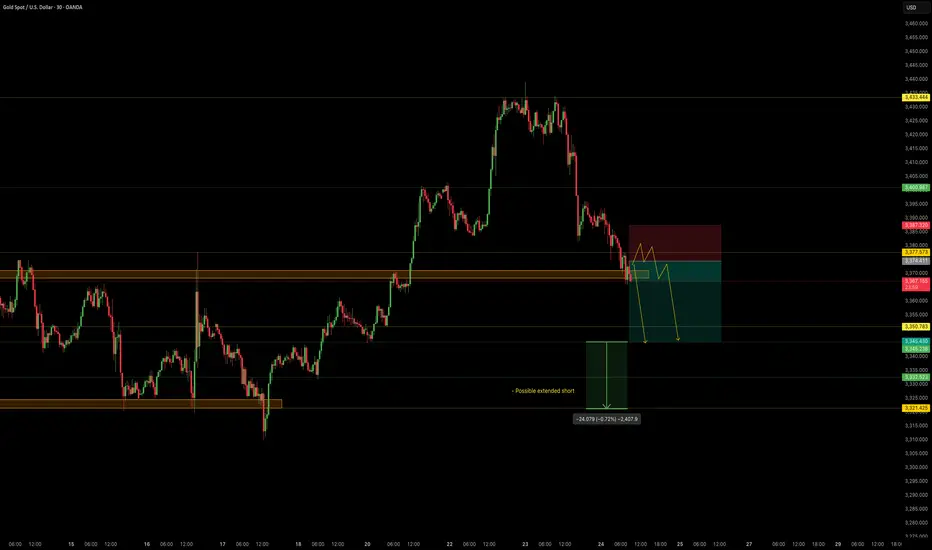
NordKern - XAUUSD InsightNordKern | Simplified Insight OANDA:XAUUSD – Short Opportunity Ahead
Gold is now near our important level at 3370, offering a shorting opportunity considering recent events and technical action.
Gold Price Decline – What's Behind It?
In the last two sessions (July 23–24), gold has retreated strongly owing to a set of global as well as market-specific circumstances:
1. Trade Deal Optimism
Advances in U.S.–Japan and U.S.–EU trade discussions lessened worldwide uncertainty, decreasing demand for gold as a safe-haven.
2. Higher U.S. Yields
Higher Treasury yields are rendering non-yielding assets such as gold less appealing, adding to downward pressure.
3. Technical & Profit-Taking
Following a recent rally, gold was exposed to selling. Stop-loss and profit-taking triggers hastened the fall.
Summary of Key Drivers
U.S. Trade Deals: Reduced geopolitical risk
Higher Treasury Yields: Decreased gold's relative attractiveness
Technical Selling: Enhanced the downward trend
Trade Setup – Bearish Bias
Entry : 3374.4
Stop Loss : 3387.3
Take Profit : 3345.4
Extended Target : 3322
Key Notes:
- Trade Deal Optimism: U.S.–Japan and U.S.–EU agreements eased global tensions, reducing demand for gold as a safe-haven asset.
- Yield Pressure: Rising U.S. Treasury yields made gold less attractive compared to interest-bearing alternatives.
- Technical Selling: Profit-taking and stop-loss triggers accelerated the decline after gold’s recent rally.
This setup remains tactically driven. Manage risk carefully and monitor for any renewed political shifts.
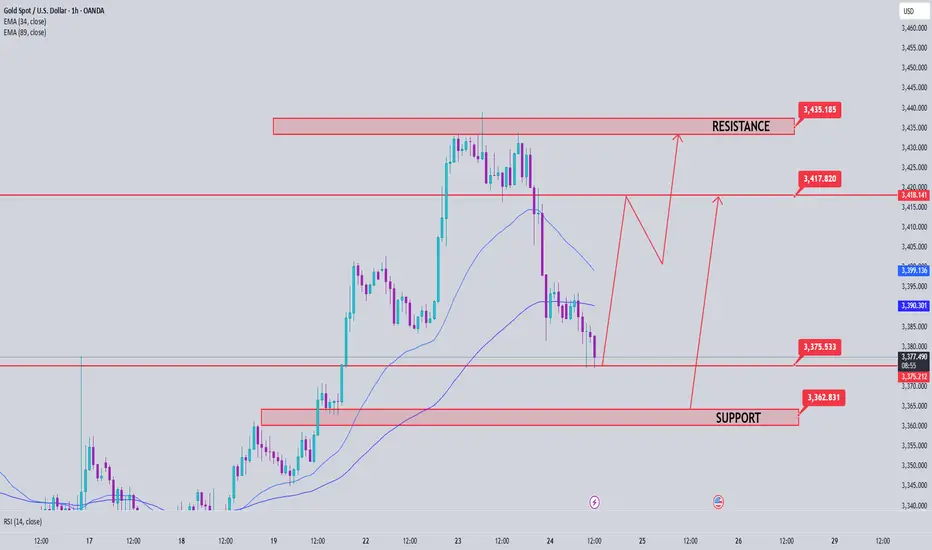
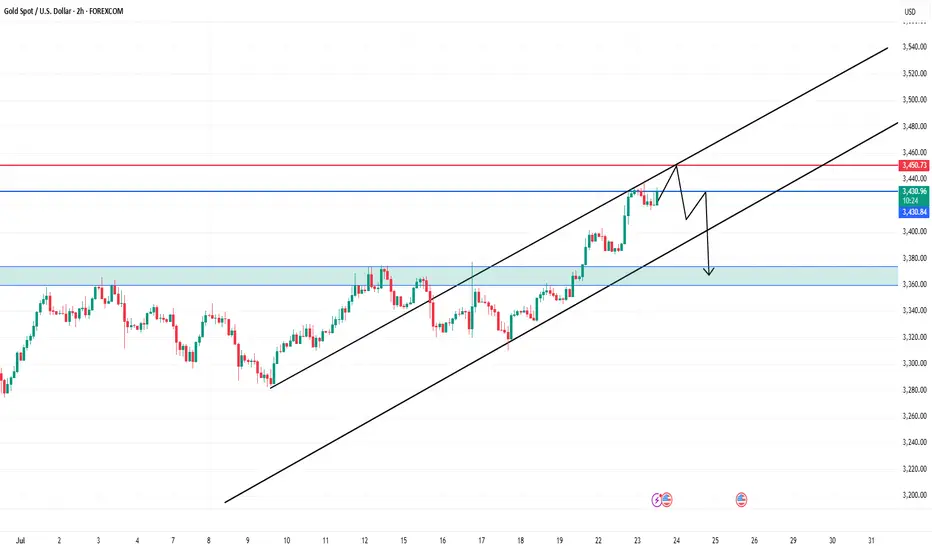
Gold at Key Resistance – Bearish Pullback Ahead?Technical Analysis (2H Chart)
1. Trend Structure:
Price is moving in a clear ascending channel (black trend lines).
Currently testing the upper boundary of the channel, which may act as resistance.
2. Resistance Zones:
$3,431–$3,450: Strong resistance zone.
Horizontal resistance at $3,450.73 (marked in red).
Price may form a lower high before reversal, as the black arrow suggests.
3. Support Zones:
$3,374 – $3,360: Previous structure and demand zone (highlighted green).
Strong potential bounce zone if price drops.
4. Price Action Expectation:
Possible fakeout or retest near $3,450 → followed by a rejection and drop toward the $3,360 area.
Bearish bias indicated by the projected path.
GOLD SENDS CLEAR BEARISH SIGNALS|SHORT
GOLD SIGNAL
Trade Direction: short
Entry Level: 3,336.48
Target Level: 3,254.95
Stop Loss: 3,390.83
RISK PROFILE
Risk level: medium
Suggested risk: 1%
Timeframe: 1D
Disclosure: I am part of Trade Nation's Influencer program and receive a monthly fee for using their TradingView charts in my analysis.
✅LIKE AND COMMENT MY IDEAS✅

GOLD MARKET ANALYSIS AND COMMENTARY - [Jul 28 - Aug 01]This week, OANDA:XAUUSD prices had a positive start, rising sharply from 3,345 USD/oz to 3,439 USD/oz because investors were concerned about the risk of financial market instability when US President Donald Trump continuously pressured the FED Chairman to reduce interest rates, and there were even rumors of the Fed chairman resigning.
However, the upward momentum in gold prices was not maintained when the US continuously reached trade agreements with partners such as Japan, Indonesia, Philippines..., cooling down the trade war. This caused gold prices to drop sharply for three consecutive trading sessions, at one point the gold price dropped to 3,325 USD/oz and closed at 3,336 USD/oz.
Trade war worries are starting to subside. Therefore, we continue to witness a shift of investment capital flows from gold to risky assets such as stocks..
Notably, this week is the fourth time gold prices broke the $3,400 threshold but did not stay above this level.
Next week, in addition to the FED meeting, the market will also receive information about US non-agricultural employment (NFP) data. If this index falls stronger than expected, it will further strengthen expectations that the FED will continue to keep interest rates at the current level in upcoming meetings, causing gold prices to drop even more sharply next week.
📌In terms of technical analysis, the three crows pattern (3 long red candles) appeared on the D1 chart, showing that sellers were still in control throughout the past 3 trading sessions without much buying power. This technical pattern often suggests that gold prices may be shifting from their recent upward trajectory into a more prolonged period of decline. This technical signal also quite coincides with the context of many fundamental factors, such as geopolitical conflicts, trade wars, low physical gold demand in the summer... no longer strongly supporting gold prices as before. However, according to many experts, if the gold price drops sharply, it will be a good opportunity to buy, because the gold price is forecast to still increase strongly in the long term.
On the H4 chart, gold price may continue to adjust down below the 3,285 USD/oz mark, before recovering again. Meanwhile, the 3,450 USD/oz area is still a strong resistance level for gold prices next week.
Notable technical levels are listed below.
Support: 3,310 – 3,300 – 3,292USD
Resistance: 3,350 – 3,371 – 3,400 – 3,430USD
SELL XAUUSD PRICE 3383 - 3381⚡️
↠↠ Stop Loss 3387
BUY XAUUSD PRICE 3316 - 3318⚡️
↠↠ Stop Loss 3312
GOLD continues to correct down, good news from trade situationOANDA:XAUUSD has fallen sharply again, currently trading around $3,360/oz, reflecting the easing of global trade tensions, affecting demand for safe-haven assets. The US Dollar and US Treasury yields have also increased, affecting gold prices.
The US Dollar Index ( TVC:DXY ), which tracks the greenback against six other currencies, rose to 97.56.
The yield on the 10-year US Treasury note US10Y rose to 4.386%. The US real yield, calculated by subtracting inflation expectations from nominal interest rates, rose nearly 3.5 basis points to 2.046%.
Markets are increasingly optimistic about such deals after the United States and Japan reached a trade deal, and the European Union could be next. In addition, rising stock markets and low volatility have kept gold's gains in check.
The United States and the European Union are moving toward a potential trade deal that would include a 15% tariff on EU goods and zero tariffs on some items.
The European Commission said Thursday that a negotiated trade solution with the United States is within reach.
“Our focus is on reaching a negotiated outcome with the United States,” a European Commission spokesperson told reporters about the EU-U.S. tariff talks. “We believe that such an outcome is achievable.” The European Commission has repeatedly said that its current priority is to reach a deal with the United States to avoid the 30% tariffs that U.S. President Trump has proposed to impose on EU products starting August 1.
On the economic data front, initial jobless claims in the United States unexpectedly fell last week, suggesting the job market remains solid.
The U.S. Bureau of Labor Statistics reported on Thursday that initial jobless claims fell to 217,000 in the week ended July 19, below expectations of 227,000 and down from 221,000 the previous week.
Technical Outlook Analysis OANDA:XAUUSD
Gold is heading for its third consecutive day of decline since hitting the bullish target level sent to readers in the weekly edition on Sunday at $3,430.
Despite the sharp decline, gold still has enough technical conditions for an uptrend given its current position and structure.
Specifically, gold is still above the EMA21, which is considered the nearest support at the moment. Along with that, the uptrend price channel is the short-term trend. However, for gold to qualify for a short-term bullish cycle, it needs to be confirmed by price action above the 0.236% Fibonacci retracement level, then the target is $3,400 in the short term, more than $3,430.
On the other hand, RSI is still holding above 50, and 50 in this case acts as momentum support. Therefore, gold still has room to rise.
In case gold is sold below EMA21, it may suffer a further decline with the next target around $3,310 in the short term, more than $3,300 and the 0.382% Fibonacci retracement level. And if gold loses the support at the 0.382% Fibonacci level, it will qualify for a bearish cycle.
Intraday, the current position of gold price is still tilted towards the upside, and the notable price points will be listed as follows.
Support: $3,350 – $3,310 – $3,300
Resistance: $3,371 – $3,400 – $3,430
SELL XAUUSD PRICE 3406 - 3404⚡️
↠↠ Stop Loss 3410
→Take Profit 1 3398
↨
→Take Profit 2 3392
BUY XAUUSD PRICE 3329 - 3331⚡️
↠↠ Stop Loss 3326
→Take Profit 1 3337
↨
→Take Profit 2 3343

Gold dips on profit-taking, long-term outlook still bullishGold prices continued to decline this morning as investors locked in profits following the precious metal’s recent rally above $3,400.
In the short term, further downside is possible if profit-taking persists and capital flows shift toward equities, especially as U.S. stock markets hover near record highs. However, gold remains a favored safe-haven asset for the long run amid ongoing global economic and geopolitical uncertainties.
Markets are also turning their focus to the upcoming Federal Reserve policy meeting on July 29–30. While the Fed is expected to hold interest rates steady this time, many investors still anticipate a potential rate cut in September. A low interest rate environment typically supports non-yielding assets like gold.
