COOChI expect XAUUSD to sell beyond 100 pips after the impulse correction which retested a resistance key level.
XAUUSDG trade ideas
MACRO CONTEXT & NEWS FLOW IMPACT — "WHY THE HELL IT MOVED"🔥 I. MACRO CONTEXT & NEWS FLOW IMPACT — "WHY THE HELL IT MOVED"
Yesterday’s move was a classic institutional fakeout followed by controlled accumulation. Today is retest day. Watch VWAP and order flow like a hawk. Don’t chase, wait for reversion and load at value.
📅 Date: July 30, 2025
📰 Event:
US Employment Cost Index: Lower than expected
Core PCE: Cooled off
Market Implication: Fed easing is now on the table.
DXY Weakens → Real yields drop → Gold gets bought like crazy.
👊 Institutional Logic:
Rate-sensitive assets (Gold, Bonds) exploded after the release.
Algorithmic reaction to macro signal: DXY down → XAU bid hard → MegaBar explosion.
BUT institutions needed liquidity to enter big → they faked a breakdown first.
That’s institutional deception 101.
📉 II. DAILY CHART ANALYSIS — THE BIG BOYS' GAMEBOARD
🗺️ Structure:
Price dropped from 3,355 to 3,258 in 3 days — a high-velocity markdown.
On July 30, Price printed a Megabar reversal (Massive range, delta-flush, volume spike).
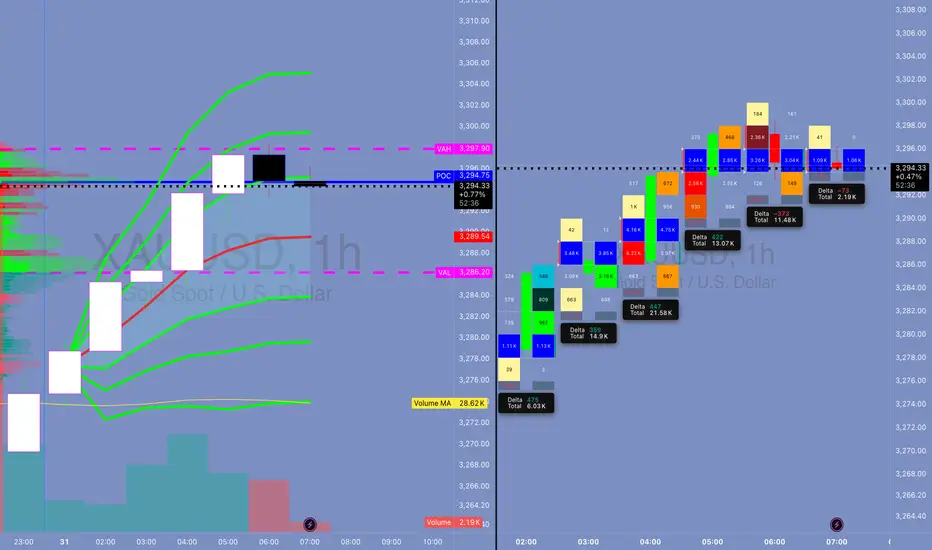
VAH = 3,294.90 capped upside.
POC = 3,288.91, and VAL = 3,282.90 held beautifully.
🔍 Institutional Pattern:
This is a classic “Flush > Absorb > Mark-up” sequence.
Textbook from “Technical Analysis and Stock Market Profits”:
“Volume confirms intention, range confirms commitment. A wide bar with climax volume at low implies the exhaustion of sellers and transfer of ownership.”
🔑 Key Daily Stats:
📉 Delta Flush: -584K
🔁 Reversal Delta: +70K
🔊 Volume spike: >450K (Well above 30-day volume MA)
💡 Inference:
This bar did not print because of retail buying. It’s smart money rebuying from panic sellers.
⏱️ III. 4H / 1H TIMEFRAME: ORDERFLOW & REACCUMULATION
📌 4H Chart:
📍 Megabar with -191K delta near 3,258 (Volume: 191.14K)
Immediate absorption by dark blue and green delta bars — this was not retail reversal.
VWAP reversion in play — price gravitates toward 3,294 (VWAP anchor zone)
🔁 1H Chart:
Rapid stair-stepping: Each hourly candle had higher lows and strong deltas.
Volume built from super-POC 3,289 to super-VWAP 3,295.25.
Final hour: exhaustion wick → distribution into resistance.
🧠 Institutional Tactic:
They used Volume by Price congestion to hold price between FVRP bounds:
Low Volume Nodes (LVNs) = acceleration zones
High Volume Nodes (HVNs) = consolidation + absorption zones
🔍 IV. 15M / MICROSTRUCTURE — WHERE THE GAME WAS REALLY PLAYED
🔬 VWAP Stack Analysis:
VWAP: 3,294.61
D-VWAP: 3,289.30
Super-VWAP Cluster held price in check — real institutional price magnet.
🔄 Delta Flow (15m):
Delta climbed from -3.15K → +3.21K in 1.5 hours.
Imbalance flipped bullish near POC.
🎯 FPVR Mapping (Volume Profile Right Side):
Thickest distribution volume occurred at 3,287 – 3,295
Value tightly packed = fair price.
Institutions are loading in value, not chasing.
⚙️ V. INDICATOR & MOMENTUM SIGNALS — INSTITUTIONAL CONFLUENCE ZONES
Tool Signal
VWAP Anchored VWAP tagged and respected — classic institution level
SMA50 Capped daily move (3,342) — still a long-term bearish lid
HMA5/9 Bullish crossover on 15m/1H – signals momentum alignment
Volume MA Volume climax confirms effort at lows, signaling phase change
🔩 VI. TECHNICAL SEQUENCING OF EVENTS (STEP BY STEP)
Asia Session: Tight range, price floats around VAL (3,282)
London Session: Fake breakdown to 3,258 – traps late shorts
NY Pre-News: Choppy price action within FRVP range
Macro News Drop: Megabar → -191K delta flush
Next Candle: Delta flips +21.2K → Absorption confirmed
Price Walks Up: Controlled bid to VWAP
End of Day: Distribution at VAH → price capped by VWAP band
💣 Final move = algorithmic mean reversion + VWAP auction completion
🧬 VII. ADVANCED ORDERFLOW INTERPRETATION
⚔️ MEGABAR (The Trap Setup):
Volume = 191K+
Delta = -191K (yep, full-on flush)
What happened?
→ Late shorts + stop runs + SL hunters got rekt.
→ Institutions absorbed, switched algo, and reversed.
🧱 FVRP (Fair Value Range Profile):
Defined by VAL (3,282.90) and VAH (3,294.90)
Institutions play inside this range for risk efficiency
They accumulate low and distribute high within it
🔄 Delta Rotation:
Delta Rotation = Shift from Negative Accumulation → Positive Distribution
Classic rotation confirms phase transition
🧠 VIII. INSTITUTIONAL OBJECTIVE (WHAT THEY WANTED)
Primary Goal: Create liquidity void below → Enter large long positions
Secondary Goal: Return to VWAP zone and unload
Tertiary Goal: Signal to market: "We're in control, stay out or get punished"
This is textbook Volume Profile Auction Theory in motion.
🎯 IX. HYPOTHETICAL TRADE SETUP (EDUCATIONAL PURPOSE ONLY)
🧾 Trade Plan: Institutional VWAP Reversion Play
Order Type: Buy Limit
Entry: 3,287.00
Stop Loss: 3,279.00 (below VAL & invalidation)
Take Profit: 3,300.00 (Super-VAH zone)
Confidence: 85%
R/R: 1:1.6
💡 Justification:
Entry at POC + SMA50 cluster
Stop below structural invalidation zone
Target near major supply
This is the exact playbooks funds run during reaccumulation rotations
🧠 X. EDUCATIONAL TAKEAWAY — WHAT YOU SHOULD LEARN
Volume is truth. If volume spikes at lows, it’s not weak hands — it’s smart money flipping.
VWAP is magnet. Everything mean-reverts back to VWAP in controlled auctions.
Delta tracks aggression. Sharp delta reversals = algorithm switch.
Megabar = signal. Huge candle + volume + delta = possible phase shift.
FRVP = roadmap. Price doesn’t move randomly — it moves to balance imbalances.
🔚 CONCLUSION — YESTERDAY’S LESSON
July 30, 2025 wasn’t just a bullish day — it was a textbook institutional deception-reversion cycle. If you understand:
How the news was used
How the megabar printed
How the volume clustered
How the VWAP held
… then you’re not trading blindly.
You’re trading with the damn architects of the market.
Has gold bottomed out on July 30?
Key Influencing Factors
Negative Factors:
A stronger US dollar: A rebound in the US dollar index is suppressing gold prices.
Recovering risk appetite: Market demand for safe-haven assets is weakening.
Rising real interest rates: Expectations of Fed policy are impacting the cost of holding gold.
US-EU trade agreement: Easing geopolitical tensions will weaken gold's safe-haven appeal.
Potentially bullish variables:
Federal Reserve policy signals: A dovish statement on Wednesday could boost gold prices.
Geopolitical risks: Uncertainties such as the Sino-US trade negotiations and the situation in the Middle East remain.
Technical Analysis
Trend Analysis:
Short-term weakness (four consecutive negative daily candlestick patterns), but the broader bullish trend remains.
Key support level: 3300-3285 (falling below or falling to 3250); resistance level: 3330-3345 (breaking through may end the pullback).
Key Levels:
Downward Support: 3310-3300 (short-term), 3285 (strong support). Upper resistance: 3335-3345 (trend reversal expected after a breakout).
Trading Strategy
Short-term Trading:
Long positions primarily at low levels: Try a light buy position in the 3300-3310 area, with a stop-loss below 3285 and a target of 3330-3345.
Short selling at high levels is auxiliary: If it rebounds to 3335-3345 and is under pressure, you can short sell with a stop loss above 3350 and a target of 3310-3300.
Follow up on the breakout: If it breaks through 3345 strongly, you can chase long positions; if it falls below 3285, be wary of a rebound after a false break.
Medium- to Long-term Strategy:
Watch for potential bottoming opportunities near 3285. If it stabilizes, place long positions in batches, betting on dovish signals from the Federal Reserve or escalating geopolitical risks.
Risk Warning: Data-sensitive period: This week's Federal Reserve decision and economic data may trigger significant volatility, so position management is crucial. US Dollar Trends: The US dollar and gold prices show a significant negative correlation, so the US Dollar Index should be monitored closely.
Risk of false break: There may be a trap below 3300, which needs to be confirmed in combination with the K-line pattern.
Summary: Gold is under short-term pressure, but the medium- to long-term bullish outlook remains unchanged. Focus on the effectiveness of support in the 3300-3285 area and the direction of the Federal Reserve's policy. We recommend a flexible approach, using key breakthroughs as a guide for directional analysis, and cautiously holding positions before data releases.
Gold long from 3242LOOKING FOR LONGS AT AROUND THAT REGION.
gold looks good .
Lets wait for this to unfold.

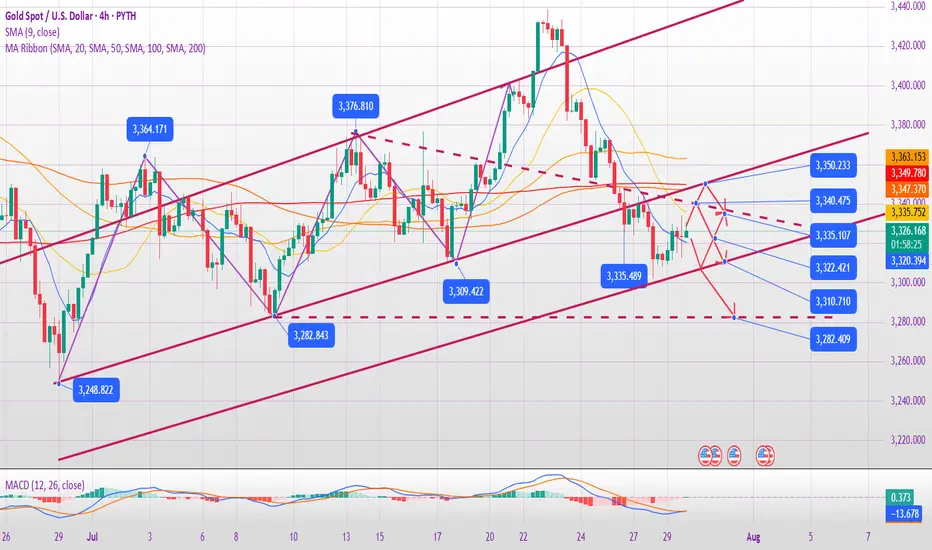
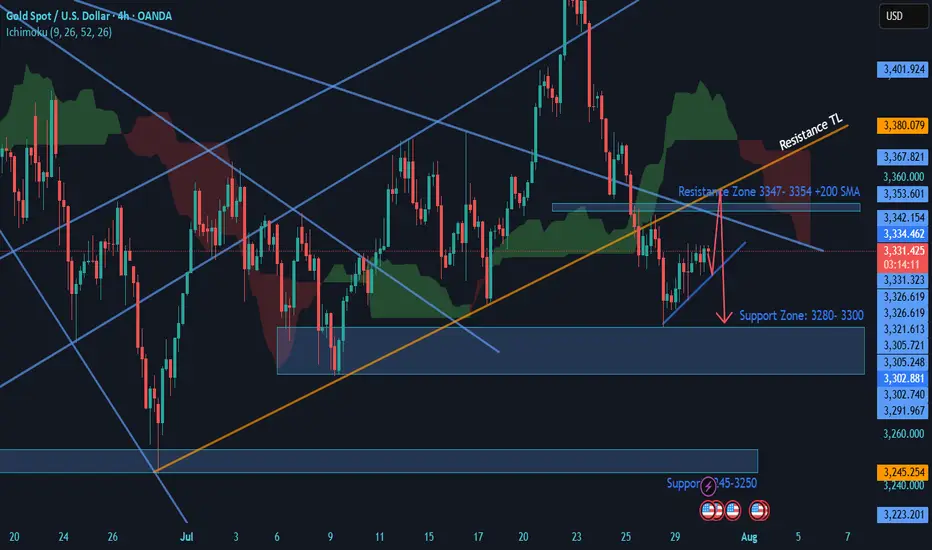
Gold holds Bearish Structure- SELLGold: Price is Exhibiting Head & Shoulders Strcure on 4H & 1 H chart. 4 H chart is Bearish, Daily chart is Neutral to bearish. Price is under the IChimuku Cloud in 4 H.
Daily chart is forming a death cross (20 SMA cutting 50 SMA) which might be completed in 1 day or Two.
Currently Gold is trying to recover losses and on retracement journey. I am expecting Price to test the 3347-3354 Zone of resistance where 4H 200+100 SMA + TL resistances+ Structure resistance will likely to Push price back to 3320 & 3300 Support Zone.
If price breaks the 3300 level. Then this daily candle break may take price to 3280 Support Level.
Good Luck
BUY GOLDStill buy oriented for now. Cont from prev post. Will take positions based on price fracturing

GOLD 1H 5AUGHello to all traders. 😎😎
I hope all your deals will hit their targets. 🎉🎉
I have identified two paths for gold for today.
In the red movement we have a downward fall and a fair value gap filling and a fall to the $3300 range
and in the black path we have a correction to the $3360 to $3365 range and then a rise to the $3395 to $3400 range.
In any case, I think we will have a correction at least to the $3365 range and then we can decide whether the market will fall or rise from that range.
⚠️⚠️⚠️⚠️Don’t forget to apply proper risk management!
What Do You Think?
Which scenario do you think is happen? **Share your thoughts!** ⬇️
Don't forget that this is just an analysis to give you an idea and trade with your own strategy. And don't forget the stop loss🛑🛑🛑
❤️❤️❤️The only friend you have in financial markets is your stop loss❤️❤️❤️
Please support me with your ✅' like'✅ and comments to motivate me to share more analysis with you and share your opinion about the possible trend of this chart with me 🙏😊
Be Happy , Ali Jamali

Technical indicators are bullish across the boardInfluenced by the NFP data, gold prices rose strongly, fully recovering last week's losses. The current gold market has broken the previous bull-bear equilibrium and remains in a strong upward trend. We are currently bullish but will not chase the rise. We will wait for gold to fall back and stabilize before trying to go long. Gold is currently in a sideways consolidation. If gold touches the upper short-term resistance of 3365-3370 again in the European session and encounters resistance and pressure, you can consider shorting with a light position and waiting for a pullback. If the gold price breaks up strongly, pay attention to the key suppression level above 3375-3385.
As the price of gold continues to rise, the support has moved up. Pay attention to the short-term support of 3345-3330 below. If it retreats and stabilizes, you can consider going long. Independent traders must strictly implement trading plans, and those who are not sure about the market must set stop-loss orders.
OANDA:XAUUSD

#XAUUSD chartGold (XAUUSD) is approaching a critical reversal resistance zone between $3,377–$3,398, after ranging between $3,338–$3,377. This level deserves close attention, as price could react sharply here.
We also have a strong FVG gap nearby, increasing the potential for a solid bounce and a profitable trade.
😵 The Strategy:
This is a moment for patience and precision. If confirmed, this setup could lead to a solid opportunity — but only with the right timing and discipline.

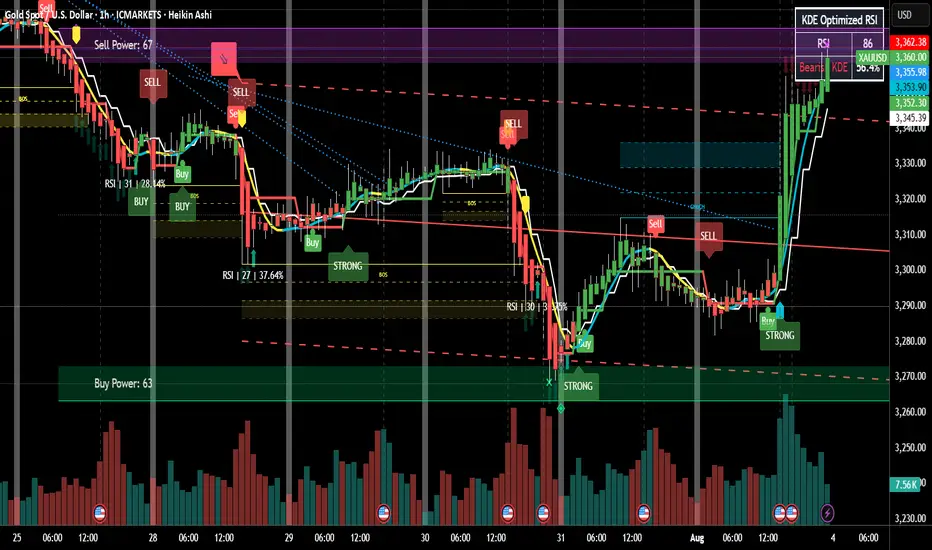
GOLD overheated, fall for the next two to three daysConsidering the following:
1. RSI @ 86
2. constitutional money kicked in crossing upper linear regression
3. price reached the resistance level
4. AND although the last candle was longer than the second last candle, the last volume was shorter than the second last volume line. (crucial for a reversal)
Will place order for a short @ USD3360, take 50% profit at USD3326, close @ USD3280.
Happy trading!
Gold ready to create new all time high!!!Buy: $3447.28
Set up: wait for a breakout and hidden bullish divergence on a weekly basis.
Sl: $3183.11
Gold Market Holds Bearish Structure Below 3291Gold market continues to hold firm within the bearish channel, with 3291 acting as a supply zone, maintaining pressure down toward 3269. As long as this zone remains unbroken, bearish momentum stays in play.
🔍 Key Insight:
3291 = active supply resistance
3269 = short-term target if sentiment holds
follow for more insights , comment and boost idea

NFP GOLD watch me break gold down give my thoughts on gold during NFP and what you should expect moving forward

XAUUSD: Buy ideaBuy idea on XAUUSD as you can see on the chart because we have the breakout with force the vwap indicator by a big green candle...

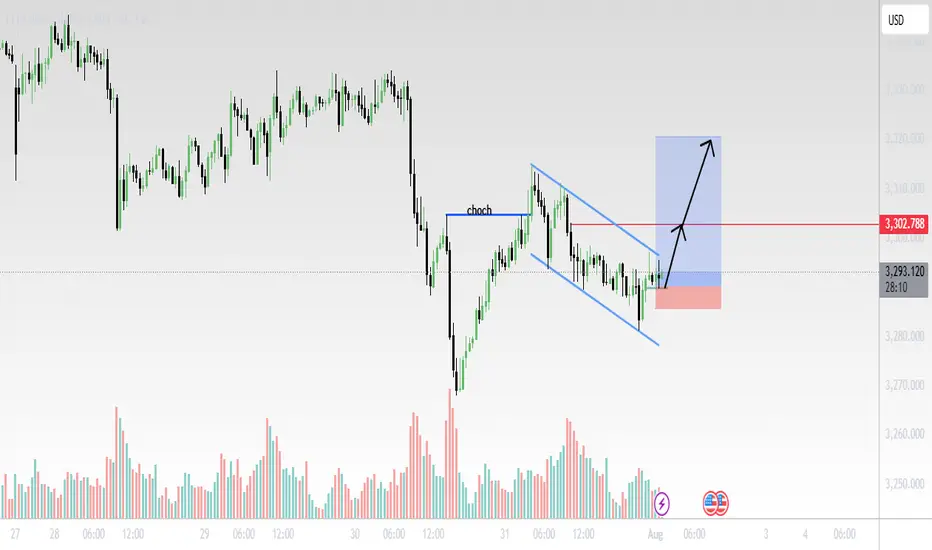
Gold (XAU/USD) 30-Min Chart Analysis – August 1, 2025Structure Summary:
CHoCH (Change of Character) confirmed after price broke the previous lower high, signaling a potential trend reversal.
Price has since formed a bullish falling wedge (blue trendlines), a classic continuation pattern after CHoCH.
Volume spikes during reversal attempts suggest accumulation.
Trade Setup:
Entry: Breakout above wedge resistance.
Stop Loss: Below recent swing low near 3280 area (red zone).
Target: Around 3315–3320 zone (blue box), aligned with previous demand-turned-supply area.
📌 Outlook:
Bullish breakout expected if momentum sustains.
Watch for confirmation candle with volume above the wedge.
Clean R:R setup with tight SL and wide TP potential.
📊 Technical Bias: Bullish
❗Risk Management: Adjust position size based on lot exposure and account size.
gold on buy retrace#XAUUSD price have reformed back above 3306, now we are expecting bullish from 3309 on 2 times breakout.
Entry 3309 2 times breakout, target 3326-3335, SL 3297.
Below 3297 holds bearish reversal, target 3270. 3317 will reject, H1 closure there will continue bullish.

Xauusd sell ideas Let's see how this goes on news release am expecting a retest of that zone as well entry

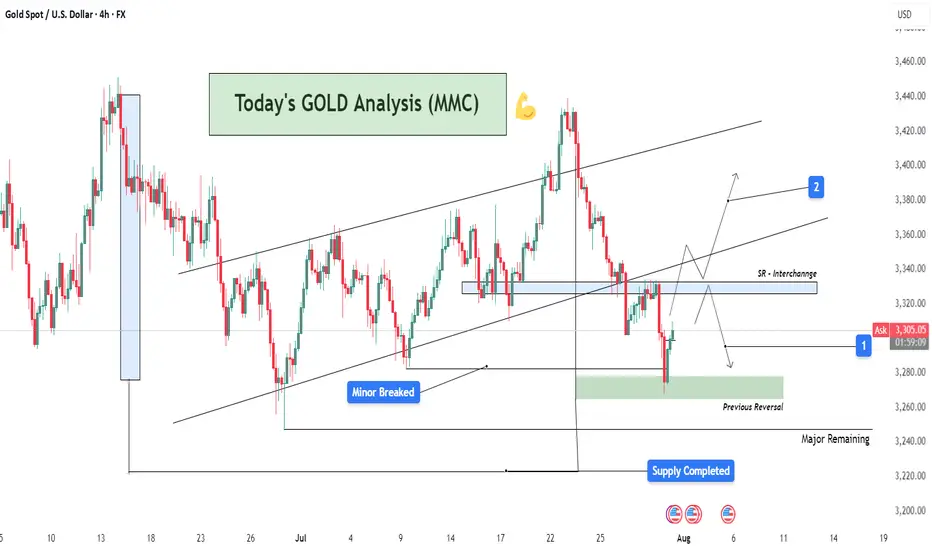
XAUUSD Analysis : Channel Break, Demand Zone + SR - Interchange"High-Probability Zone Reaction & SR Flip Confirmation"
Gold (XAUUSD) is currently reacting from a significant support zone after completing a bearish breakout from a well-established ascending channel. The market structure indicates both threat and opportunity depending on how price behaves around key levels ahead.
🔍 Structure Breakdown & Price Behavior:
🔹 1. Rising Channel Violation
Over the past few weeks, price was comfortably moving inside a well-respected ascending channel, making higher highs and higher lows.
Recently, however, price broke below the lower boundary, which is often a bearish signal—indicating a possible trend reversal or a deeper correction phase.
Such breakdowns suggest buyers are losing control, and bearish sentiment is gaining strength.
🔹 2. Supply Zone Reaction & Drop
Before the breakout, we observed a sharp rejection from a high point, triggering a sell-off.
The price completed its move into a previously defined supply zone, resulting in a strong bearish impulsive leg that pushed it outside the channel.
This move shows clear institutional distribution—where large sellers unloaded positions around that zone.
📍 Key Zone Focus:
🟩 Previous Reversal / Demand Zone (Green Box)
Price is now sitting in a historically strong demand zone, which acted as a major reversal point in the past.
This area is marked as the first zone of interest where buyers might step back in to defend.
The green box represents a liquidity pocket where institutions previously accumulated positions—hence it’s a strong bounce candidate.
🟦 SR Interchange Zone (Blue Box)
The next major level above current price is the SR Interchange zone, around 3,320–3,340.
This level was previously broken and now acts as resistance.
It's crucial because it represents the battle zone where the market will decide whether to continue bearish or shift back bullish.
🧠 Market Psychology & Order Flow Insight:
The recent aggressive selling pressure from the highs, followed by a bounce from the demand zone, shows a shift from euphoria to fear.
Sellers are active at supply, while buyers are attempting to defend the previous demand.
The market is currently in decision mode—and the SR flip zone (3,320–3,340) will be the judge.
A break and retest above this level signals strength and potential for a trend resumption.
A failure to reclaim it would confirm bearish dominance and open doors for deeper targets.
🔄 Possible Scenarios Ahead:
📈 Scenario 1 – Bullish Rejection & Breakout:
If buyers successfully hold the 3,280–3,260 demand zone and push price above the SR Interchange zone, we can expect:
📍 Target 1: 3,360 (mid-term resistance)
📍 Target 2: 3,400–3,420 (previous high & upper trendline)
This would confirm a fakeout from the channel and a bullish continuation pattern.
📉 Scenario 2 – Failure at Resistance & Drop Continuation:
If price fails to reclaim the interchange zone, expect a retest of the green demand, followed by a potential drop toward:
📍 3,260 – local support
📍 3,240 – major support (unfilled demand below)
📍 3,220–3,200 – ultimate downside target
This would solidify a bearish market structure, confirming the sellers are in control.
🧭 Key Levels To Watch:
Level Type Price Range Significance
Supply Zone ~3,400–3,420 Major institutional selling area
SR Interchange (Blue) ~3,320–3,340 Critical resistance / flip zone
Current Price ~3,297 Watching reaction for momentum shift
Demand Zone (Green) ~3,280–3,260 Key support / bounce zone
Major Demand Pending ~3,240–3,220 Next support level if drop continues
✅ Conclusion:
Gold is at a critical inflection point.
The recent bearish breakout signals weakness, but the current support zone may provide a short-term bullish setup if buyers defend it effectively. A successful reclaim of the SR flip zone will shift sentiment bullish again. Otherwise, a deeper correction is likely.
This setup is ideal for both swing and intraday traders—look for confirmation signals at the current support and SR zone before executing trades.
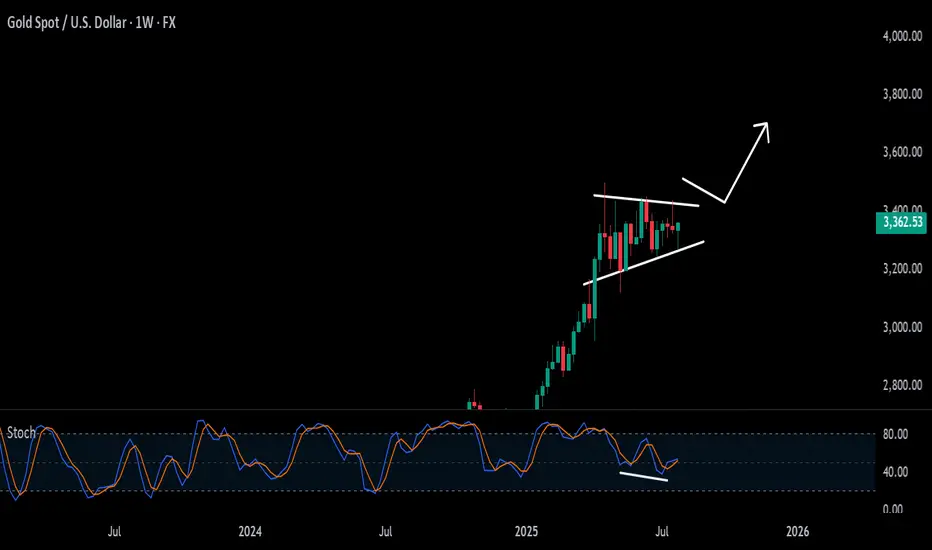
Gold is bullish Long TermLooking at the consolidation of Gold on a daily timeframe, you'd see that gold is still undecided on a reversal. I think that Gold would retest the uptrendline one last time...
What are your thoughts on this?

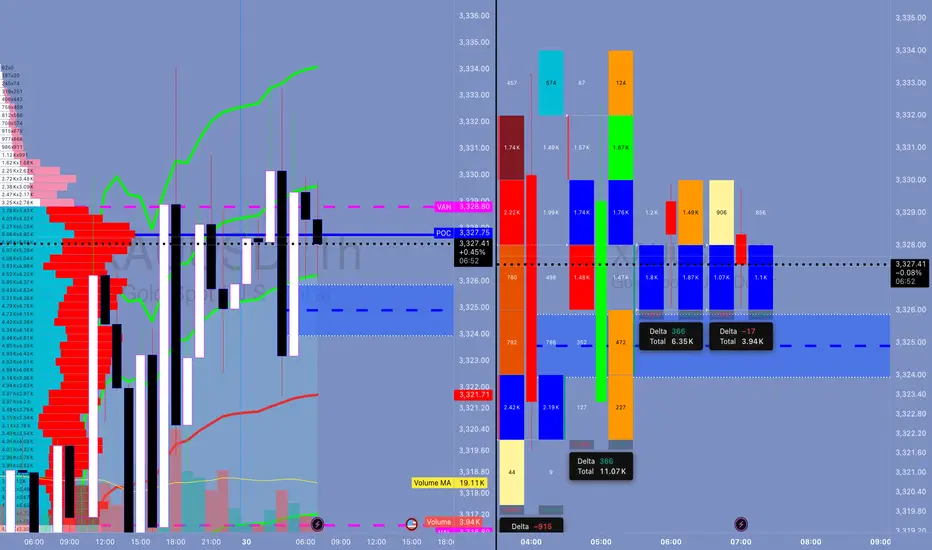
Schabacker's Gold Trap Inside the Trap: Schabacker Congestion, VWAP Warfare & The Silent Distribution on XAU/USD
1. The Congestion Area – Schabacker Style
🔍 What We Saw:
Price action rotated in a tight range: 3,324.5 - 3,329.5.
This is not random. This is Schabacker’s classic Congestion Zone:
Duration: 12+ hours
Width: ~5 points
Volume: tapering near edges
Failed breakouts on both sides = classic neutral wedge compression.
🎯 Schabacker Teaching Applied:
"Congestion areas are places of rest and preparation — they are the breeding grounds of significant breakouts or breakdowns."
From his bible “Technical Analysis and Stock Market Profits”:
Congestion after a trend → likely a continuation (but confirm via breakout volume).
Multiple failed breakouts = deceptive strength/weakness → traps.
Range becomes psychological equilibrium → breakout from this zone is explosive.
📘 Lesson:
Watch for breakout confirmation only AFTER price escapes the congestion and retests the range (confirm with volume and delta). If volume weakens and price returns inside = fakeout, fade that sh*t.
🔥 How Schabacker Explains July 29 Price Action
"This was a classic congestion scenario with symmetrical compression, rejecting value high and value low over and over — a balanced market ripe for an imbalanced expansion."
Price coiled with lower highs + higher lows inside the value zone = triangle-like congestion.
Breakout attempts both sides failed = energy stored.
Delta flipped negative toward the close + volume dried = distribution inside the congestion.
✅ Congestion was not random chop. It was the Smart Money disguising their exit before slamming price.
⚔️ ENHANCED STRATEGIC OUTLOOK FOR TODAY (JULY 30, 2025)
🎯 Bias: Short bias unless proven wrong by breakout + acceptance above 3,329.50
Schabacker’s congestion broken to the downside = high probability short trigger.
First target = edge of congestion zone @ 3,316.80 (previous VAL).
Second target (extension) = swing low anchor near 3,310.
📘 Volatility Note:
After tight range like this (Schabacker Box), volatility expansion is imminent. Don’t get caught trading inside — trade the break and retest.
💣 HYPOTHETICAL TRADE PLAN: SCHABACKER STRATEGY IN PLAY
Order Type: 🔻 Sell Stop Below Congestion Break
Entry: 3,322.00
Stop Loss: 3,330.00 (above congestion top + failed breakout zone)
Take Profit 1: 3,316.80 (edge of range, VAL)
Take Profit 2: 3,310.00 (target from congestion width projection)
Confidence: 78%
🧠 Justification:
Factor Explanation
VWAP Flatlined = balanced market
FVRP Price camped near POC = equilibrium
Footprint Absorption at highs, silent selling = distribution confirmed
Delta Early buyer strength flipped = trap
Schabacker Congestion Classic box breakout setup = timing the expansion
🧠 EDUCATIONAL SUMMARY — WHAT YOU JUST LEARNED
✅ Schabacker’s Congestion Area Tactics
Congestion after a move Leads to continuation (trend resumes after pause)
Multiple failed breakouts Traps traders = setup for fakeout fade
Volume dries inside box = Explosive breakout likely
Use congestion width To project breakout targets
You don't fade chop — you exploit it after the breakout.
Don't waste your bullets inside the box. Wait for the beast to break loose — then you unload.
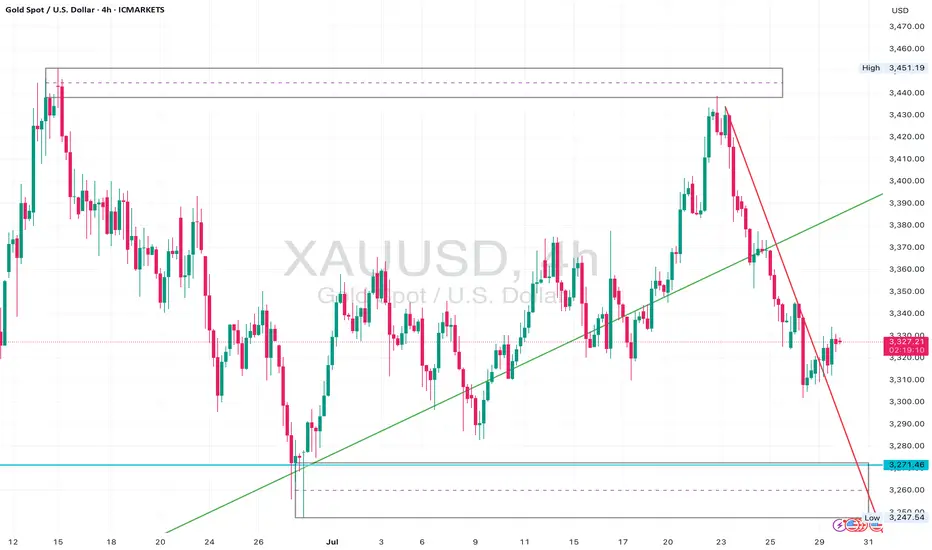
Gold Bear Flag Forming After Trendline Break – Short Setup BelowGold (XAUUSD) recently broke a major ascending trendline that had held since late June, leading to an aggressive sell-off from the $3,440s down to the $3,270 zone.
Following that, price is now consolidating just beneath the previous support trendline, forming what appears to be a bear flag or rising channel inside a corrective structure.
The $3,330–$3,340 zone is now acting as resistance, and price is struggling to close above this level.
The current structure suggests continuation to the downside, with clean space to revisit the $3,271 liquidity pool and potentially even sweep that low.
Watch for bearish confirmation below the current flag – especially if price prints a rejection wick or engulfing candle at the upper edge of the box.
⸻
Key Levels:
• Resistance: $3,330 – $3,340 (flag top + previous support turned resistance)
• Support: $3,271 zone, followed by $3,248 sweep potential
⸻
Trigger Criteria:
• Bearish rejection inside the flag (e.g. pin bar or engulfing)
• Break and retest of the flag bottom or horizontal support
⸻
Risk Note:
A clean break back above $3,350 and reclaim of the previous trendline would invalidate this idea short term and shift bias back to neutral/bullish.
GOLD: Strong Growth Ahead! Long!
My dear friends,
Today we will analyse GOLD together☺️
The market is at an inflection zone and price has now reached an area around 3,321.22 where previous reversals or breakouts have occurred.And a price reaction that we are seeing on multiple timeframes here could signal the next move up so we can enter on confirmation, and target the next key level of 3,329.97.Stop-loss is recommended beyond the inflection zone.
❤️Sending you lots of Love and Hugs❤️
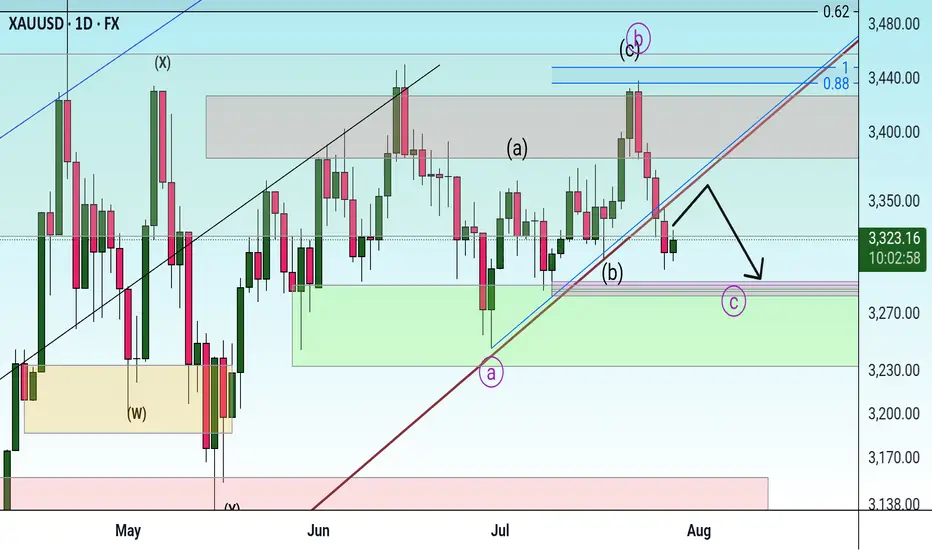
Correction It is expected that the price will consolidate below the trend line and continue the downtrend to the specified support levels. In this case, a three-wave pattern will form.