Bullish Momentum Fading? Key Correction Levels Ahead XAUUSD – Bullish Momentum Fading? Key Correction Levels Ahead (23 July)
📰 Market Overview
Gold surged strongly overnight, driven by:
A speech from Fed Chair Jerome Powell, with no hints of resignation or major policy shift.
Rising geopolitical tensions between the US, China, and the EU — with the 1st of August marked as a key deadline.
A notable drop in US bond yields and the US Dollar, triggering increased demand for safe-haven assets like gold.
While today’s economic calendar is quiet, the market remains sensitive to sudden volatility.
📉 Technical Analysis
On the H4 chart, the recent bullish wave shows signs of exhaustion. Reversal candles are now forming on the H1 and M30 timeframes — suggesting a potential correction in the short term.
The 3412 – 3410 support zone will be critical. If price breaks below and invalidates the ascending trendline, we may see a deeper pullback toward lower liquidity zones (FVGs).
Below that, the 335x region offers strong confluence (Fibonacci 0.618 + previous demand zone), making it a prime area for potential long entries if price action confirms a bounce.
📌 Trade Setups to Watch
🔻 SELL ZONE: 3469 – 3471
Stop Loss: 3475
Take Profit Targets: 3465, 3460, 3455, 3450, 3445, 3440, 3430, 3420
→ Wait for a breakout and retest before shorting.
🔸 BUY SCALP: 3385 – 3383
Stop Loss: 3379
TP Targets: 3390, 3394, 3398, 3402, 3406, 3410
→ Ideal for intraday pullback entries with clear structure.
🔹 STRONG BUY ZONE: 3356 – 3354
Stop Loss: 3350
TP Targets: 3360, 3364, 3368, 3372, 3376, 3380, 3390, 3400
→ Great long-term entry zone with technical alignment (liquidity + fib levels).
⚠️ Risk Management Reminder
Even in low-news sessions, markets may spike unexpectedly due to political statements or liquidity sweeps.
Always respect your TP/SL levels — smart trading is protected trading.
💬 Patience breeds precision. Wait for the zone, trust the plan, and manage the trade.
XAUUSDG trade ideas

XAU / USD Daily ChartHello traders. I posted a weekly chart last night. Looking at the Daily chart, I have shown my areas of interest to watch. I will post a 4 hour / lower time frame chart in a bit. We have the NY market opening in half an hour. Let's see how things play out. Big G gets my thanks. Be well and trade the trend.

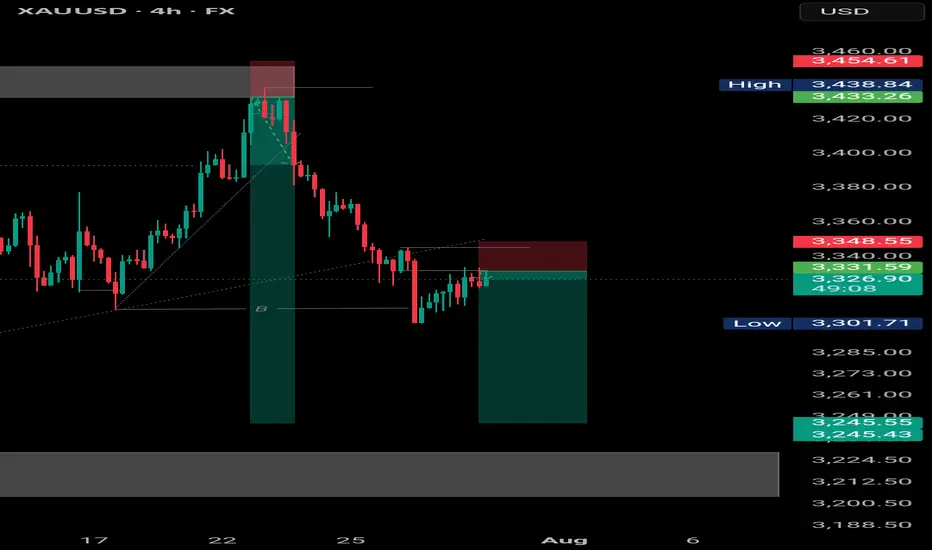
XAUUSD 4H | Clean break & retest | Bearish "XAUUSD 4H | Clean break & retest ✅ Bears stepping in at supply zone, targeting next demand area below. 🏹
Entry: 3331 | SL: 3348 | TP: 3246"
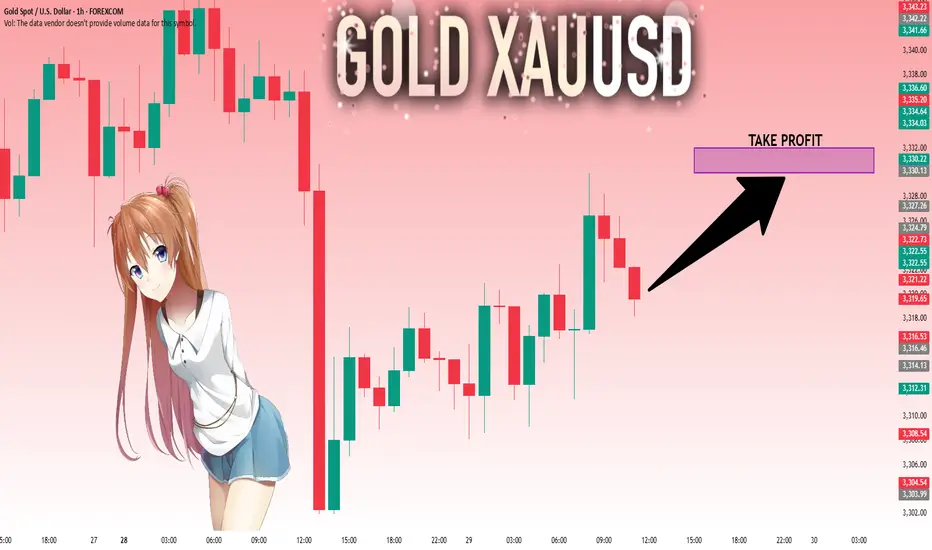
GOLD: Strong Growth Ahead! Long!
My dear friends,
Today we will analyse GOLD together☺️
The market is at an inflection zone and price has now reached an area around 3,321.22 where previous reversals or breakouts have occurred.And a price reaction that we are seeing on multiple timeframes here could signal the next move up so we can enter on confirmation, and target the next key level of 3,329.97.Stop-loss is recommended beyond the inflection zone.
❤️Sending you lots of Love and Hugs❤️
Downward Pressure Resumes After Channel BreakdownXAUUSD OANDA:XAUUSD – Downward Pressure Resumes After Channel Breakdown: Key Levels and Strategy for Today
As of the July 29 session, gold (XAUUSD) remains under short-term bearish pressure, having broken below the descending price channel on the 1H timeframe. The market structure confirms a dominant bearish trend as price continues to trade below the EMAs cluster.
1. Price Action and Market Behavior
XAUUSD is forming a clear sequence of lower highs and lower lows, confirming a short-term downtrend.
Price is currently hovering around $3,316 after breaking below the lower boundary of the channel, signaling potential continuation of the sell-off.
2. Key Resistance and Support Levels
Immediate resistance: 3,337 – 3,346 USD (aligned with EMA20, EMA50 and prior channel resistance).
Major resistance: 3,378 – 3,385 USD (confluence of Fibo and former high).
Near-term support: 3,300 USD (psychological level).
Major support: 3,248 USD (projected target based on measured move from channel height).
3. Technical Indicators
EMA20 and EMA50 are both below EMA200, forming a classic “death cross” – a strong bearish signal.
Volume increased on the breakdown, reinforcing the strength of bearish momentum.
RSI remains below 50, indicating weak bullish retracements and room for further downside.
4. Trading Strategy
Primary Strategy: Sell on Rally
Ideal entry zone: 3,331 – 3,346 USD.
Stop Loss: Above 3,353 USD (above key resistance zone).
TP1: 3,300 USD.
TP2: 3,248 USD (extended target based on breakout structure).
Alternative Strategy: Countertrend Long
Only consider buy setups if strong reversal candles and bullish RSI divergence appear near 3,248 USD.
XAUUSD continues to face downside risk after the channel breakdown. Unless bulls reclaim the 3,337 – 3,346 zone, price is more likely to drift lower toward 3,300 and potentially 3,248. Traders should remain patient and wait for clean setups around these key zones.
Follow for more strategies and remember to save this post if you found it helpful.
Let me know if you'd like a short version for the TradingView caption or hashtags suggestion.


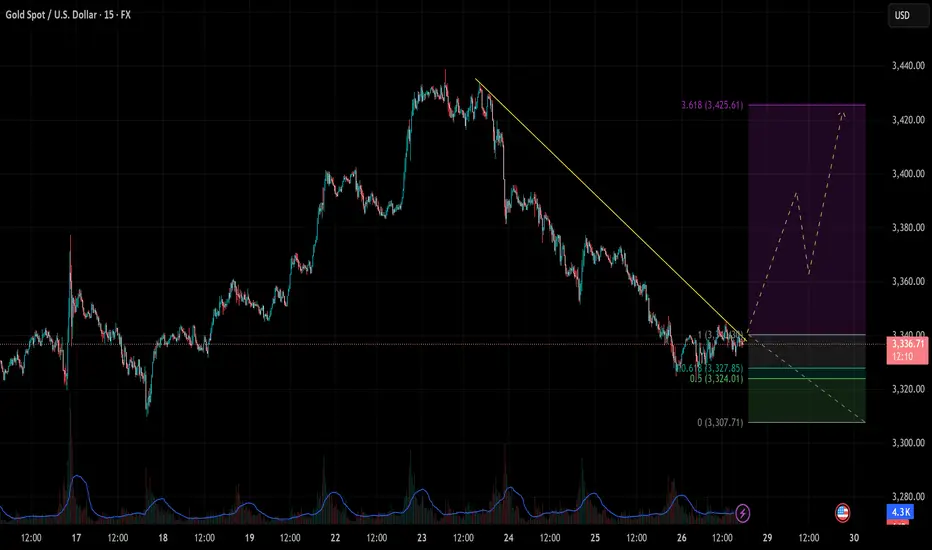
[XAUUSD] Reversal Signals from Key Support As of the July 28–29 trading sessions, the XAUUSD 15-minute chart is showing early signs of a bullish reversal, with price reacting strongly at a key Fibonacci support zone and breaking through a descending trendline.
1. Price Action and Technical Structure
After a prolonged downtrend from the 3,430 zone, gold found support at the 0.618 Fibonacci retracement (3,327.85), aligning closely with the horizontal support at 3,324 – 3,327.
A descending trendline has been breached, signaling a potential breakout setup.
A potential ZigZag corrective wave structure is forming, hinting at the beginning of a new bullish swing.
2. Fibonacci Extension & Upside Targets
The Fibonacci extension tool suggests a possible rally toward the 3.618 extension at 3,425.
This level marks the next major upside target if the breakout holds.
3. Key Price Levels
Price Zone
Technical Significance: 3,327 – 3,324 Major support zone (Fib 0.618 + horizontal support)
3,350 – 3,355 First reaction zone / interim resistance
3,380 – 3,400 Strong resistance zone
3,425 Final target – 3.618 Fib extension
4. Suggested Trading Strategy
Long Setup – Breakout & Reversal Confirmation
Entry: 3,328 – 3,332 (after bullish confirmation above trendline and support)
Stop Loss: Below 3,320 (beneath local swing low)
Take Profit: 3,355 → 3,380 → 3,425 (scaling out by zone)
Bearish Continuation Scenario
If price drops below 3,320 and breaks 3,307 support, the bullish outlook is invalidated, and a retest of deeper levels is likely.
5. Volume and Confirmation Cues
Volume has started to pick up as price tests the breakout zone – indicating that buying pressure may be returning.
Wait for a strong bullish candle with volume above average before committing to the trade.
Gold is approaching a critical inflection point, and bulls may regain control from this confluence support zone. Stay alert for a breakout confirmation. Save this idea if you find it helpful and follow for more high-probability strategies!
XAUUSD next move GOLD is currently on a very critical zone there are only two options here its either going to break below or retest the zone then shot up . if it fails to break @3328 then we gonna see a buy but if it breaks @3328 we definitely going down deep . Lets keep a close eye

Daily Analysis- XAUUSD (Monday, 28th July 2024)Bias: Bullish
USD News(Red Folder):
-None
Notes:
- Price gap down and filled up the gap
- Looking for price to tap 0.618 fib level
- Potential BUY if there's
confirmation on lower timeframe
- Pivot point: 3300
Disclaimer:
This analysis is from a personal point of view, always conduct on your own research before making any trading decisions as the analysis do not guarantee complete accuracy.

GOLD - W30📅 Gold Weekly Outlook (July 29 – Aug 2, 2025)
Current Price: ~$3,336
Last Week: Rejected near $3,400+, bearish weekly close expected.
🔍 Key Levels
Resistance: $3,365 → $3,380 → $3,400
Support: $3,330 → $3,310 → $3,275
⚠️ Why It Moved
Strong dollar & fading rate cut hopes pressured gold.
Risk sentiment improved → gold demand dropped.
📉 Outlook
Bearish bias if price stays below $3,365.
Watch for bounce near $3,310, but no reversal yet.
Break below $3,310 opens downside to $3,275.
✅ Trade Setup #1 – Sell the Pullback
Type: Short
Entry: $3,360–$3,370 (if price retests broken support)
Stop Loss: Above $3,380
Take Profit:
TP1: $3,330
TP2: $3,310
TP3: $3,275
Condition: Only take this if price fails to break $3,370 and shows bearish rejection (e.g., wick or bearish candle)
✅ Trade Setup #2 – Buy on Support Bounce
Type: Long (counter-trend, risky)
Entry: $3,310–$3,320 zone
Stop Loss: Below $3,295
Take Profit:
TP1: $3,340
TP2: $3,365
Condition: Only if bullish reversal pattern forms (e.g., hammer, bullish engulfing)
🗓️ Events to Watch
Wed: FOMC rate decision
Fri: US Non-Farm Payrolls

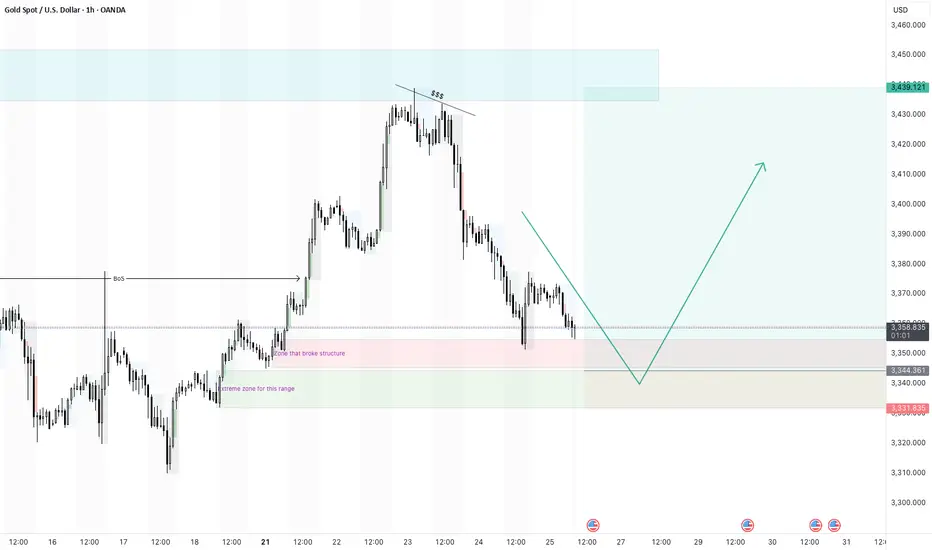
XAUUSD continuation of larger bullish move - 25/7/25Gold did touch the higher timeframe supply zone and pull back. It is now at a point where i am looking for a pivot to form to continue bullish.
I did place a buy limit trade at the extreme zone that started the break of structures.
i will wait a see if it drops and triggers or forms a pivot at the 4H zone that broke structure.

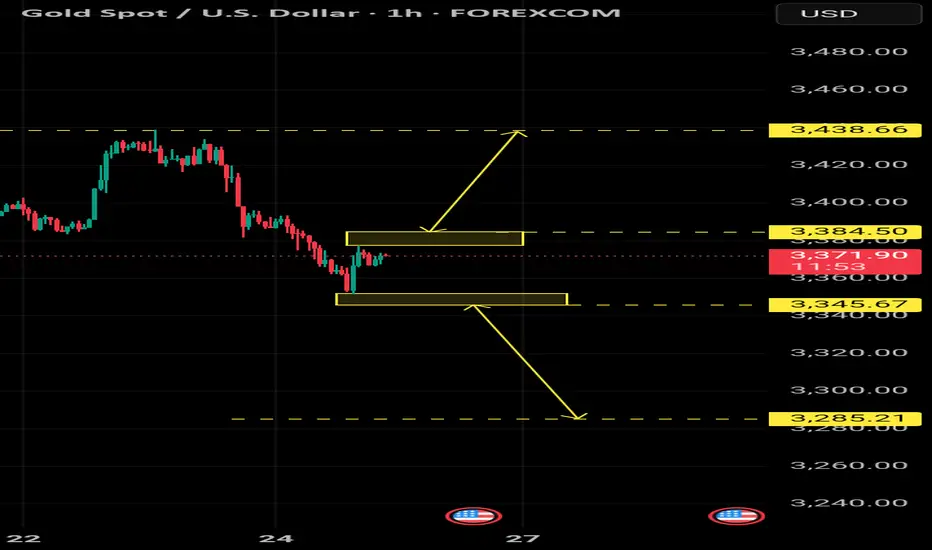
Quick Gold AnalysisYellow areas are important in case of a breakout.
Break the upper area, targeting the last weekly high.
Break down, targeting the level shown on the chart.
Gold Trading Strategy | July 24-25✅ Fundamental Analysis
🔹 Diminishing Safe-Haven Demand: The reduction of U.S.–Japan auto tariffs to 15% and progress in U.S.–EU tariff negotiations have weakened gold’s appeal as a safe-haven asset. Risk-on sentiment has led to capital flowing into risk assets, squeezing safe-haven positions.
🔹 Speculative Positioning Adjustment: COMEX gold net non-commercial long positions have remained above 200,000 contracts for three consecutive weeks. The crowding level of leveraged positions has reached the 82nd percentile, increasing the likelihood of technical profit-taking, thereby adding to market volatility.
🔹 Long-Term Supportive Factors: Ongoing central bank gold purchases and U.S. dollar credit concerns (e.g., political pressure on the Fed by Trump) may limit the downside potential in gold prices.
✅ Technical Analysis
🔸 After failing to break higher, gold has pulled back toward the lower boundary of its trading range, and short-term weakness is gradually emerging. On the daily chart, the 5-day moving average ($3385) has crossed below the 10-day moving average, forming a bearish crossover, indicating weakening short-term momentum.
However, medium- and long-term moving averages remain in a bullish alignment, suggesting that the broader trend is still intact.
🔸 MACD: A bearish crossover has formed above the zero line, with increasing red bars on the histogram, signaling that the correction may not be over.
RSI: Currently at 52, within the neutral zone—no oversold signal yet, implying further downside room.
Bollinger Bands: Price remains above the middle band (approx. $3340), but the narrowing band width suggests a potential breakout is approaching.
🔴 Resistance Levels: 3375–3380 / 3397–3403
🟢 Support Levels: 3350–3355 / 3335–3340
✅ Trading Strategy Reference:
🔻 Short Position Strategy:
🔰Consider entering short positions in batches if gold rebounds to the 3375-3380 area. Target: 3360-3350;If support breaks, the move may extend to 3340.
🔺 Long Position Strategy:
🔰Consider entering long positions in batches if gold pulls back to the 3335-3340 area. Target: 3360-3370;If resistance breaks, the move may extend to 3380.
🔥Trading Reminder: Trading strategies are time-sensitive, and market conditions can change rapidly. Please adjust your trading plan based on real-time market conditions. If you have any questions or need one-on-one guidance, feel free to contact me🤝

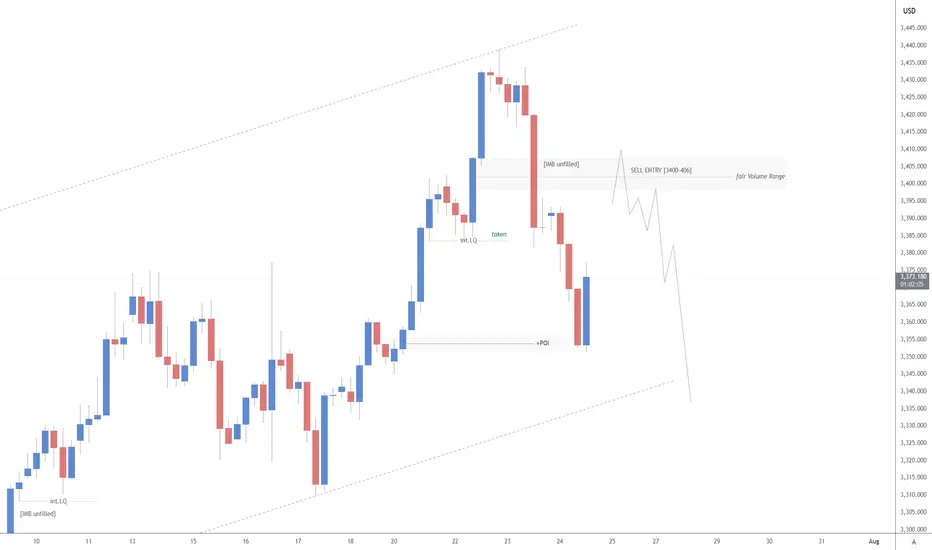
XAUUSD H4 | SELL 💡Why Gold Pulled Back
- Gold pulled back today after hitting $3439.04, just below resistance at $3451.53. Traders took profits ahead of key Fed and trade headlines. Right now, it’s trading around $3414.48, down 0.50%.
- The dip came after the U.S.-Japan trade deal eased geopolitical tension, cutting safe-haven demand. Plus, U.S. bond yields are climbing (10-year at 4.384%), which adds pressure on gold.
Support is building at $3374.42, with stronger buying interest expected around $3347.97 and the 50-day moving average at $3336.40 — a key level bulls want to defend.
Short-term looks a bit weak, but as long as gold holds above the 50-day MA, the bullish trend remains intact. Longer-term, weakness in the dollar, central bank gold buying, and concerns about Fed independence could push prices higher.
🔍Watching the Fed’s July 29–30 meeting next
GOLD: Target Is Down! Short!
My dear friends,
Today we will analyse GOLD together☺️
The recent price action suggests a shift in mid-term momentum. A break below the current local range around 3,359.59 will confirm the new direction downwards with the target being the next key level of 3,350.22.and a reconvened placement of a stop-loss beyond the range.
❤️Sending you lots of Love and Hugs❤️

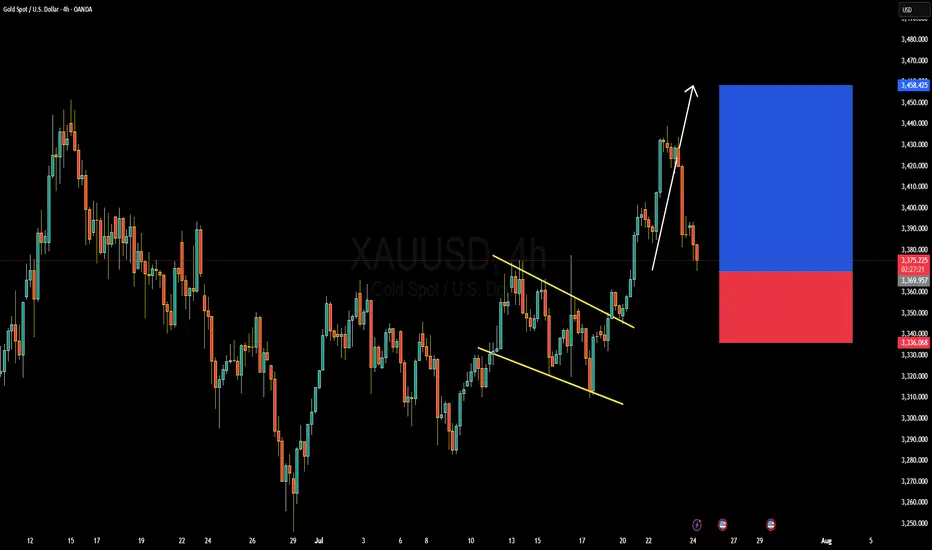
GOLD (XAUUSD) Forming Bullish ContinuationGold (XAUUSD) is currently presenting a strong bullish continuation setup after breaking out of a falling channel on the 4H timeframe. Price action confirmed bullish momentum with impulsive candles following the breakout, and we’re now seeing a textbook retest of the breakout zone around 3,370–3,360, which previously acted as resistance and is now expected to hold as support. The risk-to-reward ratio remains highly favorable, targeting the 3,450–3,460 zone in the upcoming sessions.
From a macro perspective, gold is gaining upside traction as the US dollar weakens amid growing speculation around an upcoming Fed rate cut. Investors are rotating into safe-haven assets as recession concerns resurface, with the market pricing in increased geopolitical tension and slower economic growth forecasts. Real yields are cooling, which typically boosts non-yielding assets like gold. With central bank demand for gold also staying strong, the bullish narrative continues to build.
Technically, momentum remains in the bulls’ favor. RSI is still holding above midline levels, suggesting there’s room for further upside. The current pullback offers a healthy correction within a larger bullish trend. Holding above the 3,360–3,340 support range is key for continuation; a daily close above 3,390 would confirm the next wave toward 3,450 and possibly 3,500 in the medium term.
This is a clear case of momentum following structure. As long as the lower boundary holds firm, I remain bullish on gold with strong conviction. Watch for volume confirmation on the bounce, and trade the trend—momentum is with the buyers.
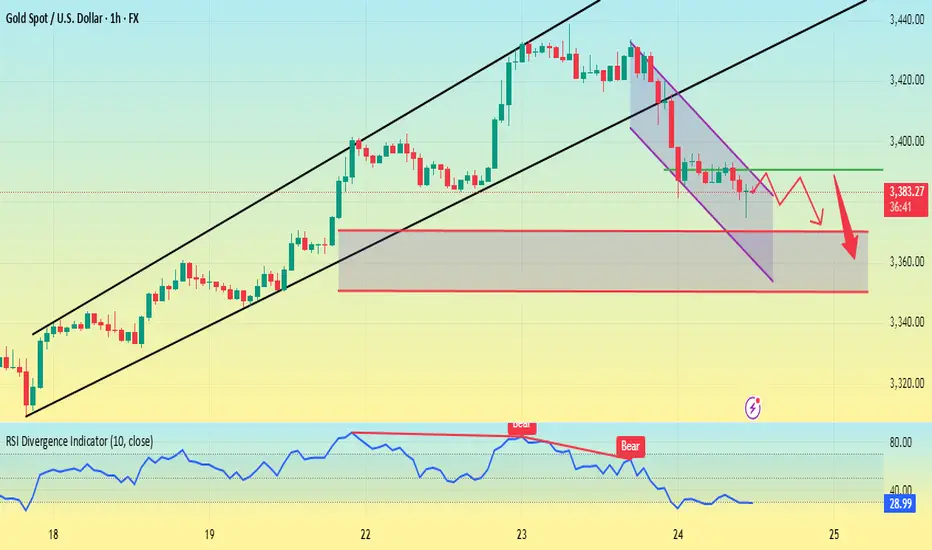
Gold peaked in the short term. Welcome a new trend?The previous rising structure of gold was broken, especially yesterday's rapid decline broke through the previous support of 3385. Although it rebounded slightly, it was difficult to change the adjustment. Yesterday's high point of the US market was at 3396-98 US dollars. Today, the adjustment trend continued. The dividing point between long and short is 3395 US dollars today. Before the price reaches here, do not consider long.
Many traders are confused. Why are there longs one day and shorts the next day? In fact, this is the characteristic of the volatile market. Breaking the key position cannot last. No matter what you think about the market, you must pay attention to the current shape changes. In the volatile market, you should consider the market of the day more, not the long-term direction.
From the 1-hour chart, the gold price rebounded near 3390 and shorted, and the profit range is 3370-3350.
The backup strategy is to break through 3400 and go long, and pay attention to 3415-3425 on the upside.
In other words, look for opportunities to short on a rebound below 3400 today, and adjust your thinking after breaking through the key resistance.
XAUUSDXAUUSD Updated in 15M :
The gold signal is marked on the chart based on the latest price changes and the supply and demand in the market. These points include the entry point, stop loss, and take profit

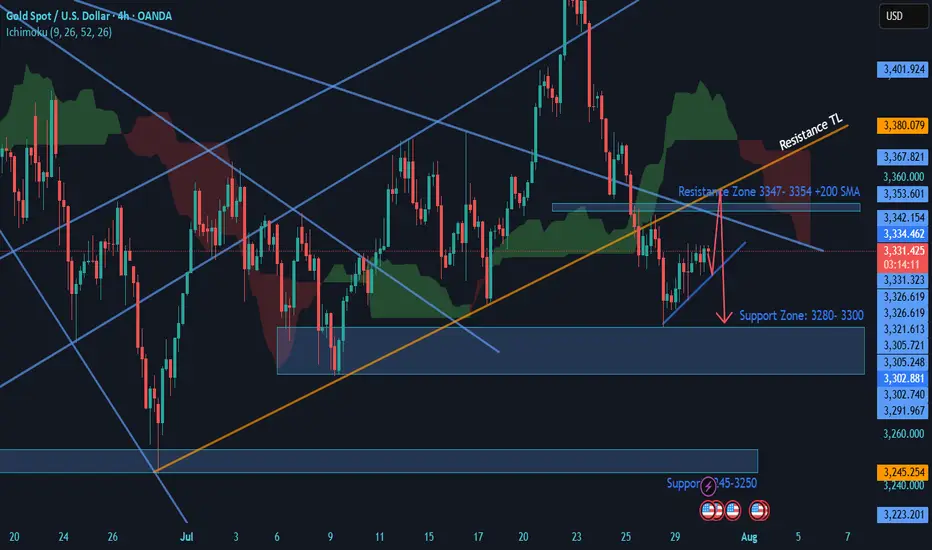
Gold holds Bearish Structure- SELLGold: Price is Exhibiting Head & Shoulders Strcure on 4H & 1 H chart. 4 H chart is Bearish, Daily chart is Neutral to bearish. Price is under the IChimuku Cloud in 4 H.
Daily chart is forming a death cross (20 SMA cutting 50 SMA) which might be completed in 1 day or Two.
Currently Gold is trying to recover losses and on retracement journey. I am expecting Price to test the 3347-3354 Zone of resistance where 4H 200+100 SMA + TL resistances+ Structure resistance will likely to Push price back to 3320 & 3300 Support Zone.
If price breaks the 3300 level. Then this daily candle break may take price to 3280 Support Level.
Good Luck
Xausd techinical analysis.Xausd techinical analysis next move posibale at h2 time frame not finchinal advice.

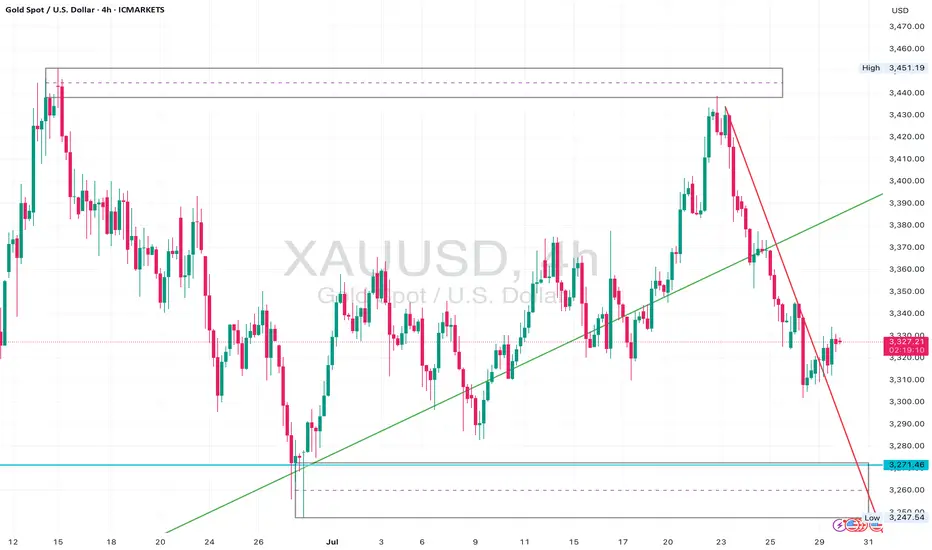
Gold Bear Flag Forming After Trendline Break – Short Setup BelowGold (XAUUSD) recently broke a major ascending trendline that had held since late June, leading to an aggressive sell-off from the $3,440s down to the $3,270 zone.
Following that, price is now consolidating just beneath the previous support trendline, forming what appears to be a bear flag or rising channel inside a corrective structure.
The $3,330–$3,340 zone is now acting as resistance, and price is struggling to close above this level.
The current structure suggests continuation to the downside, with clean space to revisit the $3,271 liquidity pool and potentially even sweep that low.
Watch for bearish confirmation below the current flag – especially if price prints a rejection wick or engulfing candle at the upper edge of the box.
⸻
Key Levels:
• Resistance: $3,330 – $3,340 (flag top + previous support turned resistance)
• Support: $3,271 zone, followed by $3,248 sweep potential
⸻
Trigger Criteria:
• Bearish rejection inside the flag (e.g. pin bar or engulfing)
• Break and retest of the flag bottom or horizontal support
⸻
Risk Note:
A clean break back above $3,350 and reclaim of the previous trendline would invalidate this idea short term and shift bias back to neutral/bullish.
GOLD BEARISH BIAS|SHORT|
✅GOLD broke the rising
Support line which is now
A resistance and the price
Is retesting the line now so
We are locally bearish biased
And we will be expecting a
Local move down
SHORT🔥
✅Like and subscribe to never miss a new idea!✅
Disclosure: I am part of Trade Nation's Influencer program and receive a monthly fee for using their TradingView charts in my analysis.
