XAUUSD idea for upcoming weekThe chart presents a bearish outlook for gold based on a retracement and continuation pattern. Here's a detailed analysis:
🔍 Chart Summary:
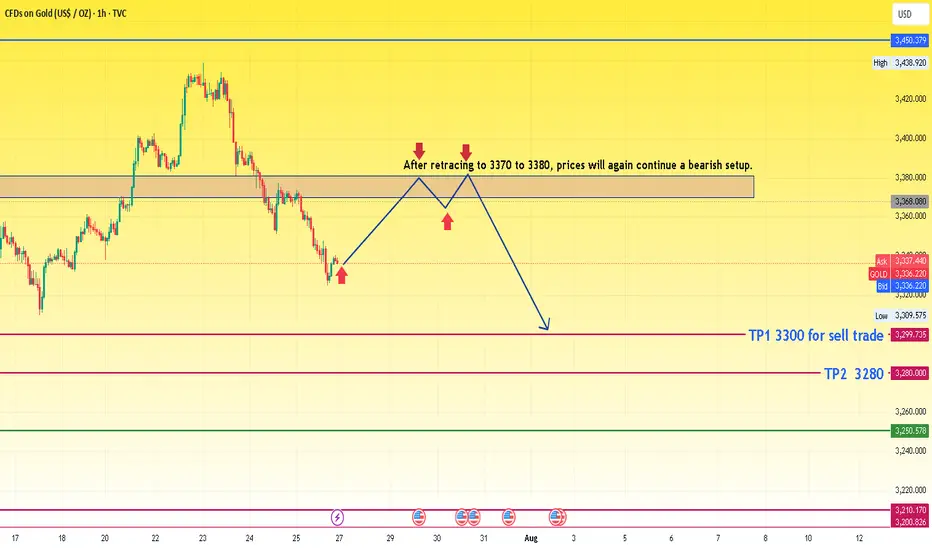
Current Price: Around 3336
Bias: Bearish (after retracement)
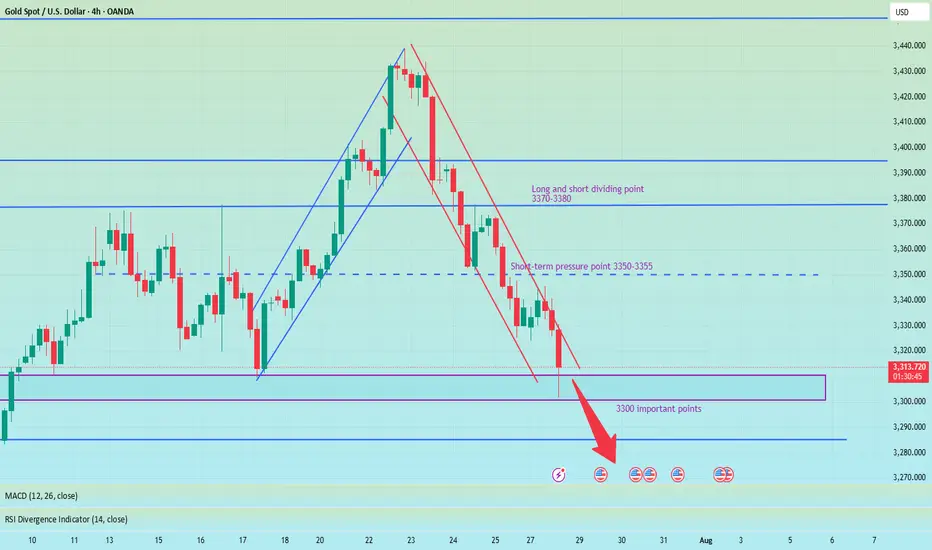
Resistance Zone: 3370 – 3380
Sell Confirmation Area: Upon rejection from the 3370–3380 resistance zone
Target 1 (TP1): 3300
Target 2 (TP2): 3280
📈 Technical Structure:
Recent Trend:
The price has dropped sharply from its recent peak.
Now it's attempting a pullback to previous support, which has turned into a resistance zone (3370–3380).
Price Action Expectation:
A retracement is expected toward 3370–3380.
If the price gets rejected from this resistance block, the chart suggests the formation of a lower high.
After rejection, a bearish continuation is expected.
Projected Move:
Short entry around the resistance zone.
Targets:
TP1: 3300 (intermediate support)
TP2: 3280 (major support)
🧠 Trade Idea Logic:
The chart follows a classic bearish price action setup: impulse → retracement → continuation.
The consolidation and break area has flipped from support to resistance.
The retracement zone is clearly defined, making it a high-probability area for reversal if bearish signals (e.g., rejection candles) form.
⚠️ Key Considerations:
Wait for confirmation: Do not enter blindly at 3370–3380. Look for rejection patterns (like a bearish engulfing or pin bar).
Volume and fundamentals: Watch for economic data or geopolitical news that might invalidate the technical setup.
SL Suggestion: Above 3385 or 3390 to allow some room for wick spikes.
XAUUSDG trade ideas
XAUUSD BUY LONG XAUUSD BUY LONG FROM BULLESH OBI
- In Daily TF Market will bullesh
- In H1 TF market is stell fully bullesh
- Market is in Daliy , H4 , H1 , M15 BISI
- In H1 & M15 MSS then our entry in OBI in LTF Valid MSS then our Entry target H1 Nearest Liquidity with Tight SL
tradE anD enjoY ......................................................
~~ KGB Priyabrat Behera ~~
~ ICT Trader & Advance Mapping SMC Trader ~

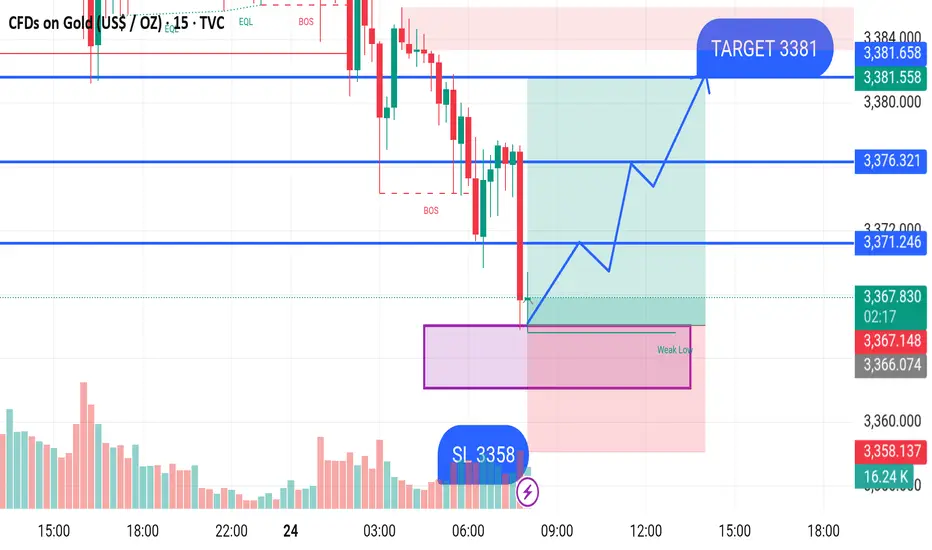
GOLD BUY M15 Gold (XAU/USD) 15-Minute Chart Analysis – July 24, 2025
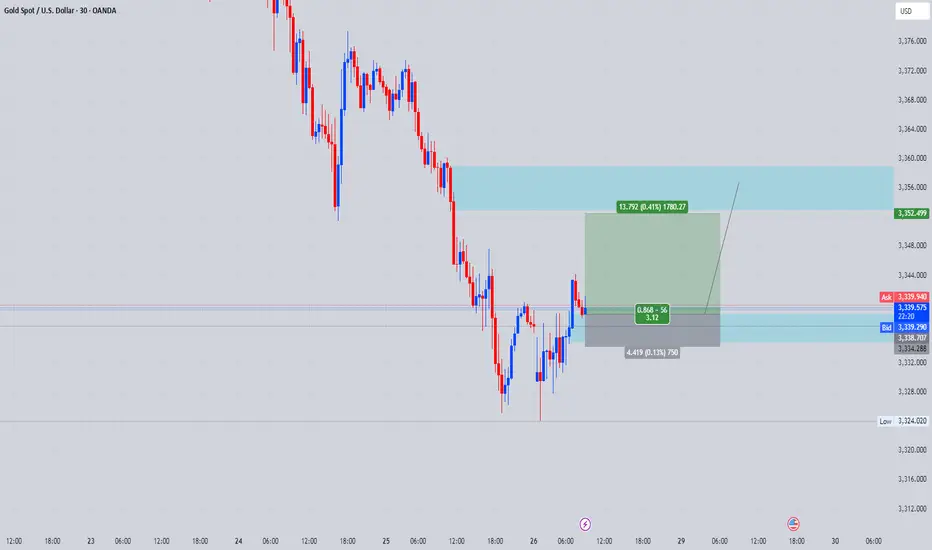
Price has recently broken structure (BOS) to the downside, creating a weak low around the 3360–3365 zone. This area has acted as a liquidity grab, where the price tapped into a marked demand zone (highlighted in purple), indicating a potential bullish reversal.
Entry Plan:
Buy Entry Zone: 3360–3365 (demand zone)
Stop Loss (SL): 3358 (below the weak low)
Take Profit (TP) / Target: 3381
Key Resistance Levels:
First Target Level: 3371.246
Second Resistance Level: 3376.321
Final Target: 3381.658
Bias:
Bullish Reversal expected from the demand zone with confirmation of structure break and volume increase. A clean risk-to-reward setup is visible with the SL below the liquidity zone.
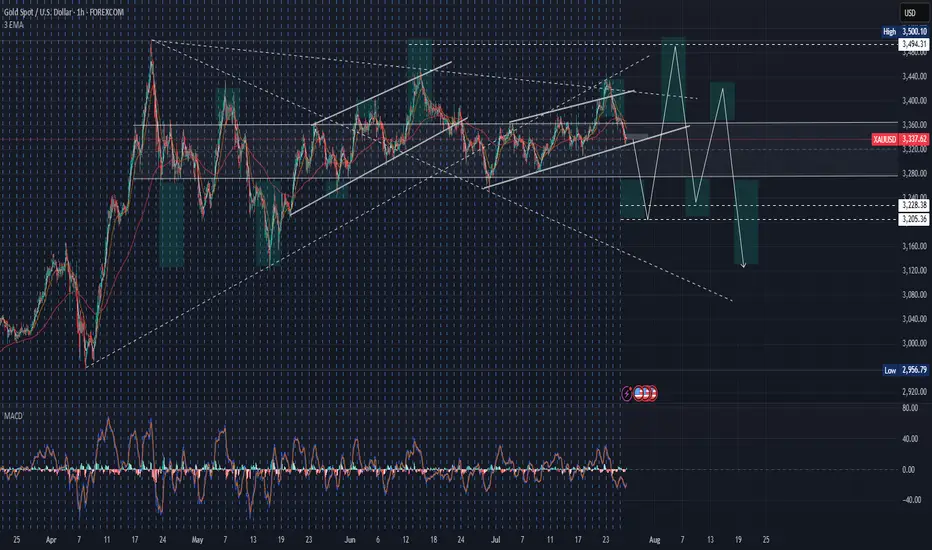
Important Update of the overall trendHey guys this is an important update of the overall trend and I am more excited from this drop than ever. We could have the best opportunity to buy gold soon! Thank you.

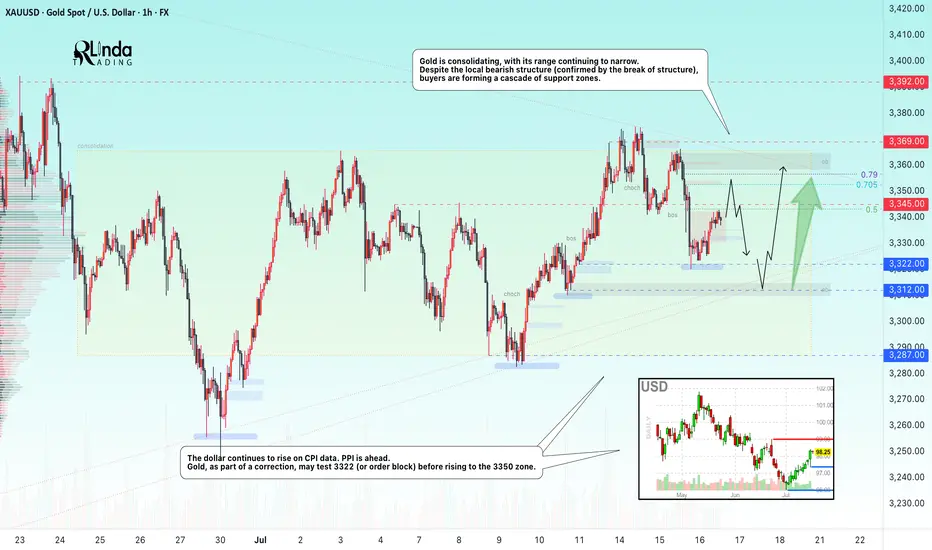
GOLD → Borders are shrinking. Consolidation continues...FX:XAUUSD is adjusting amid controversial CPI data and confirming the local bearish market structure. The PPI is ahead, and gold is consolidating, with its boundaries continuing to narrow...
Gold is recovering slightly but remains under pressure amid rising bond yields and a stronger US dollar. Higher inflation in the US reduces the chances of a quick Fed rate cut. Traders are cautious ahead of the PPI data release. If producer inflation exceeds forecasts, the dollar may rise again, putting further pressure on gold
Technically, we see consolidation in a symmetrical triangle pattern. Trading within the consolidation has a negative side - low volatility and unpredictable movements. The purpose of such movements is accumulation. However, decisions can be made based on relatively strong levels. In the current situation, we are seeing a rebound from 0.5 Fibonacci (I do not rule out a retest of the 0.7 zone before correction). The price may head towards the liquidity zone of 3322 before rising to the upper boundary of the consolidation and the zone of interest of 3350-3360.
Resistance levels: 3345, 3353, 3369
Support levels: 3322, 3312, 3287
The problem is that the price is in a consolidation phase. That is, technically, it is standing still and moving between local levels. You can trade relative to the indicated levels. Focus on PPI data. At the moment, gold is in the middle of a triangle and is likely to continue trading within the boundaries of a narrowing channel due to uncertainty...
Best regards, R. Linda!
XAUUSD CAN FLY HIGHXauusd market running in side from last few days now market will touch the support zone so if you to buy gold then you have to good oppourtanity to buy from support level
TRADE AT YOUR OWN RISK
REGARD ALBERT

XAUUSD: Market Analysis and Strategy for July 29Gold Technical Analysis:
Daily chart resistance: 3345, support: 3285
4-hour chart resistance: 3340, support: 3300
1-hour chart resistance: 3330, support: 3308.
After last week's sharp decline, gold continued its decline yesterday, breaking below its opening low and continuing its downward trend, reaching a low near 3300. In the short term, selling pressure is strong, but the rebound is weak, with a rebound high of 3330.
In terms of intraday trading, yesterday's low of 3301 was followed by a rebound. Focus on the resistance range of 3330-3338. Selling is recommended if the price is trading sideways between 3330-3338, with a defense of 3340. If it falls below 3300, the next target will be 3285.
Sell: 3338
Buy: 3302
Sell: 3300

How to plan for the evening, pay attention to the 3300 markAfter the shorts took profits, gold consolidated in the 3310-3300 area. Judging from the daily chart, the decline in gold seems to have just begun, with the middle track of the Bollinger Band at around 3345 and the lower track at 3285. The possibility of falling below the 3300 mark cannot be ruled out in the evening. If gold falls below the 3300 mark, it may first hit 3295. If the decline continues, it may even hit the low of 3285-3275 below. However, if the 3300 mark can be effectively defended, then the possibility of maintaining the consolidation of 3300-3345 in the evening may be maintained. Therefore, it is not recommended to easily participate in transactions at the current position in the evening. It is mainly advisable to wait and see and pay attention to the breakthrough of the 3300 mark.
My premium privileges are about to expire, and subsequent trading strategies and analysis will be published in the group.
Waiting for Gold to Dump| Area Of OpportunityWe can clearly see the overall trend of Gold, which is bearish. As the price action we see bearish FVA (Fair Value Areas/Swing Lows) being run. The anticipation is to wait for the latest Swing low to be ran, before looking for entries.
Why?
Because, the path towards our nearest POI (Point Of Interest) will have a low resistance. Meaning price might expand lower smoothly.

XAU/USD: Golden Breakout to $3400?XAU/USD: Golden Opportunity Ahead XAU/USD is testing a key support at $3345, with a bullish setup forming on the 1-hour chart. Entry at $3345 offers a high-probability trade, targeting $3400 where the next resistance aligns. Set a stop loss at $3320 to manage risk below the recent support. A break above $3350 with strong volume could confirm the move. Watch for US dollar weakness as a catalyst. Trade smart!
#XAUUSD #GoldTrading #ForexSignals #TechnicalAnalysis #MarketAnalysis #DayTrading

Gold Bullish idea so far . 23.7.2025we got the last bullish zone at 3375- 3326 ( marked as BC )
price must respect that zone to go for the next target at around 3500 .
This is ONLY the Bullish Idea .
price must Break 3454 to activate new ATH sequence targeting 3850 zone .

buy idea xauusdxauusd buy scenario
demand created we can long xauusd untill we reach the next supply
XAUUSD 4Hour TF - July 27th, 2025XAUUSD 7/27/2025
XAUUSD 4 hour Neutral Idea
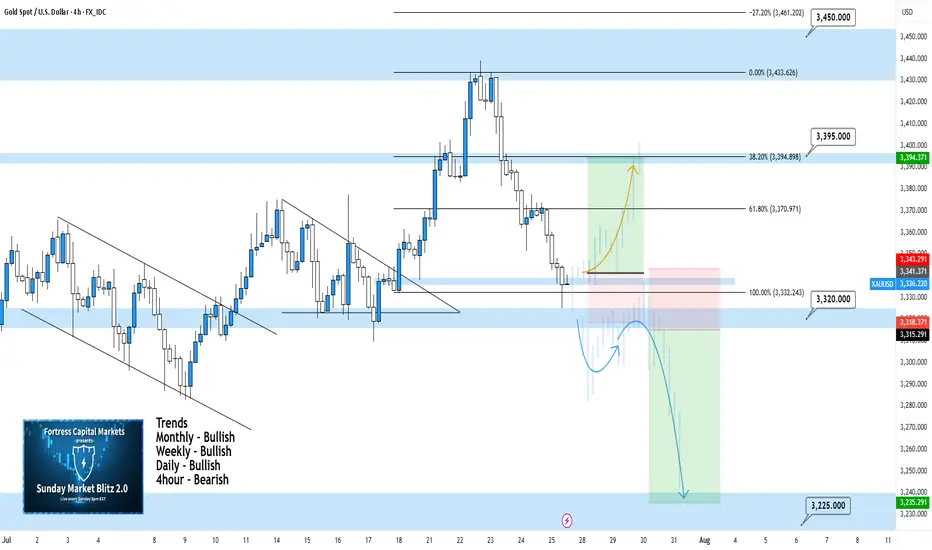
Monthly - Bullish
Weekly - Bullish
Daily - Bullish
4hour - Bearish
Last week we saw a perfect setup playout and then it retraced 100% to close out the week. This is looking more bearish on the 4Hour timeframe now but we need to see how price action reacts at the 3,320 support zone first.
Here are two potential scenarios we want to see for the week ahead.
Bullish Reversal - If we are to see gold as bullish again we would ideally like to see some consolidation at the current level followed by strong bullish conviction.
We need to see convincing price action before we can begin targeting higher. Consolidation + Bullish conviction will be our best chance at a long position.
Bearish Continuation - The 4hour sure looks bearish but will it sustain? Looking ahead into the week we want to see price action push below 3,320 with bearish structure below.
I would also like to see a pattern or a few hours to a day of consolidation below 3,320. If this happens we can begin to target lower toward major support levels like 3,225.
BUY XAUUSD 24.7.2025Counter-trend trade order: SELL at H4~H1~M15
Type of entry: Limit order
Reason:
- If the price breakout at 3,391 confirming the uptrend.
Note:
- Management of money carefully at the price of last top (3,390)
Set up entry:
- Entry sell at 3,383
- SL at 3,379
- TP1: 3,390
- TP2: 3,400
Trading Method: Price action (No indicator, only trend and candles)

I was bluffed?Idk >:’(
TradingView isn’t carrying my vibe right now, it just told me how blunt I was with my message. So accept this as a random interaction with me :)

Seize the opportunity to go long when the price falls backFrom a technical analysis, the current bullish trend is clear and has continuity. In recent trading days, the market has shown the characteristics of "easy to fall but difficult to rise". Even if there is a correction, it is difficult to sustain. The price will rise quickly after a slight adjustment. Therefore, going long with the trend has become the core strategy, and any decline is an opportunity to arrange long orders. In terms of support, the daily level near 3400 constitutes a key support. If the price is close to this area, you can arrange long orders; the hourly level near 3420 also has a supporting role, which is suitable for entering the market to go long. For short-term operations, Mr. Weng suggested waiting for the price to rebound above 3450 before considering shorting in the short term. Judging from the current strong pattern, if 3450 is effectively broken, it is only a matter of time before it will rise to 3500. Therefore, it is not advisable to be overly bearish. Strict stop loss and trend trading are the prudent strategies.

XAUUSD - 29/7/25 - continued bearish There was quite strong bearish momentum yesterday during the US session. Going into Asian session and London session today there is a consolidation bullish. There is a 4 hour zone marked out where i am looking for a retest and continuation bearish to a key zone below where a reversal pivot is expected and then continuing bullish with the larger trend.

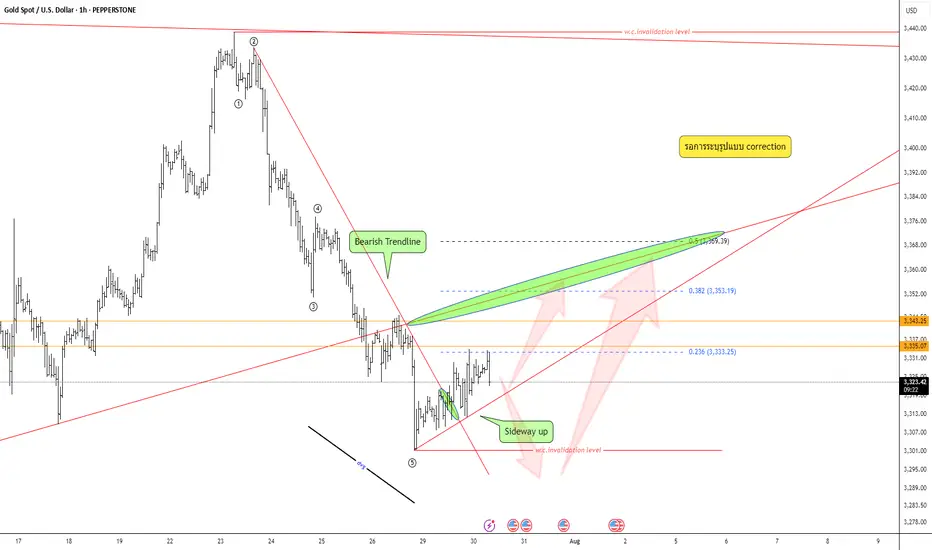
Keep an eye on the correction pattern —Quick Take:
- Strong bearish move, but wave structure still unclear — not a confirmed impulse.
- Bear trendline has broken; market now leaning toward sideways-up.
- Divergence is visible.
Plan:
Wait for correction pattern → confirm with your system → execute only with full data and strict risk management.
XAUUSD BUYS PROJECTION Hey everyone wow is been long since I posted here I can say for sure trading has never been so tougher for me cuz am tryna refine my edge and I miss posting and sharing my ideas here so this is my analysis on Gold after seeing Gold rejected a strong resistance zone and price keeps pushing down tho I missed the sells but market is always full of opportunity and here are my zones to take buys from,mind you these zone are very strong support zones that mostly buyers get in the market so I will be waiting for price to get to the first zone which is the green and the second is for scaling in after placing the first on breakeven and yes I will update you guys…..

GOLD Analysis : XAUUSD Major Bullish Demand Zone🧠 Market Structure Context (MMC Framework)
Gold has recently shown a clean structural decline from its local highs within a well-defined ascending channel. This analysis highlights a reaction zone-based playbook, focusing on high-probability reversal scenarios guided by institutional footprints, volume reaction points, and MMC logic.
We’re currently trading near a previous reversal zone, where history tells us the market tends to shift behavior. Let’s dissect the key components.
📊 Key Technical Components
🔸 1. Ascending Channel Breakdown
The entire uptrend was respecting a well-established bullish channel until the recent drop violated the midline structure. This breakdown confirms a temporary bearish phase, with price breaking cleanly below a QFL base (Quick Flip Level)—a level where price reversed sharply before, which now acts as a major supply zone.
Psychological Insight: Channels give clues about momentum. Breaking below the lower band shows the market is preparing for a retest or a deeper liquidity hunt.
QFL Breakdown: Once broken, previous buyer confidence is shaken—inviting sellers to test demand zones.
🔸 2. Previous Reversal Zone (PRZ) Reaction
Currently, price is hovering inside the blue shaded Previous Reversal Zone, where bullish pressure previously kicked in. It’s a minor demand zone, but critical due to historical reaction. The projected structure shows a bounce from this area before deciding next direction.
MMC Insight: The first test of PRZ often leads to an initial reaction. But deeper liquidity lies just below in the major green demand zone.
🔸 3. Major Demand Zone + Volume Burst Area (The Real Magnet)
Below the PRZ lies the major reversal block—highlighted in green. This zone is significant because:
It aligns with a high-volume burst in the past, confirming institutional orders.
It's a cleaner structure level for smart money re-entry.
It also provides room for the “liquidity sweep” (stop hunt), collecting sell stops before a proper reversal.
💡 Expected Play: Price may fake out below PRZ, enter the major demand, and then initiate a multiple-leg bullish rally. Patience is key here.
🛠️ Trade Structure Outlook
✅ Scenario 1 – Aggressive Buyers (Marked "1"):
Buy from the current PRZ zone around $3,305–$3,315
Target: $3,340 (Minor Resistance)
Risk: Slippage into deeper demand zone
Stop-loss: Below $3,295
✅ Scenario 2 – Safer Entry from Major Demand (Marked "2"):
Let price dip into $3,270–$3,280 zone (green box)
Look for reversal candles or liquidity sweeps on lower timeframes
TP1: $3,330
TP2: $3,365 (Major Resistance)
📈 Resistance Levels to Watch:
Minor Resistance: $3,340 – Expect short-term pullbacks or hesitation.
Major Resistance: $3,365 – Key target for swing traders and potential reversal zone.
🔍 MMC Concepts in Action
✅ Channel Logic: Breakdown implies momentum shift—watch for retests.
✅ QFL: Previous bounce zone broken = supply now overhead.
✅ Volume Burst Zone: Strong historical reaction = institutional interest.
✅ Zone-to-Zone Trading: Instead of random entries, focus on logical zone interactions.
🧭 Conclusion – Path of Probability
Gold is currently in a transitional phase—shifting from bearish correction to potential bullish revival. Patience will reward those who wait for PRZ rejections or deeper liquidity taps. The MMC framework helps frame this market not as chaos, but a map of strategic reaction points.

Xauusd bullish from key support zone at 3319📊XAUUSD Bullish Forecast
4H Timeframe Analysis
Gold is currently respecting the ascending channel and has completed a healthy retracement to the support zone at 3319.
Now showing strong bullish momentum from this level
📌Key Resistance Levels Ahead:
🔹3363 – First Supply Zone
🔹3423 – Second Supply Zone
🔹3445 – Major Supply Zone
Outlook:
As long as price holds above 3319, we remain bullish with targets at the supply zones.
Watch for clean bullish structure continuation inside the channel
#XAUUSD #Gold

LONG XAUUSDLONG XAUUSD, XAUUSD is currently on support, long if fails to break and short if breaks and retests
