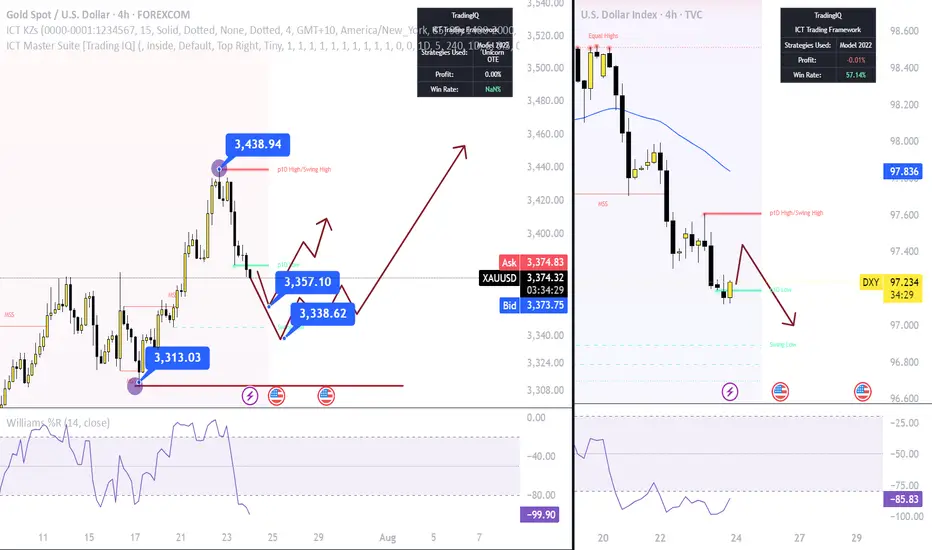
XAUUSD is still bearish Gold is currently below rising channel and holding the Range of 3320-3335,although yesterday implusive drop is incompleted without testing 3290-3280
What's possible scanarios we have?
▪️I'm still on bearish side till 3345 is invalidated and candle flips above. I open sell trades at 3332 again and holds it .
if H4 & H1 candle close above 3345 I will not hold or renter sell.
▪️Secondly if H4 candle closing above 3345 this down move will be invalid and Price-action will reached 3370.
XAUUSDG trade ideas
CHECK XAUUSD SIGNAL READ CAPTAINEntry Point: Around 3326.000 3329.000
Stop Loss: Around 3314.000
🎯 Target Levels
Take Profit 1:
3343.000
Take Profit 2:
3365.000
last target
3386.000

Gold repeatedly tested lows. Will it break through?On Monday, the Asian market opened low and rose in the early trading. In the European trading, it rose to around 3345. The European trading was under pressure and fluctuated. The US trading began to accelerate its decline, and the lowest point reached around 3302. Then it continued to fluctuate in the range of 3300-3320.
On July 27, the United States and the European Union reached a framework trade agreement; the agreement reduced market concerns about the global economic recession, promoted the attractiveness of risky assets, and boosted the stock market and the US dollar. Although Trump has repeatedly pressured for a substantial interest rate cut, the market has strong expectations for a September interest rate cut. The current expectation of maintaining a stable interest rate dominates the market, coupled with the strength of the US dollar, which puts gold prices under downward pressure in the short term.
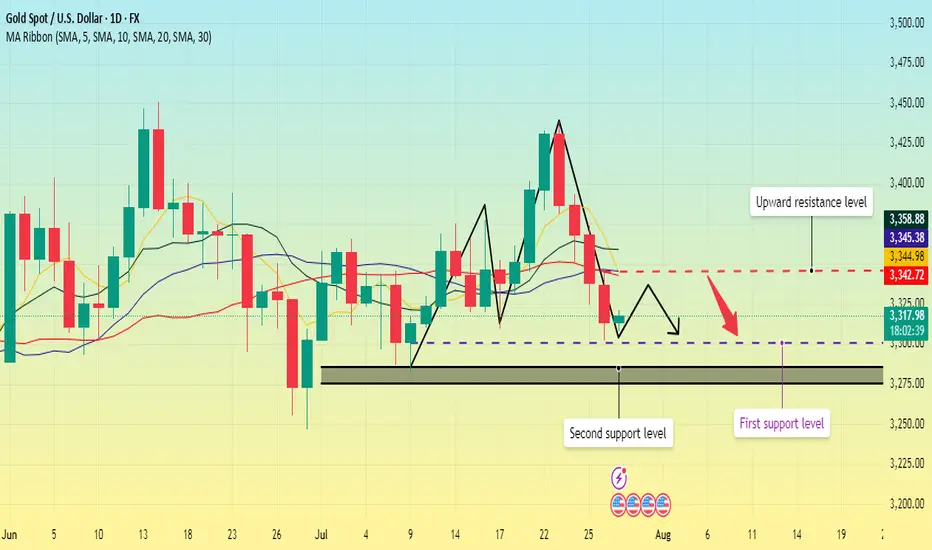
Gold opened low in the early trading on Monday and then rebounded to recover the losses, but then fell below the low again, and the daily line closed in the negative, and now it has formed a four-day negative decline. MA5 and 10-day moving averages form a dead cross, and there is a downward turn.
The focus on the upper side is around Monday's high of 3345, which is also near the current position of MA5, 20, and 30-day moving averages. Below this position, gold is weak; if it breaks upward, it is necessary to prevent the possibility of a rebound correction.
The lower support first focuses on the 3300 integer mark; secondly, focus on the area around 3285-3275.
Operation strategy:
Short near 3340, stop loss 3350, profit range 3320-3300;
Long near 3300, stop loss 3290, profit range 3320-3340.
Before the release of US data on Tuesday, you can maintain this operation strategy; after the data is released, adjust the strategy based on the impact of the data.
July 29, 2025 - XAUUSD GOLD Analysis and Potential OpportunitySummary:
The downtrend continues, but a technical rebound is possible today.
Keep a close eye on the 3310 level — if price holds, bulls may fight back and we look for long setups on pullbacks.
If 3310 is broken, the bearish momentum is likely to extend, and we shift to selling on failed rallies. The next significant support lies at 3283.
🔍 Key Levels to Watch:
• 3384 – Resistance
• 3375 – Key resistance
• 3365 – Resistance
• 3345 – Resistance
• 3320–3325 – Key resistance zone
• 3310 – Critical support
• 3300 – Psychological level
• 3283 – Major support
• 3275 – Support
• 3265 – Support
📈 Intraday Strategy:
• SELL if price breaks below 3310 → target 3305, then 3300, 3290, 3283
• BUY if price holds above 3320 → target 3325, then 3336, 3345, 3350
👉 If you find this helpful or traded using this plan, a like would mean a lot and keep me motivated. Thanks for the support!
Disclaimer: This is my personal view, not financial advice. Always use proper risk control.
Gold analysis Gold (XAU/USD) Technical Analysis
Date: July 28, 2025
Market Context
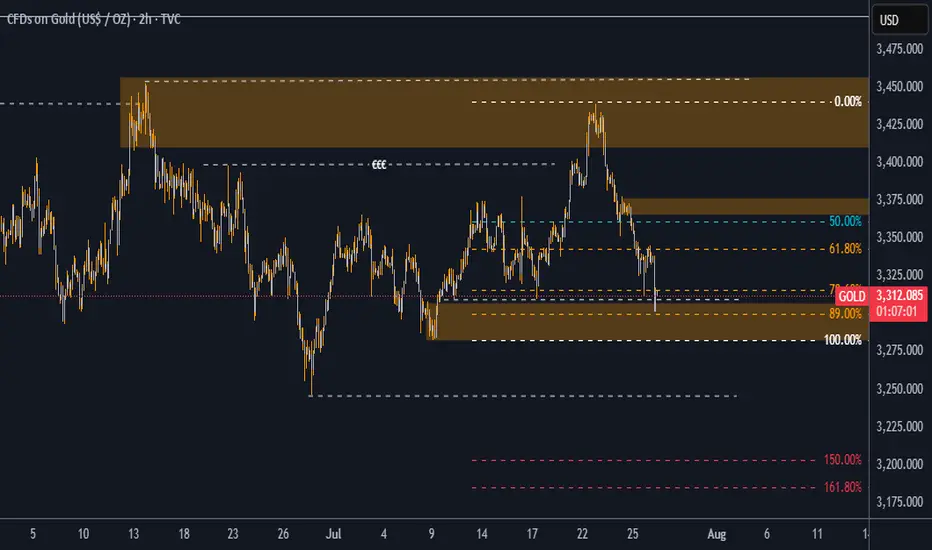
Gold (XAU/USD) is currently trading at $3,313.01, showing a modest gain of +0.32% on the day. From a Smart Money Concepts (SMC) perspective, price action is now positioned at a high-probability demand zone, presenting an attractive opportunity for long positions.
Key Technical Observations
Liquidity Grab at $3,308
Price has recently swept the liquidity resting below $3,308, indicating the possible completion of a stop-hunt move orchestrated by institutional players. This move created an ideal setup for a bullish reversal from a zone where weak longs have been shaken out.
Discounted Price Zone (89% Fibonacci)
The market has retraced deeply into a discounted region, reaching the 89% Fibonacci retracement level of the most recent bullish leg. This zone coincides with a previously identified demand block, enhancing the confluence for potential bullish continuation.
Market Structure & Order Blocks
The current structure shows a bullish intent with price revisiting a bullish order block that previously led to a strong rally. The reaction from this block is key—holding above $3,300 would confirm buyers stepping in with conviction.
Internal Liquidity Void (Imbalance)
A visible inefficiency (price imbalance) exists between $3,345 and $3,398, acting as a magnet for price in the short-to-mid term. This inefficiency aligns perfectly with SMC principles that favor price filling these voids.
Bullish Targets
If price holds and confirms bullish intent from the current zone, we expect a move toward the following key levels:
Target 1: $3,345
This is the midpoint of a previous consolidation range and also lies just above the 50% Fibonacci level.
It also aligns with a minor supply area and could serve as a first TP level.
Target 2: $3,398
This is the upper bound of a key supply zone that previously initiated a strong sell-off.
It coincides with the 0.00% Fib retracement, marking the origin of the most recent bearish leg.
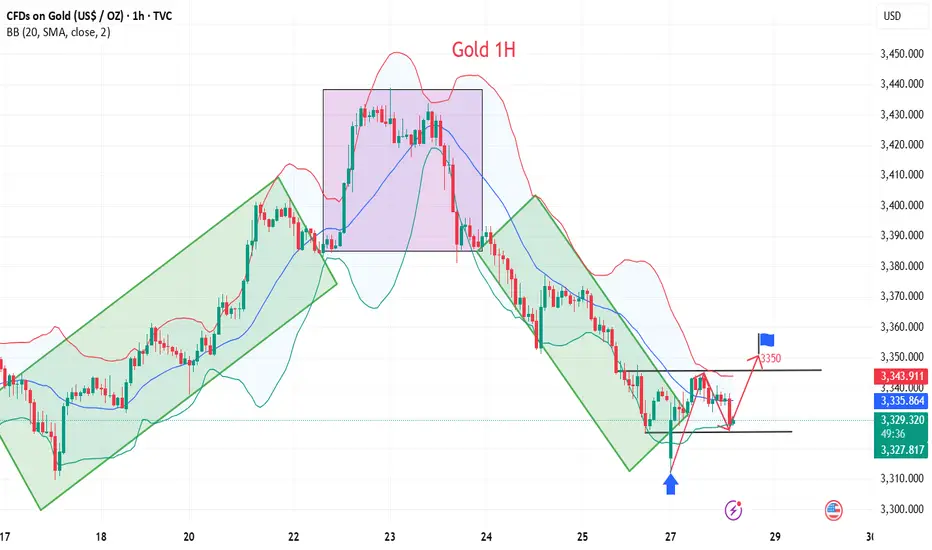
Gold short-term rise waiting for breakthrough
💡Message Strategy
During the Asian trading session, gold prices rebounded slightly from $3,320, filling the short gap at the start of the new week. As investors chose to stay on the sidelines before the Fed's two-day monetary policy meeting, the bullish force of the US dollar temporarily weakened, providing support for gold, an interest-free asset.
However, with the 15% tariff agreement between the United States and Europe and the positive progress of trade easing between the United States, Japan and the United States, market risk appetite has rebounded, weakening the appeal of gold as a safe-haven asset.
According to market surveys, "The current optimistic atmosphere of trade has weakened the safe-haven demand for gold, while the weakening of the US dollar has provided support for gold prices. The two forces offset each other, causing gold to fluctuate."
Investors are focusing on the FOMC meeting to be held on Tuesday. Although Trump continues to pressure the Fed to cut interest rates, the market generally expects that the interest rate will remain unchanged at this meeting because the US labor market remains strong.
In addition to the interest rate decision, this week will also usher in the US second quarter GDP estimate, PCE price index and non-farm payrolls report, all of which may have a significant impact on gold.
📊Technical aspects
From the technical trend, gold triggered a rapid correction after breaking below the lower edge of the short-term rising channel and the 50% Fibonacci retracement level last week. The current gold price stabilized in the $3,320 area and received some buying at the 61.8% Fibonacci support.
However, it is worth noting that the 200-period moving average on the 4-hour chart is at $3,350, which constitutes an important technical resistance for a short-term rebound. On the contrary, if gold breaks through the $3,350 level, gold will continue to develop a bullish pattern.
From the technical trend, gold triggered a rapid correction after falling below the lower edge of the short-term rising channel and the 50% Fibonacci retracement level last week. The current gold price stabilized in the $3,320 area and received some buying at the 61.8% Fibonacci support.
However, it is worth noting that the 200-period moving average on the 4-hour chart is at $3,350, which constitutes an important technical resistance for a short-term rebound.
On the contrary, if gold breaks through the $3,350 line, it will be expected to attack the $3,371-3,373 area in the short term, and further look to the key pressure levels of $3,400 and $3,440.
💰Strategy Package
Long Position:3320-3325,SL:3300,Target: 3350

LONG ON GOLD (XAU/USD)Gold is at a nice demand level with the dollar currently falling.
I will be buying gold looking to make over $102 move to the previous high.
Thats over 1000 pips on gold.

XAUUSD long day trade idea hello
day trading idea long up to 3372-3383 price zone
fibonaci levels , maybe 3390

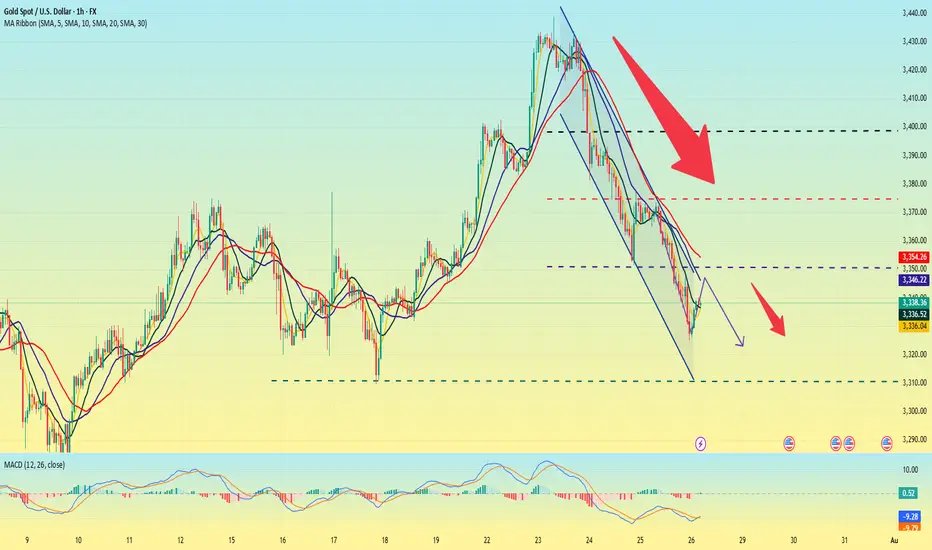
XAUSD We expecting this week the gold will be bearish becouse of the braking trend line and I wish you guys will took advantage of this and thank me latter

XAUUSD Gold closed bearish and I’ll continue looking for sells. I’d prefer gold to retrace and create a LH and continue selling towards 3310. Last time price was around 3310, it had a massive bullish run so that’ll be the only area I’d sell to unless price breaks that support.

Gold is going down. It may continue next week.On the last trading day of this week, the bears attacked strongly and continued to refresh the recent lows, reaching the lowest point near 3325 before stopping.
From Monday's 3345 to 3440, it closed near 3337. This week, it also walked out of the large range roller coaster pattern, and all the strengths in the previous period did not exist. Under the continuous downward trend, the bulls were also vulnerable, and there was not even a strong rebound, which indirectly explained the strength of the bears in the short term.
As for the current trend, the bears are likely to continue to be strong, and before there is a symbolic upward breakthrough, we still need to maintain the idea of shorts to operate. The current upper pressure is maintained near 3350, which is also the bottom position touched for the first time in the previous period. It is possible that it will be transformed into a top-bottom conversion pattern; and the strong support level below is near 3310.
When the Asian market opens next Monday, we need to pay close attention to whether there is a gap problem on both the bulls and bears. After three consecutive negative daily lines, all the moving average systems have been broken, and it is also likely to form a resonance pressure pattern. On Monday, gold will first touch around 3350 and continue to short. The profit range will be around 3330-3320, and the stop loss will be 3360. If the European session is stronger, you can adjust the point before the US session.
XAUUSD – healthy correction, ready to bounce from 3,338Gold is retracing within an ascending channel after facing rejection at the FVG zone near 3,402.800. This pullback is seen as a healthy correction, with confluence support around 3,338, which previously acted as a springboard for bullish momentum.
As long as price holds above this zone, a rebound toward 3,402 remains likely.
Primary scenario
Buy zone: 3,338
Target: 3,402
Invalidation: Break below 3,320
Note
Weak volume near the FVG zone may cause short-term consolidation, but the broader trend still favors buyers.

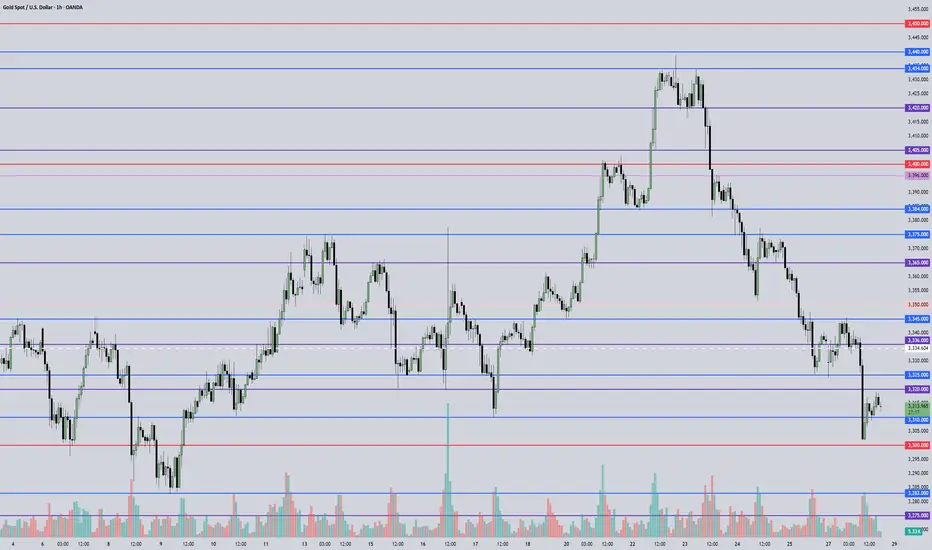
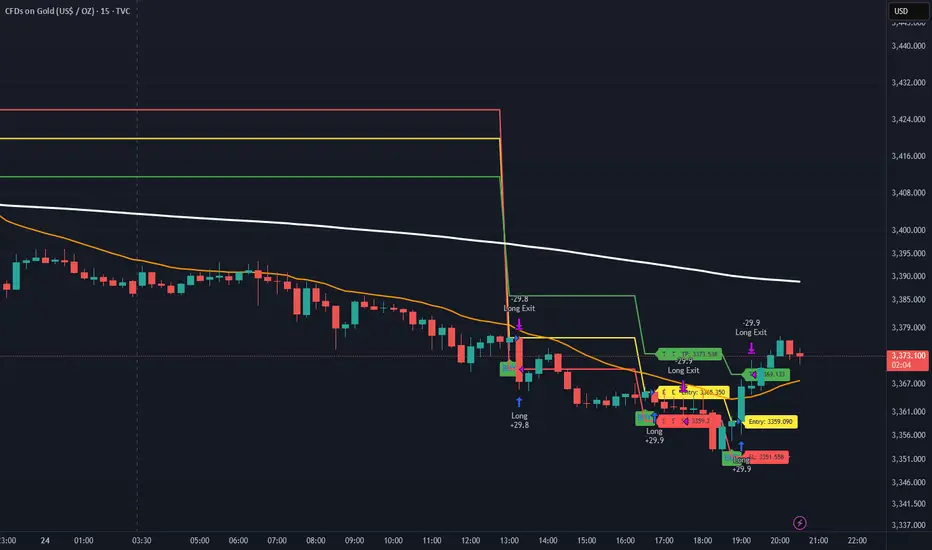
XAUUSDXAUUSD Updated in 15M :
The gold signal is marked on the chart based on the latest price changes and the supply and demand in the market. These points include the entry point, stop loss, and take profit
Welcome Back! Gold Trading Strategy & Key Zones to WatchIn this week’s welcome back video, I’m breaking down my updated approach to XAU/USD and how I plan to tackle the Gold markets in the coming days. After taking a short break, I’m back with fresh eyes and refined focus.
We’ll review current market structure, identify key liquidity zones, and outline the scenarios I’m watching for potential entries. Whether you’re day trading or swing trading gold, this breakdown will help you frame your week with clarity and confidence.
📌 Covered in this video:
My refreshed trading mindset after a break
Key support/resistance and liquidity zones
Market structure insights and setup conditions
What I’ll personally avoid this week
The “trap zones” that might catch retail traders off guard
🧠 Let’s focus on process over profits — welcome back, and let’s get to work.

XAUUSD Traders - Turn Chaos into Pips with This StrategyHello Traders,
Struggling to trade XAUUSD due to its high volatility? Taking small profits but suffering big losses?
We’ve got your back.
Introducing Gold Sniper — a high-probability strategy specially crafted for XAUUSD traders. With a 65%+ win rate and a consistent 1:1.33 risk-reward ratio, it’s designed to help you catch sharp moves with confidence.
🚨 Live Performance Highlights:
Today’s Trades:
Signal 1
🟢 Buy @ 3365.350
🔴 SL @ 3359.209
🟢 TP @ 3373.538
❌ Result: SL Hit → 61 Pips Loss
Signal 2
🟢 Buy @ 3359.090
🔴 SL @ 3351.558
🟢 TP @ 3369.133
✅ Result: TP Hit → 75 Pips Profit
📊 Net Profit Today: +13 Pips
📅 Yesterday’s Profit: +150 Pips
✅ Gold Sniper helps you:
• Avoid fake breakouts
• Catch real momentum
• Stick to disciplined entries and exits
🎯 Want to boost your trading accuracy?
📩 DM us now to get access and start using Gold Sniper directly on your TradingView chart.
If you find this valuable, like the idea and show your support. Let’s grow together!
Happy Trading,
InvestPro India

XAUUSD BUYWatching how price is reacting here. Few hours early from NY open but if this 4 hour zone holds as support, could see a bull move to test the break.

Trading Idea XAUUSD 🎯 Trade Ideas Based on Structure
1. Long Reversal Play (Buy)
📍 Entry: If price retests the support zone around 3,356–3,366 and shows bullish confirmation (e.g. bullish engulfing, pin bar)
🎯 Target: 3,390–3,402 (resistance zone)
🛡️ Stop Loss: Just below 3,355
💡 Why? Buying into support with confirmation aligns with the projected rebound idea
2. Sell into Resistance
📍 Entry: If price rallies to 3,390–3,402 and stalls with weak candles or bearish divergence
🎯 Target: Back to support zone (~3,366 or lower)
🛡️ Stop Loss: Above 3,405
💡 Why? Fading into resistance follows the broader trend while using the shaded zone for timing
3. Breakout Trade (Buy)
📍 Trigger: If price breaks cleanly above 3,402 and closes with strong momentum
🎯 Target: Look toward next resistance (~3,410+)
🛡️ Stop Loss: Below breakout candle (~3,390)
💡 Why? Signals a trend shift or strong bullish move against the recent downtrend
🧠 Smart Trading Tips
Let the candles lead the decision—watch for confirmation before jumping in
Stick to the higher probability zones and avoid overtrading in the middle
Use volume or RSI to filter false breakouts or weak entries

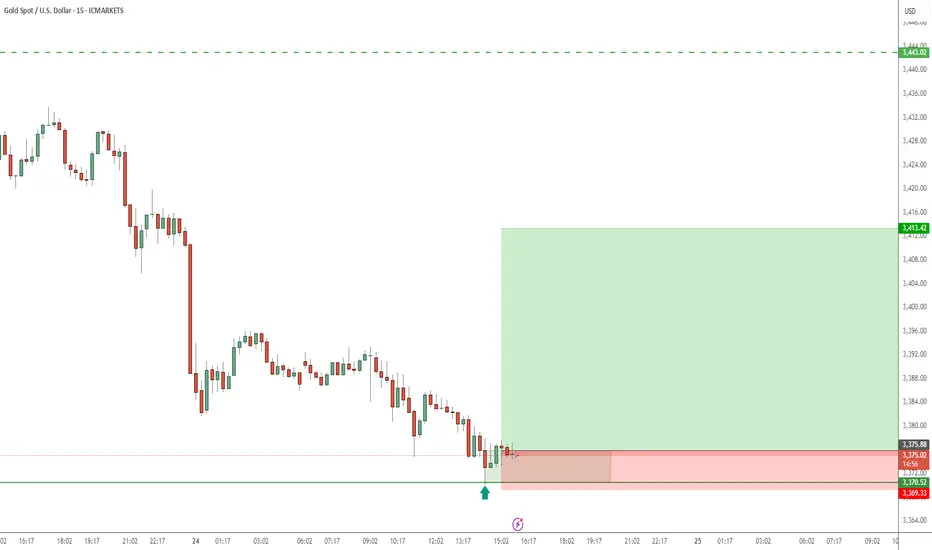
Gold Exhibiting Weak Bearish Momentum – Is a Rebound Imminent?Gold Exhibiting Weak Bearish Momentum – Is a Rebound Imminent?
The 30-minute chart reveals gold prices in a mild downtrend, but the sluggish decline hints at weakening bearish pressure. This could set the stage for a temporary price recovery before any further downward movement.
Critical Insights:
- Fading Bearish Strength: The downtrend persists, but its slowing pace suggests seller exhaustion.
- Key Support Zone: With prices hovering near a major support area, a bullish reversal becomes plausible.
- Upside Potential: A resurgence in buying momentum may propel gold toward 3,394.60, a significant resistance level.
Market Dynamics:
1. Possible Short-Term Reversal: Shallow bearish trends near support often precede upward corrections.
2. Bullish Opportunity: A breakout past nearby resistance could fuel a rally toward 3,394.60, creating a swing trade setup.
3. Downside Risk: If support fails, the bearish trend may extend, though weak selling pressure limits immediate declines.
Strategic Approach:
- Entry Consideration: Long positions near current support levels could capitalize on a rebound.
- Risk Management: A drop below support would negate the bullish outlook, warranting a stop loss.
- Confirmation Signals: Bullish candlestick formations or increasing volume would strengthen reversal prospects.
Concluding Thoughts:
Gold’s tepid bearish momentum near a crucial support level raises the likelihood of a short-term bounce. Traders should watch for confirmation—if the recovery gains traction, 3,394.60 may come into play. Conversely, a support breakdown could renew downward pressure.
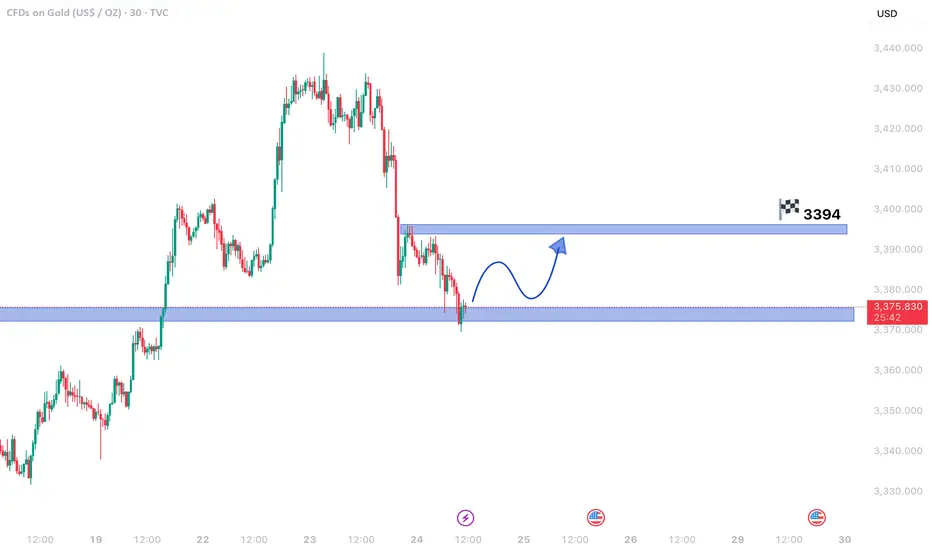
GOLD IN A WEAK BEARISH MOVE IN 30M TIME FRAME CHARTGold in a Weak Bearish Move – Temporary Rebound Ahead?
Gold prices are currently displaying a weak bearish momentum on the 30-minute chart, suggesting that the downtrend may be losing steam. Despite the downward movement, the sluggish pace indicates that sellers lack strong conviction, which could lead to a short-term price recovery before any further decline.
Key Observations:
- Weak Bearish Trend: The price is falling, but with decreasing momentum, often a sign of exhaustion among sellers.
- Critical Support Level: Gold is trading near a major support zone, where buying interest could emerge, triggering a bounce.
- Potential Rebound Target: If buyers step in, the price could rise toward 3,394.60, a key resistance level.
Market Implications:
1. Short-Term Reversal Likely: Weak bearish moves often precede temporary rallies, especially near strong support levels.
2. Bullish Scenario: A breakout above immediate resistance could push gold toward 3,394.60, offering a swing trading opportunity.
3. Bearish Continuation Risk: If support breaks, the downtrend may resume, but the current lack of strong selling pressure reduces immediate downside risks.
Trading Strategy:
- Buying Opportunity: Traders might consider long positions near support, targeting 3,394.60.
- Stop Loss: A break below the current support level would invalidate the rebound setup.
- Confirmation Needed: Watch for bullish candlestick patterns or rising volume to confirm the reversal.
Final Thoughts:
While gold remains in a short-term bearish phase, the weak downside momentum and proximity to support suggest a possible pullback. Traders should monitor price action closely—if the rebound holds, 3,394.60 could be the next target. However, a failure to hold support may extend the decline.
*Disclaimer: This analysis is for informational purposes only. Trade with proper risk management.*

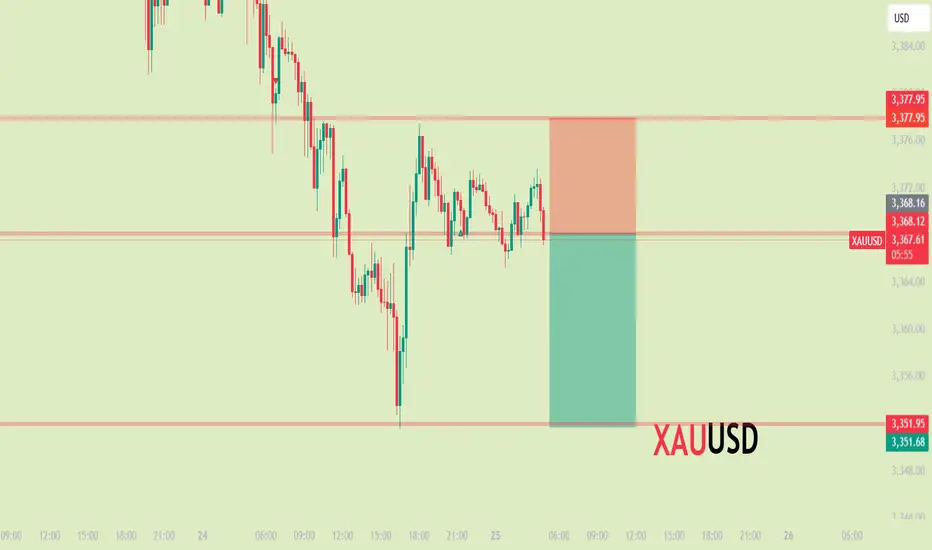
Gold at a Critical Reversal Zone – Waiting for Structural Break 📉 Gold Outlook – Corrective Dollar Strength & Potential Reversal Zones
🧭 Market Structure-Based Outlook with Multi-Timeframe Confluence
Gold is currently experiencing a controlled decline, primarily driven by a short-term corrective appreciation in the U.S. dollar.
This dollar strength is likely temporary and is expected to reverse toward the 3370–3354 zone — a technically significant area marked by previous liquidity sweeps and imbalance fills.
🔍 Technical Setup:
Bias (HTF): Bullish
Current Move (LTF): Corrective
Key Observation: No shift in long-term market structure on higher timeframes; price action remains within a bullish regime.
✅ Strategic Trade Plan:
We will not engage prematurely.
The optimal entry will only be considered upon a confirmed bullish market structure shift on the 15-minute timeframe — ideally a BOS (Break of Structure) followed by mitigation.
🛒 Entry Zone:
Around 3370 – 3354, contingent upon a clean bullish break in structure.
⛔ Invalidation Level (SL):
Below 3308 (structure invalidation + liquidity trap zone)
🎯 Profit Targets (Scaled):
TP1: 3400
TP2: 3430
TP3: 3500 – 3560
TP4 (Extended): 3600 – 3720
(Use partials & scale accordingly based on trade management plan)
🧠 Fundamental Confluence:
The macro picture remains supportive of higher gold prices.
Anticipated dovish shifts from the Federal Reserve, particularly in the form of rate cuts or forward guidance softening, may act as the macro catalyst for continuation toward new highs.
🛎 Conclusion:
While the current correction appears sharp, it lacks HTF structural reversal characteristics.
Patience and precision are essential — no entry should be considered without a 15m bullish break in structure.