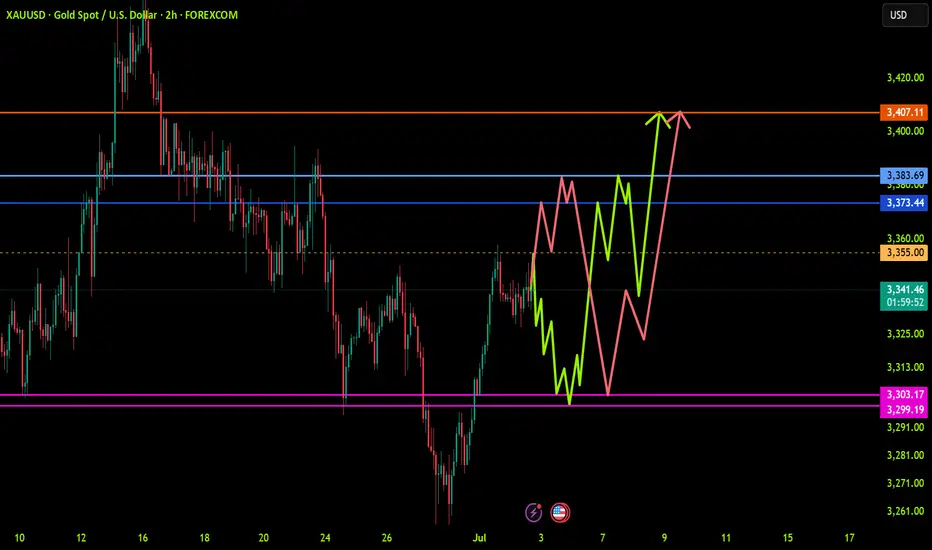
XAUUSDXAU/USD Trade Analysis – buy Setup
📍 Trade Idea: buy Gold (XAU/USD)
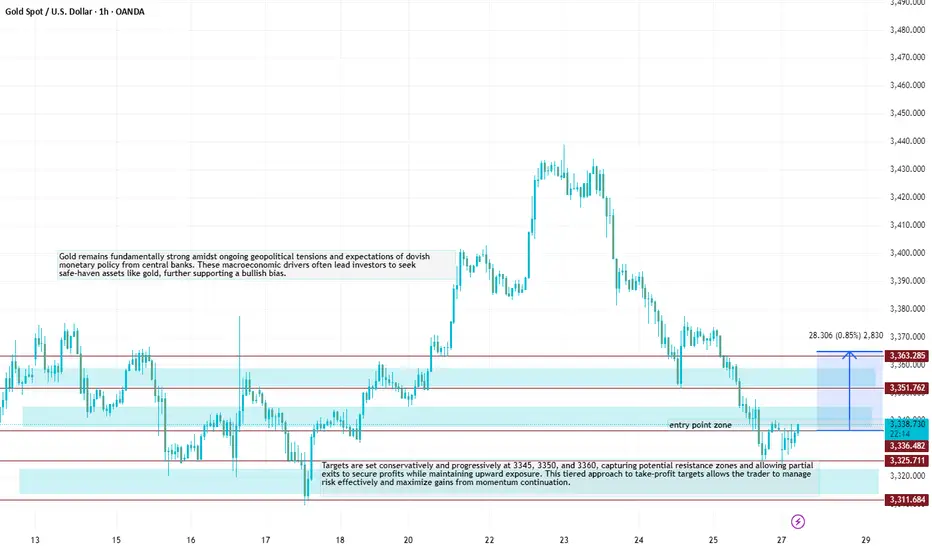
Entry Zone: 3338/3336
Stop Loss: 3326..00/Above key resistance zone)
Take Profit Levels:
🎯 TP1: 3345
🎯 TP2: 3350
🎯 TP3: 3360
Targets are set conservatively and progressively at 3345, 3350, and 3360, capturing potential resistance zones and allowing partial exits to secure profits while maintaining upward exposure. This tiered approach to take-profit targets allows the trader to manage risk effectively and maximize gains from momentum continuation.
Gold remains fundamentally strong amidst ongoing geopolitical tensions and expectations of dovish monetary policy from central banks. These macroeconomic drivers often lead investors to seek safe-haven assets like gold, further supporting a bullish bias.
XAUUSDG trade ideas
July 28, 2025 - XAUUSD GOLD Analysis and Potential OpportunitySummary:
Price action remains weak after last week's bearish close, with 3440 acting as a clear resistance level. While bulls have lost momentum, bears have not yet taken full control — 3310 and 3283 are key support zones to watch.
Price is currently reacting near 3339,
• Above 3345, the plan is to buy on pullbacks.
• Below 3332, switch to selling rallies.
Expect a potential bounce after the recent sharp decline from 3420 to 3385, but stay cautious near resistance zones like 3385–3400, as consolidation or rejection may occur.
🔍 Key Levels to Watch:
• 3384 – Resistance
• 3375 – Key resistance
• 3365 – Resistance
• 3345 – Intraday key resistance
• 3325 – Intraday key support
• 3310 – Support
• 3300 – Psychological level
• 3283 – Critical support
📈 Intraday Strategy:
• SELL if price breaks below 3332 → target 3325, then 3320, 3310, 3300
• BUY if price holds above 3345 → target 3350, then 3365, 3375, 3384
👉 If you find this helpful or traded using this plan, a like would mean a lot and keep me motivated. Thanks for the support!
Disclaimer: This is my personal view, not financial advice. Always use proper risk control.
Gold Trading Strategy Reference On Monday✅ Gold Market Weekly Summary
Gold prices experienced significant volatility this week and ultimately closed lower on the weekly chart, failing to hold above the key $3400 level. Although the price briefly achieved a bullish breakout earlier in the week, the rally lacked follow-through, indicating weak bullish momentum and growing market indecision from a technical perspective.
✅ Detailed Review
Gold surged by 2.4% in the first two trading days of the week, but gave back nearly 3% over the last three sessions. The reversal was primarily driven by renewed optimism surrounding trade negotiations led by former President Trump, which boosted risk appetite and dampened safe-haven demand for gold.
✅ Outlook for Next Week
Investors will closely monitor the Federal Reserve’s policy meeting scheduled for July 29–30. Market expectations suggest an extremely low probability of a rate cut during this meeting, with the likelihood of holding rates steady in September rising to approximately 40%, up sharply from around 10% a month ago.
✅ If Fed Chair Jerome Powell highlights progress in trade agreements as a reduction in economic uncertainty—thereby leaving the door open for a September rate cut—U.S. Treasury yields may fall sharply, potentially boosting gold prices. Conversely, if Powell cites rising inflation data and avoids signaling any easing at the next meeting, gold may come under renewed pressure.
✅ Technical Analysis
Gold suffered a sharp decline on Friday, breaking below the key 4-hour trendline support at the $3335 level, which we previously identified. This triggered renewed bearish momentum, and the current price action reflects a clear downtrend. Unless a firm bottom is established, the bearish trend is likely to continue.
✅ Hourly Chart Structure
Volatility between bulls and bears was apparent this week. The price followed an ascending channel during the first half of the week but reversed sharply in the latter half, erasing gains and forming a new descending channel. The $3350 level now acts as a critical pivot point and will serve as the key resistance level for bearish strategies next week.
✅ Conclusion
Given that both the 4-hour and daily charts have broken major support levels, the outlook has shifted from a mildly bullish consolidation to a trend-following bearish stance.
✅ Trading Strategy Reference:
🔰 Entry: Consider initiating short positions around the $3350 level
⛔ Stop-Loss: Place stops above $3360
🔰 Targets: Initial target at $3325; if broken, look for further downside toward the $3310 area
🔥Trading Reminder: Trading strategies are time-sensitive, and market conditions can change rapidly. Please adjust your trading plan based on real-time market conditions. If you have any questions or need one-on-one guidance, feel free to contact me🤝

Will gold continue to fall on July 25?
1. Brief analysis of gold fundamentals
The current gold price is fluctuating downward, and the core driving factors are:
Risk aversion has cooled down:
The United States and Japan reached an agreement on automobile tariffs and promoted an agreement with the European Union, easing previous global trade tensions;
The overall risk appetite of the market has increased, and safe-haven funds have withdrawn from gold.
The US dollar rebounded in stages:
The US dollar index rebounded after the previous decline, which partially offset the safe-haven appeal of gold;
Although there are expectations of interest rate cuts within the Federal Reserve, there are large differences, and the overall trend is still "wait-and-see", which has increased the volatility of the US dollar trend.
2. Technical analysis of gold
Trend characteristics:
Gold has fallen from the high of 3438 and has been under pressure for two consecutive days;
It is currently testing the 0.618 retracement support (about 3360) of the 3310-3438 increase;
The European session continued to fall. If there is a rebound before the US session, there may be a risk of "false breakthrough and real decline";
If the US session still does not rise in the early session, it is necessary to pay attention to the possible V-shaped reversal in the future.
Technical indicators:
The short-term MACD bottom divergence gradually emerges, and the probability of oversold rebound correction increases;
Important support: 3350-3340 range (once lost, it may test the lower track of the 3337 daily triangle);
Key pressure: 3393-3403 range (initial rebound resistance), stronger resistance is around 3416-3418.
III. Short-term operation strategy suggestions
✅ Main idea: shorting on rebound is the main, and long on callback is the auxiliary
Short order layout reference:
If the 3393-3403 area encounters resistance, you can try to short with a light position;
Stop loss is set above 3410, and the target is 3360-3350;
If the market breaks through 3403 strongly and stabilizes, the short order strategy needs to be suspended.
Long position layout reference:
If it drops to 3350-3340 and stabilizes, you can try short-term long with a light position;
Stop loss is set below 3335, and the target is 3375-3385;
If the market quickly breaks below 3337, wait for the lower support to stabilize before intervening.
IV. Trend warning points
If the price does not rebound significantly before the early US market, it is necessary to guard against a sudden V-shaped pull after the US market;
If it directly falls below 3340, the space below opens, it is recommended to stop loss in time and wait for new support points.
✅ Conclusion:
In the short term, gold is still in the downward correction stage, but as the technical oversold signs appear, short-term sharp pull rebound should be guarded against. It is recommended to respond flexibly in operation, pay attention to the response of key support and resistance levels, and avoid chasing up and selling down.
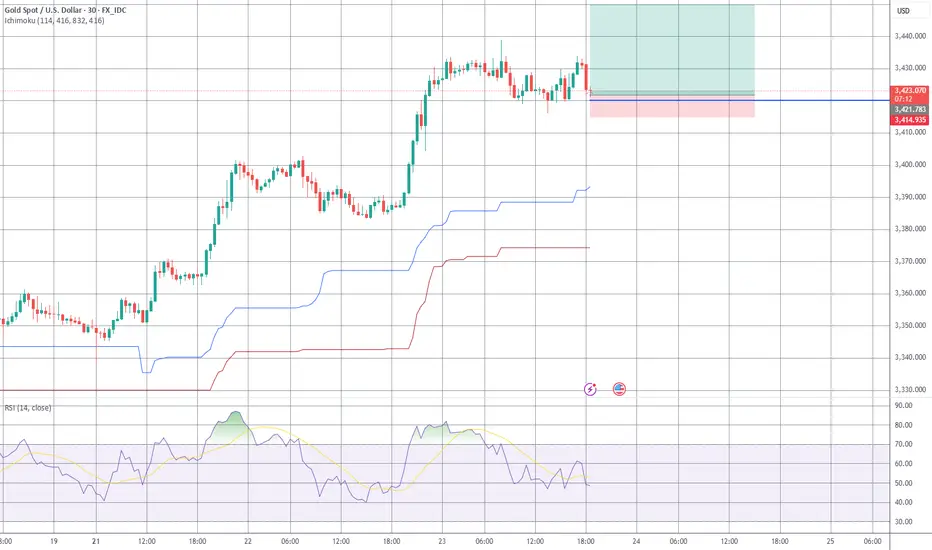
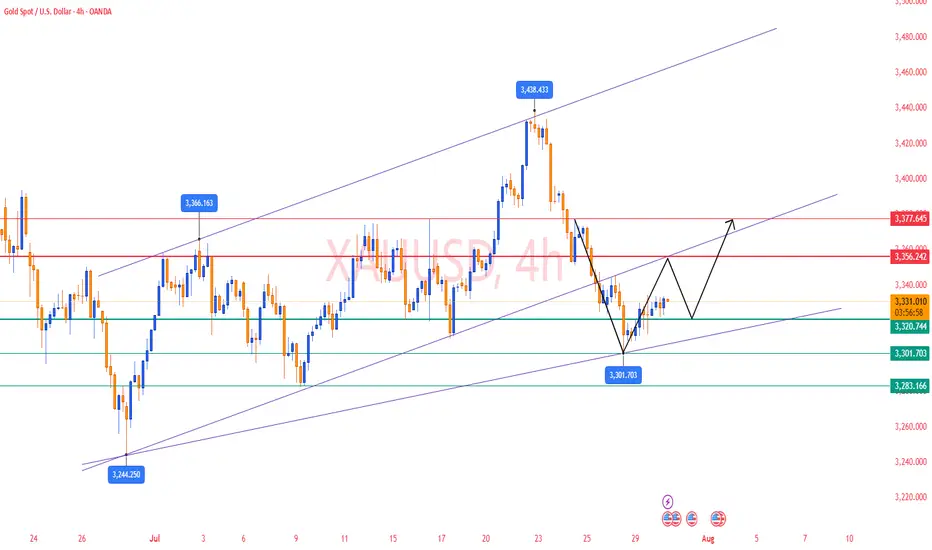
Gold Spot / U.S. Dollar (XAUUSD) - 4 Hour Chart (OANDA)4-hour chart from OANDA displays the price movement of Gold Spot (XAUUSD) from late July to early August 2025. The current price is $3,332.775, reflecting a decrease of $35.935 (-1.07%) as of 07:54 PM PKT on July 25, 2025. Key levels include a sell price of $3,332.480 and a buy price of $3,333.050. The chart shows recent volatility with a shaded support zone around $3,312.314 to $3,367.326, indicating potential price stabilization or reversal areas.

Gold to Take Support Gold at key support level, There is two chances.. where it can grab the liquidity... we will wait and watch... Cheers

GOLD The Target Is UP! BUY!
My dear followers,
I analysed this chart on GOLD and concluded the following:
The market is trading on 3354.1 pivot level.
Bias - Bullish
Technical Indicators: Both Super Trend & Pivot HL indicate a highly probable Bullish continuation.
Target - 3361.01
Safe Stop Loss - 3350.5
About Used Indicators:
A super-trend indicator is plotted on either above or below the closing price to signal a buy or sell. The indicator changes color, based on whether or not you should be buying. If the super-trend indicator moves below the closing price, the indicator turns green, and it signals an entry point or points to buy.
Disclosure: I am part of Trade Nation's Influencer program and receive a monthly fee for using their TradingView charts in my analysis.
———————————
WISH YOU ALL LUCK

XAUUSD H1 BUYING SETUPScenario:
Gold is showing strong buying momentum 📈. The best entry points are around the H1 FVG (Fair Value Gap) and Order Block (OB) zones. Wait for confirmation signals in either of these areas.
Gold could take off 🚀 from the FVG or OB. Once you see confirmation in any of these zones, take the entry ✅.
Use a small lot size and follow strict risk management rules ⚠️💰.
Stay disciplined and trade smart! 🧠📊

Gold : Sell Continuation Gold: Top Formed at Major Supply Zone 🔻 | 4H Reversal Setup
Looking for continuation after bearish BOS. Targeting clean liquidity below. SL above structure. R:R ~3:1

Gold's safe-haven attribute has lost its key pivot pointA comprehensive judgment, the current market overall defense mechanism is lifting. With the liquidity risk gradually easing, gold's safe-haven attribute has lost its key pivot point. the market preference indicators tracked show that gold as a defensive asset is being marginalized, with trading activity and capital attention both declining.
The structure of institutional positions in gold tends to be decentralized, and funds are migrating to assets with higher return expectations. This indicates that in the short term the market is not looking forward to gold out of the systematic market, but rather more inclined to use it as a hedging asset rather than the main configuration.
It is recommended that investors appropriately shrink the gold direction of the strategy exposure, to avoid high-frequency operations in the trend of the state of uncertainty. Position should be light, operation should be stable. In the future, if the system captures the signal of the refocusing of risk aversion logic, we will be the first time to issue strategy alerts.
CHECK XAUUSD SIGNAL READ THE CAPTAINEntry Point: Around 3354.000 3357.000
Stop Loss: Around 3345.000
🎯 Target Levels
Take Profit 1:
3377.000
Take Profit 2:
3395.000
last target
3415.000

XAUUSD 24/07 Bullish Reversal Potential from Falling Channel1. Price Overview & Trendline Context
Gold (XAUUSD) is currently trading around 3,369.67 USD after a notable pullback from the recent high near 3,428. A clear descending channel has formed, marking a short-term corrective move within a larger bullish trend. Price action suggests a potential reversal setup as price approaches a strong support zone around 3,340 – 3,350 USD, previously acted as demand in the breakout on July 22.
2. Fibonacci & Structure Analysis
The Fibonacci retracement drawn from the recent swing low to the top at ~3,428 reveals that the pullback has reached the 0.9 level, often seen as an exhaustion point for corrections in strong bullish trends. This area aligns with:
Key horizontal support: 3,340 – 3,350
Previous breakout zone
Volume spike at base (20.6K vs avg.)
This convergence suggests a high-probability bullish reversal setup.
3. EMA & Momentum Indicators
Although the chart primarily uses SMA 9, the structure suggests price is extended from shorter EMAs. A break above the upper boundary of the falling channel may trigger EMA crossovers, further confirming reversal momentum.
4. Trading Strategy Suggestion
Setup
Description
Buy Zone: 3,350 – 3,365 USD
Take Profit 1: 3,385 USD (short-term supply zone)
Take Profit 2: 3,428 USD (recent swing high)
Stop Loss: Below 3,340 USD
This trade follows the "Buy the Dip in Uptrend" strategy, aligning with trendline, fib support, and volume confirmation.
5. Key Resistance & Support Levels
Resistance: 3,385 – 3,428 USD
Support: 3,340 – 3,350 USD
Breakout Confirmation Level: 3,375 (channel breakout)
6. Final Insights
Gold remains in a broader bullish structure. Today’s chart shows strong technical confluence for a short-term reversal. Traders should monitor closely for breakout candles from the falling wedge/channel, preferably with volume confirmation.

XAUUSD: Trend in 2H timeframevery important levels for GOLD, we have two trends,
Please pay special attention to the colored levels.
Trends are very accurate,
>>>>>>>>>>>>>>>>>>> The setup is very sensitive <<<<<<<<<<<<<<<<<<<<<<<<
Be careful
BEST
MT
XAUUSD (Gold) Buy Setup – VSA & Fibonacci Confluence✅ Entry Zone: 3,411 – 3,404 (Key demand zone + 50%-61.8% Fib retracement)
🎯 Take Profit 1 (TP1): 3,446 (previous swing high)
🎯 Take Profit 2 (TP2): 3,452 (extension target above resistance)
🛑 Stop Loss (SL): Below 3,404 (beneath demand zone to avoid false breaks)
📊 Technical Insight:
Climactic volume seen on the initial rally signals strong professional interest in the move upward.
As price retraces, volume has decreased significantly, indicating lack of aggressive selling pressure (No Supply).
The shaded demand zone aligns perfectly with the 50%–61.8% Fibonacci retracement, suggesting a high-probability area for Smart Money accumulation.
Look for a Test Bar or Spring within this zone on low volume as confirmation of supply exhaustion.
If price confirms with a wide spread up-bar on increased volume from the zone, this will signal the beginning of a markup phase, in line with VSA principles.
📍 Bias: Bullish as long as price respects the demand zone. Aggressive traders can scale in near the demand area; conservative traders should wait for confirmation of demand dominance before entering.
July 24, 2025 - XAUUSD GOLD Analysis and Potential OpportunitySummary:
After yesterday’s sharp drop from 3420 to 3385, today may bring a corrective rebound. Watch the 3385 level closely — if price breaks below, bearish momentum could increase, and the strategy shifts to selling on pullbacks. If 3385 holds, consider buying on dips, targeting a retest of 3400. A sustained move above 3400 may strengthen bullish momentum, but if rejected, price could range between 3385–3400. Stay flexible and focus on key reactions at major levels.
🔍 Key Levels to Watch:
• 3434 – Resistance
• 3420 – Resistance
• 3405 – Key resistance
• 3400 – Psychological level
• 3385 – Intraday key support
• 3375 – Support
• 3364 – Support
• 3358 – Support
• 3345 – Strong support
📈 Intraday Strategy:
• SELL if price breaks below 3385 → target 3380, then 3375, 3370, 3364
• BUY if price holds above 3400 → target 3405, then 3410, 3420, 3434
👉 If you find this helpful or traded using this plan, a like would mean a lot and keep me motivated. Thanks for the support!
Disclaimer: This is my personal view, not financial advice. Always use proper risk control.
Gold (XAU/USD) 1H Analysis: Sell Zone Identified with Downside This chart shows a technical analysis of Gold (XAU/USD) on the 1-hour timeframe. Price is approaching a Sell Zone near resistance around $3,431, with two downward target levels marked at $3,403.787 and $3,382.674. The chart also highlights a Fair Value Gap (FVG) suggesting potential bearish retracement.

Long towards 3450.00Bullish Rally continues, Expecting it from 3418 area.
This is not a financial advice. Just my trade idea for small 3 positions
SellRejection Level
Daily Volume
Market Structure Shift
London Session
Trend Line Break
Untapped Order Point

Gold market strategyGold technically remains under pressure at the 3345 level amidst volatile trading, continuing its recent downward trend and bottoming out. The US market briefly accelerated its decline in the evening, breaking through the 3302 level before rebounding and closing weakly in a volatile market. The daily K-line closed with a medium-sized bearish candlestick pattern, suppressing the decline and breaking the bottom. The daily chart has maintained a bearish trend for four consecutive trading days, and the short-term bull-bear strength dividing line has shifted down to the 3355 level. Under pressure below this level, the daily chart maintains a bullish trend. If your current trading is not ideal, I hope I can help you avoid investment pitfalls. Welcome to communicate with us!
Based on the 4-hour chart, the key resistance level above is 3355. Short-term resistance above is the 3340-45 area. During the day, based on this level, continue to short and watch for a pullback, maintaining a trend-following approach. I will provide detailed trading strategies on the homepage link, so please stay tuned.
Gold Trading Strategy:
1. Short gold on a rebound near 3340-45, and cover your short position at 3355. Stop loss at 3363, target 3300-3310. Hold if it breaks through.

Gold Analysis and Trading Strategy | July 30✅ Fundamental Analysis
🔹 Short-Term Decline in Safe-Haven Demand:
Recent developments, including the U.S.-EU tariff agreement and the resumption of U.S.-China trade talks, have temporarily eased market tensions, weakening gold's appeal as a safe-haven asset.
🔹 Dollar Rebound Pressures Gold:
The U.S. Dollar Index rebounded sharply after a second bottoming attempt, breaking above the key 98.10 resistance level. This strengthened pressure on gold and limited its upward potential.
🔹 FOMC Rate Decision in Focus:
The Federal Reserve will announce its interest rate decision today. The market’s focus is on whether a signal for a potential rate cut in September will be delivered.
If the statement is hawkish, downplaying the chances of a rate cut, the dollar may strengthen further, possibly pushing gold to test support near $3300.
If the Fed adopts a dovish tone or hints at a September rate cut, it may trigger a breakout above the $3350 resistance level.
🔹 Key U.S. Economic Data Ahead:
Today also brings the release of ADP employment data and the Q2 GDP revision.
If GDP growth exceeds expectations (>2.0%), it may strengthen the case for prolonged higher interest rates, which would be bearish for gold.
If data disappoints, it could reinforce dovish expectations and support a rebound in gold prices.
✅ Technical Analysis
🔸 Gold continues to fluctuate within the $3333–$3320 range, reflecting a market in wait-and-see mode ahead of the Fed decision.
🔸 Short-term price action still favors the bearish side, but strong support below and persistent geopolitical risks are offering some downside protection for gold.
🔴 Resistance Levels: 3355 / 3375 / 3380
🟢 Support Levels: 3310 / 3300 / 3280
✅ Trading Strategy Reference:
🔰 If the price rebounds to the 3355–3365 zone, consider light short positions
⛔Stop-loss: Above 3380
🎯 Target: Around 3320
🔰 If the price pulls back and stabilizes around 3310–3300, consider short-term long positions
⛔ Stop-loss: Below 3285
🎯 Target: 3340
🔰 If the price breaks below 3300, bearish momentum may extend toward 3280
🔰 If the price breaks above 3355, the bearish structure will likely fail, and gold may resume its upward trend
✅ With the market entering a high-impact news period at month-end, volatility is expected to increase significantly. Traders should set stop-losses strictly and manage position sizes carefully to mitigate the risks of sudden market moves.
GOLD for todayHello to all traders. 😎😎
I hope all your deals will hit their targets. 🎉🎉
Based on yesterday’s analysis (link in the caption), we can expect gold to make a small upward move towards the 3335–3345 zone to collect sell orders in that area, and then potentially drop with more strength.
As you can see on the chart, the previous bearish move was strong, while the recent bullish move from yesterday until now has been slow and weak.
🌟🌟 The main reason for expecting this drop is the break of a key trendline on the 4H timeframe.
I’ve marked the entry point and stop-loss in red, and the targets in blue on the chart.
📌 Don’t forget to apply proper risk management!
⚠ Important: If a 1H candle closes above 3350 without giving us a valid entry beforehand, this analysis will be considered invalid.
What Do You Think?
Which scenario do you think is more likely to happen? **Share your thoughts!** ⬇️
Don't forget that this is just an analysis to give you an idea and trade with your own strategy. And don't forget the stop loss🛑🛑🛑
❤️❤️❤️The only friend you have in financial markets is your stop loss❤️❤️❤️
Please support me with your ✅' like'✅ and comments to motivate me to share more analysis with you and share your opinion about the possible trend of this chart with me 🙏😊
Be Happy , Ali Jamali

Where is GOLD going next?In the last four months, GOLD privided us a common pattern (for four times) that usually lead to an explosive moves. Where are we going next and what could be the target? In this case, time help us to understand better. The pattern is not complete yet and i expect the move to run in 24 hrs (maybe due to the high impact news will we have tomorrow, like the Initial Jobless Claim and CPE?). Now we just need to understand where the price will go to make profits, and to try to understand this we will check the RSI and the MACD. When this pattern occured, the RSI was rising and above 50 for three times with MACD on bullish cross (the three times that the price pumped) and was chopping and struggling close to 50 (but below it) with a bearish cross on MACD the single time it crushed. If we look at the actual situation, RSI is rising and MACD it's on bullish setup, but i will update you tomorrow (or when a breakout will occur). Now, for the possible target, we can easily aim to $100 move. So, price can touch $3420 for a long or $3240 for a short.
What do you think guys? Let me know in the comments!
