Gold recently experienced a typical "suppression and release"Capital dynamics and sentiment modeling, found that the gold market has recently experienced a typical "suppression and release" type of reaction. After a period of sustained pressure on the emotional background, the dominant force of the short side began to weaken, and both long and short sentiment tends to be balanced, and the logic of gold as a safe-haven asset has been re-explored and recognized.
This type of trend is often non-explosive, but through the emotional layers of repair and structural slow reversal of the gradual unfolding. The current signal strength has reached the bearish threshold set by the system, with a certain operational feasibility.
It is recommended that traders try to follow up with a low percentage of positions, but still need to retain enough position space to cope with the possible continuation of fluctuations. The whole layout is mainly defensive and offensive, and it is appropriate to seek progress in a stable manner.
XAUUSDG trade ideas

XAUUSD M45 Outlook XAUUSD
Liquidity grabbed ✅
Break of Structure & ChoCh confirmed ✅
Price taps into premium OB zone 🧠
Entry from refined supply zone 🎯
Risk:Reward 🔥
SL: 3348
TP: 3290
If this plays out, it's textbook Smart Money 👑
Risk managed. Emotions off. Let the market speak.

Gold (XAU/USD) – Technical UpdateDate: July 30, 2025
✅ Market Reaction Confirms the Forecast
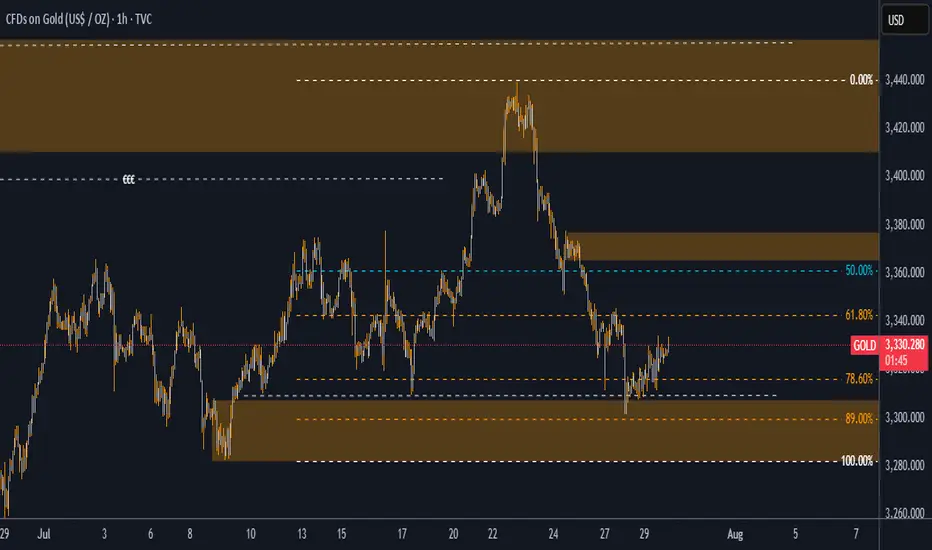
In our previous analysis, we highlighted the $3,308–$3,315 region as a high-probability demand zone, reinforced by a deep retracement into the 89% Fibonacci level. We also pointed to a liquidity grab beneath $3,308 and projected a potential bullish reversal toward $3,345 and $3,398.
Today, price action has validated this view with precision.
✅ Price swept liquidity below $3,308 as expected, triggering a sharp rejection from our zone.
✅ A clear bounce followed, pushing price upward and confirming that large buyers stepped in—exactly where we anticipated.
✅ The structure is now shifting bullish, with price currently trading above $3,331, heading confidently toward our first target at $3,345.
📊 Why This Matters
This reaction was not random—it followed the logic laid out in the prior analysis:
-The demand zone was respected.
-The discounted pricing at 89% retracement offered maximum risk-reward.
-The internal imbalance between $3,345–$3,398 continues to act as a magnet, just as we outlined.
This is a textbook move where price hunted stops, tapped into demand, and began its upward drive—exactly as described in advance.
🎯 Targets Remain Valid
Target 1: $3,345 → Currently in progress. Price is gravitating toward this level, which also aligns with the 50% Fib retracement and minor supply.
Target 2: $3,398 → The final destination of this bullish move, completing the fill of the inefficiency left behind by the last drop.
🧠 Final Word
This is a strong confirmation of the original idea. The technical story has unfolded step by step as predicted, proving the reliability of the analysis. For traders following along, this not only reinforces confidence in the setup—but also showcases the power of disciplined, structure-based trading.
🔥 The move is unfolding exactly as projected. Patience, precision, and planning are now paying off.
consider like and follow so you don't miss any next analysis or update of the chart
you can ask me in the comment section
Gold market strategyGold technically remains under pressure at the 3345 level amidst volatile trading, continuing its recent downward trend and bottoming out. The US market briefly accelerated its decline in the evening, breaking through the 3302 level before rebounding and closing weakly in a volatile market. The daily K-line closed with a medium-sized bearish candlestick pattern, suppressing the decline and breaking the bottom. The daily chart has maintained a bearish trend for four consecutive trading days, and the short-term bull-bear strength dividing line has shifted down to the 3355 level. Under pressure below this level, the daily chart maintains a bullish trend. If your current trading is not ideal, I hope I can help you avoid investment pitfalls. Welcome to communicate with us!
Based on the 4-hour chart, the key resistance level above is 3355. Short-term resistance above is the 3340-45 area. During the day, based on this level, continue to short and watch for a pullback, maintaining a trend-following approach. I will provide detailed trading strategies on the homepage link, so please stay tuned.
Gold Trading Strategy:
1. Short gold on a rebound near 3340-45, and cover your short position at 3355. Stop loss at 3363, target 3300-3310. Hold if it breaks through.

Sell Analysis – 30M Smart Money Concept Sell Analysis – 30M Smart Money Concept
📊 Chart Context:
Timeframe: 30M
Market: Gold (XAUUSD)
Bias: Bearish – Scalp Sell
---
🔍 Key Observations:
Premium Zone Rejection:
Price tapped into a premium supply zone formed after a clear break of structure (BoS) to the downside. This confirms seller dominance at higher pricing levels.
FVG (Fair Value Gap) Fill:
The price filled a previous FVG imbalance and showed rejection without closing above the origin of the impulse. This shows liquidity grab behavior typical in smart money moves.
Bearish Order Block Confirmation:
A bearish OB was respected and reacted to. The latest candle shows strong rejection with a long upper wick and volume tapering — an early confirmation of potential entry trigger for scalp short.
---
🧨 Entry Strategy (Scalp Sell):
Entry Zone:
Inside the reaction to the OB and FVG (just below the premium zone)
✅ 3325 ~3330
Stop Loss:
Just above the last high or FVG origin
✅ 3340
Take Profit:
TP1: Towards the equilibrium of the recent impulse leg
✅ 3300
TP2: Below the discount zone, targeting liquidity under recent lows
✅ 3280
---
⚠️ Risk Note:
This is a scalping setup, not a swing trade. Higher timeframes still show mixed signals, so risk management is key. Avoid over-leveraging.
---
🏁 Summary:
> A high-probability scalp sell setup confirmed by smart money concepts: BOS → FVG Fill → OB Rejection → Liquidity Grab → Bearish Continuation.

Gold Buy SetupHi everyone
Hope you all had a good trading week so far, this is our buy setup we looking to see for Wednesday
Let us know in the comments what you think.

Gold prices under pressure: $3,330-3,350Gold prices under pressure: $3,330-3,350
Upward momentum: Gold could break through $3,330 if the Federal Reserve hints at a September rate cut or the EU economy deteriorates.
Downside risks: Gold could fall below $3,300 if strong US economic data (such as GDP and PCE figures) are released.
Optimistic scenario: If the Fed cuts rates in September and global stagflation risks increase, gold could reach $3,400.
Pessimistic scenario: If the US economy experiences a soft landing, rising real interest rates could push gold prices down to $3,200.
Key Technical Levels:
Support: $3,300
Resistance: $3,330/$3,350
Aggressive Strategy:
Sell Price: $3,325-$3,330
Stop Loss: $3,335
Target Price: $3,310
Conservative Strategy:
Sell Price: $3,340-$3,350
Stop Loss: $3,355
Target Price: $3,330-$3,310
Bottom Picking Strategy:
Buy Price: $3,300-$3,310
Stop Loss: $3,290
Target Price: Above $3,350/$3,400

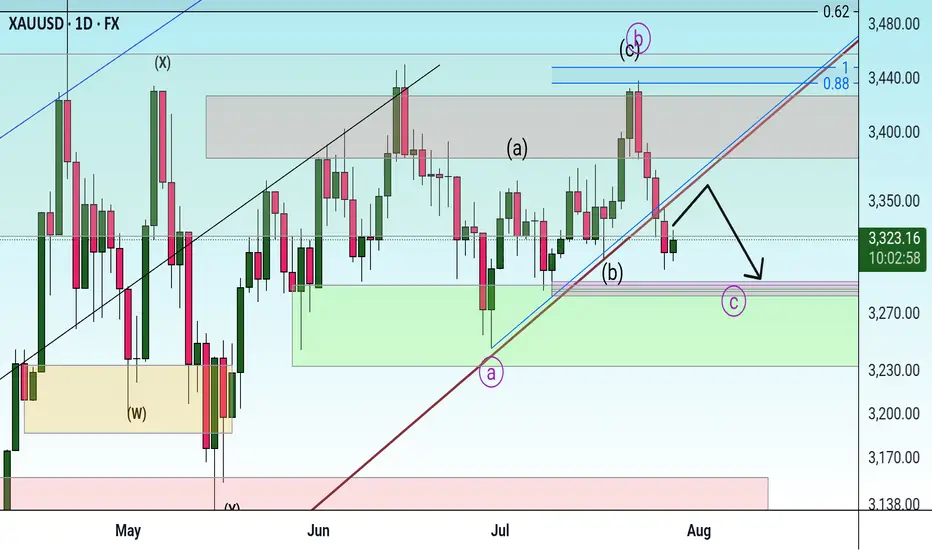
Correction It is expected that the price will consolidate below the trend line and continue the downtrend to the specified support levels. In this case, a three-wave pattern will form.
XAUUSD - BUY to SELL CONT.DI'm in on the BUY, waiting patiently to take the SELL only with confirmation

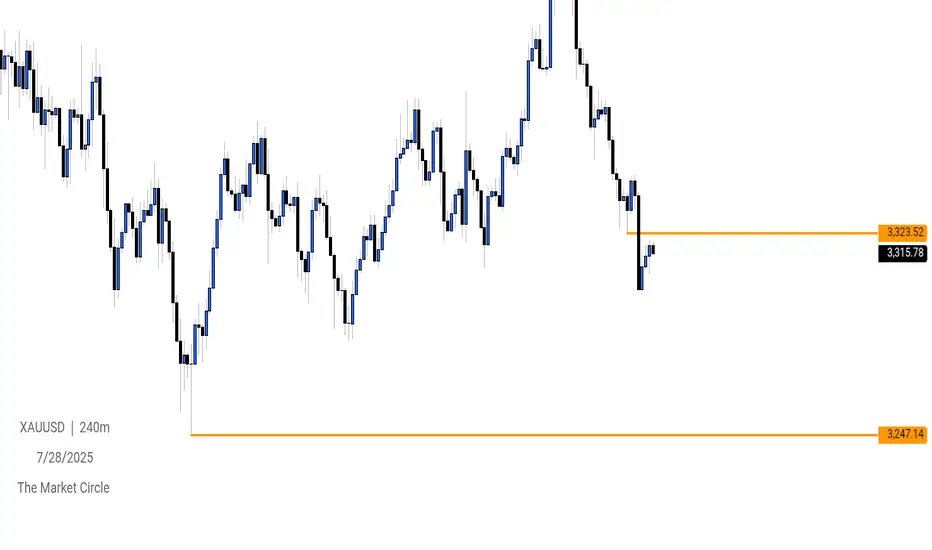
XAUUSD Analysis: Watching 3323.52 as Potential Support-Turn-ResiPrice action on XAUUSD suggests that the 3323.52 level may act as a key area of interest. Following the recent break below a structural low, I am anticipating a possible retracement toward this zone, where it could serve as a support-turned-resistance level.
Should price react to this area and fail to reclaim it, we may see a continuation of bearish momentum driving price lower.
📌 Key Level: 3323.52
📉 Bias: Bearish below this zone
🔍 Confirmation: Watching for rejection or bearish structure on lower timeframes around the level
Gold setupGold us just broken to the downside from the previous uptrend and now we expect the prices to continue pushing towards the downside. the prices are likely to reject from the the current order block but if not, they will probably do on the smaller upper order block as you can see via the analysis

XAUUSD approaches a strong buy zoneGold is approaching a strong buy area. Aggressive traders set pending orders whereas cautious ones wait for some confirmation signals in the range of such zones. I expect buyers to push price back up for atleast half day today Follow risk management to enjoy your trading journey.
Target1 3374

Daily chart gapThis gap will be closed in a week or two. I am gonna hold buy from now. At least set TP at 3400. We'll see if it goes as planned.

GOLD (XAUUSD)GOLD Market Outlook........
📍 Price broke daily trendline and is now retesting it.
📍 You marked a Break of Structure (BOS) — suggesting a shift in direction.
📍 Price is in a consolidation zone (range) with possible accumulation.
What to Expect:
- If price breaks above the range, expect a bullish push upward to the next supply level.
- If it rejects the upper box, it may return to fill imbalance or test previous lows again.
What You Should Do:
1. Wait for breakout confirmation from the consolidation zone.
2. For buys: Enter on a clear break and retest of the upper range box.
3. For sells: If price rejects the top and breaks back below, look for short entries toward support.

Long XAUUSD 2RXAUUSD finish doing the correction now looking toward long. I will consider taking Long on XAUUSD. Vamos !

XAUUSD REBOUNDED FROM CURRENT TRENDLINE. WHAT'S NEXT?XAUUSD REBOUNDED FROM CURRENT TRENDLINE. WHAT'S NEXT?
Gold had successfully rebounded from the trendline, still showing mid-term bullish trend despite recent news on U.S. - E.U. and U.S. - Japan trade deals. Currently price is attempting to hold above the EMA20 on 1-h chart timeframe.
If this occurs and the asset develops another short-term bullish impulse, we may expect the price to reach 3,360.00 resistance level with further possible impulse towards 3,400.00 level.

XAUUSD Outlook – From Bias to Execution Previous day closed bearish on XAUUSD, leading to a sell bias, On the 45M, I am looking out for possible entry and exit after a valid breakout of the bearish pennant, in line with my sell bias.

XAUUSDPrice action trading is a methodology where traders make decisions based on the interpretation of actual price movements on a chart, rather than relying primarily on lagging indicators. It involves observing and analyzing candlestick patterns, trend lines, support and resistance levels, and volume to identify potential trading opportunities and manage risk. The focus is on understanding the story the market is telling through its price behavior.

XAUUSD - Scalping ideaPrice is stuck in a range between 3348.90 and 3324.87.
📌 Looking for a clean breakout to take action:
Buy above 3348.90 → Targeting 3354.09
Sell below 3324.87 → Targeting 3319.15
Not interested in any trades inside the range only jumping in once we break out and close outside either level. Waiting for confirmation to avoid getting chopped up.
Let’s see where it goes. 📉📈
No rush, just reacting.

Daily Analysis- XAUUSD (Monday, 28th July 2025)Bias: Bullish
USD News(Red Folder):
-None
Notes:
- Price gap down and filled up the gap
- Looking for price to tap 0.618 fib level
- Potential BUY if there's
confirmation on lower timeframe
- Pivot point: 3300
Disclaimer:
This analysis is from a personal point of view, always conduct on your own research before making any trading decisions as the analysis do not guarantee complete accuracy.

KEMANA GOLD KEDEPAN NYA ?📊 Technical Analysis – XAUUSD (July 28, 2025)
Elliott Wave Structure – Triangle (ABCDE):
The chart clearly shows a contracting triangle pattern (ABCDE), which commonly appears during corrective waves (usually Wave 4 or Wave B in a larger degree).
Currently, price seems to have just completed Wave E, and it's showing early signs of a bounce from the triangle's lower support.
If this wave count is valid, we could expect a bullish breakout soon, continuing the previous trend (most likely upward if this is part of Wave (5)).
🧭 Key Support and Resistance Levels:
Triangle Support (Wave E area):
Around $3,325 – $3,336 (price is currently testing this zone)
Potential Bullish Targets (if breakout occurs):
🎯 $3,374
🎯 $3,414
🎯 $3,498 – $3,500 (major resistance zone / Wave 5 target)
🧠 Fundamental Outlook Supporting Gold (Forward-Looking)
✅ Bullish Drivers:
Fed Rate Cut Expectations (Late 2025):
Slowing inflation → Rate cuts expected → Positive for gold.
Weaker US Dollar:
A weaker dollar makes gold cheaper for international buyers → Bullish.
Global Geopolitical Tensions:
Rising uncertainty supports gold as a safe haven asset.
⚠️ Bearish Risks:
Strong US economic data (e.g., NFP beats or rising inflation) could lead to the Fed staying hawkish → Negative for gold.
If price breaks below triangle support ($3,325), the triangle structure would be invalidated and a larger correction could unfold.
📝 Summary & Trading Strategy:
Direction Entry Area Stop Loss TP 1 TP 2 TP 3
✅ Buy (preferred) $3,330 – $3,336 Below $3,310 $3,374 $3,414 $3,498–$3,500
❌ Sell (if breakdown) Below $3,320 Above $3,340 $3,265 $3,245 $3,118

XAUUSD about to trade downwardsToo many tries on the higher high created by Gold that have failed , now the price has broken a treblndline from months back signalling a bearish move down to 3000 with few breaks to lead it there if the dollar doent slip, which the decline might take up to November according to how I see the pattern formations

Gold – Range Break Incoming?Gold is still locked in a broad range, but recent price action suggests a possible breakdown. A break below the double bottom opens the door for a move toward the range midpoint.
