Gold is weak. Will it explode next week?Gold prices failed to stabilize above $3,400 after a bullish breakout this week. The technical outlook highlights the recent indecision of gold bulls.
In the first two trading days of this week, spot gold prices rose by 2.4%, but the cumulative decline in the last three trading days of this week reached nearly 3%. The sharp fluctuations this week were due to the positive progress in Trump's trade negotiations, and the rebound in market risk appetite, which hit the safe-haven demand for gold.
Looking at next week, the economic calendar will provide several high-impact data releases. The Federal Reserve will announce its monetary policy decision after the policy meeting on July 29-30; the US Bureau of Labor Statistics will release the July employment report; and some important news such as the US-China trade negotiations may trigger the next major move for gold.
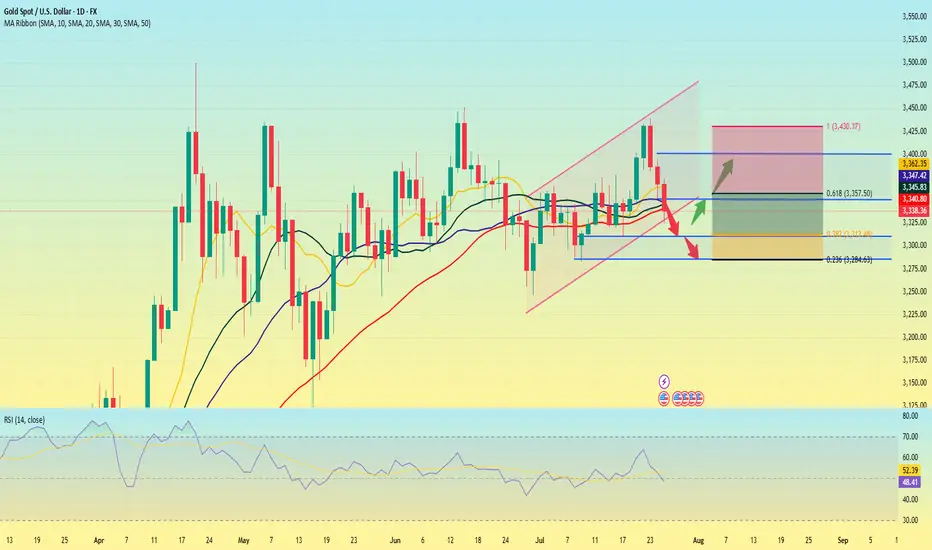
From a technical perspective, the current market short-term technical outlook highlights the hesitation of gold buyers. The daily chart shows that the RSI is still slightly below 50, and gold prices have difficulty staying away from the 20-day and 50-day MAs after breaking through these two levels earlier this week.
On the upside, 3450 constitutes the first resistance for gold prices. If it breaks through this resistance, gold prices will most likely hit the 3400 integer mark again.
On the downside, if gold prices remain below 3340, technical sellers may still be interested. In this case, 3310 can serve as the first support level, followed by the second support level near 3285.
A new week is about to begin, and I wish all traders good luck.
XAUUSDG trade ideas
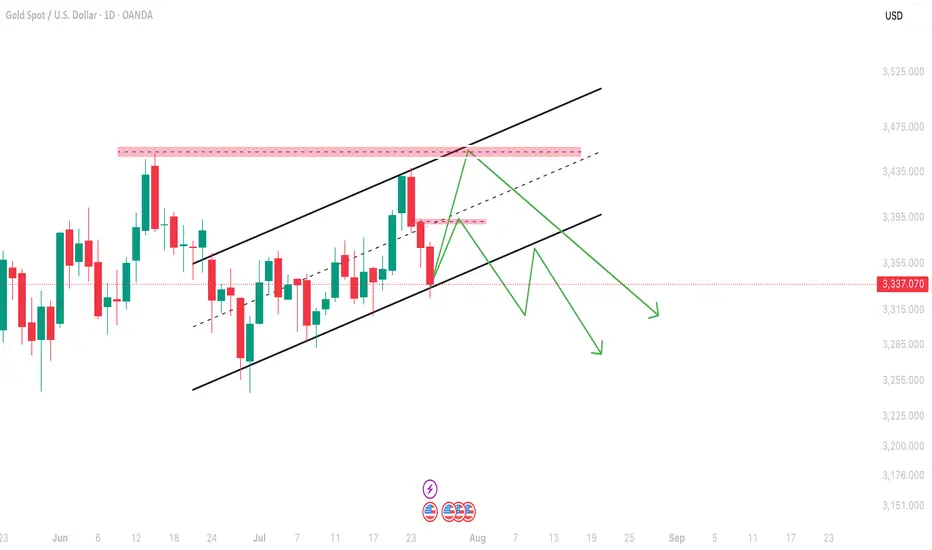
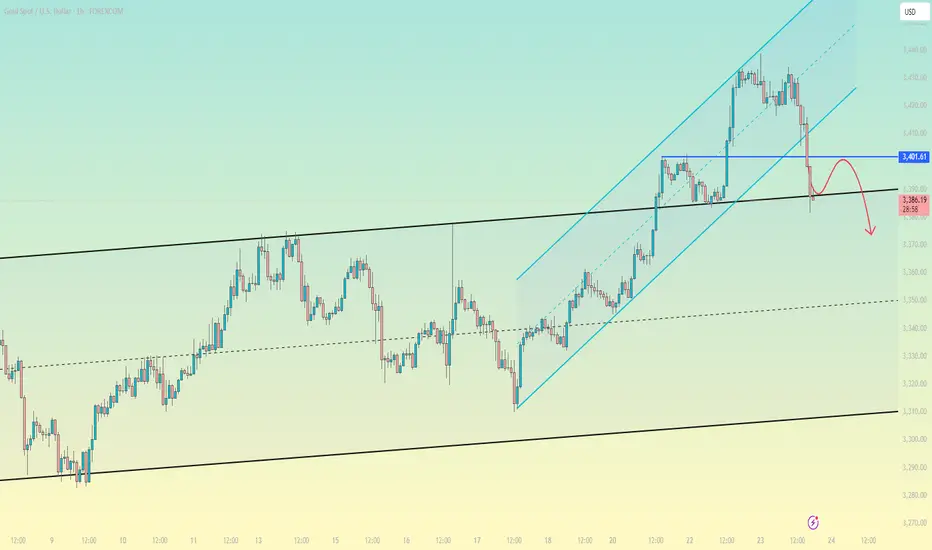
Daily Time frame Structure setAs you can see gold is moving in a channel in daily time frame so according to me next move will be till protected order block i.e 3382-3388 and after that big fall expected and if any candle close above 3384 then 3451 is the next target for gold.
gold bearishgold has not respected any support ony to H4 3351.
will it make its way up from here. only candle stick reaction to tell us.
however the safest trade for today to end the week is shorts.

Xausd techinical analysis.Xausd techinical analysis next move posibale at h2 time frame not finchinal advice.

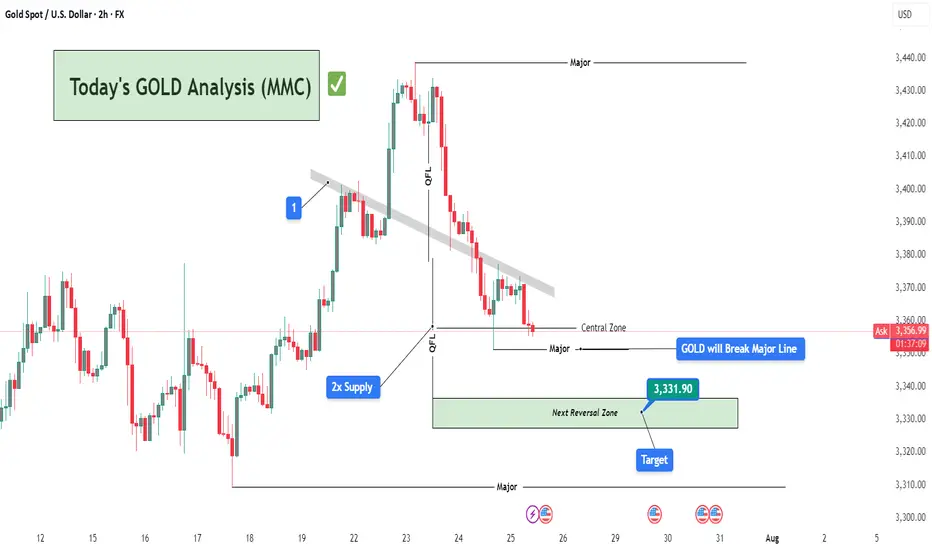
Today's GOLD Analysis (MMC) – Sell Bias Continues To Next TargetChart Overview:
This 2-hour GOLD (XAU/USD) chart showcases a clear bearish structure in line with the Mirror Market Concepts (MMC) methodology. Price action is respecting key supply zones and continues to reject significant levels, confirming the dominance of sellers in the short-term structure.
🔍 Key Technical Elements:
1️⃣ Break of Trendline (MMC QFL Entry Model)
The descending grey trendline marks consistent lower highs, showing clear bearish pressure. The breakout and rejections around this trendline zone (annotated “1”) confirm it as a strong supply area. This breakdown set the stage for a QFL (Quick Flip Liquidity) drop.
🧊 2x Supply Zone (High Confidence Rejection)
The 2x supply label highlights an area where price rapidly reversed with aggressive bearish momentum. This zone was tested and respected again, leading to further downside pressure, reinforcing the idea of institutional selling interest from that level.
📉 QFL Levels & Central Zone
Two major QFL drops are evident, where price broke previous demand structures and created new supply imbalance. The Central Zone currently acts as short-term support, but price is hovering just above it with weak bullish reaction, indicating potential for further breakdown.
🎯 Target & Reversal Zone – 3,331.90
The green zone below marks the Next Reversal Zone, with a highlighted price target at 3,331.90. This is where:
Previous liquidity was absorbed.
Demand imbalance may attract buyers again.
MMC reversal structures might be anticipated.
This zone aligns perfectly with the broader MMC concept of flipping between major zones and reversal blocks.
🧠 Trade Idea & Strategy (MMC Traders’ Minds)
Current Bias: Bearish
Entry Trigger: After rejection from trendline & 2x supply area.
Stop-Loss Suggestion: Above the trendline or recent supply wick (~3,375-3,380).
Take-Profit Zone: Primary TP at 3,331.90, with eyes on lower reversal targets if momentum persists.
Market Behavior: Controlled by sellers, liquidity sweeps seen, weak demand below Central Zone.
📌 Key Events to Watch
As marked at the bottom, major US news events are scheduled between July 30th and 31st, which could act as catalysts for price acceleration toward the reversal zone or cause sharp volatility. Plan accordingly.
🧭 Conclusion:
Gold is respecting bearish market structure under the MMC model. With clear QFL breakouts, rejection from 2x Supply, and weak bullish attempts near the Central Zone, this chart favors short setups targeting the 3,331.90 zone. MMC traders should monitor price action closely within the Reversal Zone for potential buy signals or trend continuation if sellers remain aggressive.
Gold fluctuated downward. Or it will continue.Gold was blocked near 3393 in the early trading on Thursday and began to fluctuate and fall, falling to 3351 as low as possible, then stopped falling and rose, and after rebounding near 3377, it was blocked and fell back to 3370 and fluctuated up and down, and the daily line closed with a negative line.
After three consecutive positive rises from last Friday to Tuesday this week, gold ushered in a turning point on Wednesday. On Thursday, it continued to fall and broke through the 5-day and 10-day moving averages, and the short-term market weakened. From the overall structure, the rising channel since June 26 remains valid. The highs on Tuesday and Wednesday approached the upper edge of the channel and then fell. The current price turned to fall and approached the lower edge of the channel.
There are two key positions for the support below: the first support level is near 3345, which is the lower edge support of the current rising channel; the second support level is near 3325, which is the trend line support formed by the connection of the previous low points.
From the 4-hour chart, the 3351 low point and the rebound resistance level can be used as a reference for today's long-short game. The breaking of key support and resistance will determine the trend direction of the next stage.
Operation strategy:
Short near 3375, stop loss 3385, profit range 3350-3330
Long near 3330, stop loss 3320, profit range 3350-3370

xauusdupdate on gold ,right now on the daily we are still looking forward on a break so waiting carefully for that monster push above the 3440 areas

Gold (XAU/USD) Analysis:Gold prices declined yesterday and today, driven by selling pressure that broke the $3,420 level and held below it. Currently, the price is testing the $3,365 zone.
1️⃣ If the $3,360 support is broken and price holds below it, we may see a further decline toward $3,340, which could act as strong support and potentially trigger a bullish rebound.
2️⃣ On the other hand, if buying momentum emerges and price breaks above $3,380 and holds, this could lead to a move toward retesting $3,400 and eventually $3,420.
⚠️ Disclaimer:
This analysis is not financial advice. Please monitor market movements carefully and make trading decisions based on your own analysis.

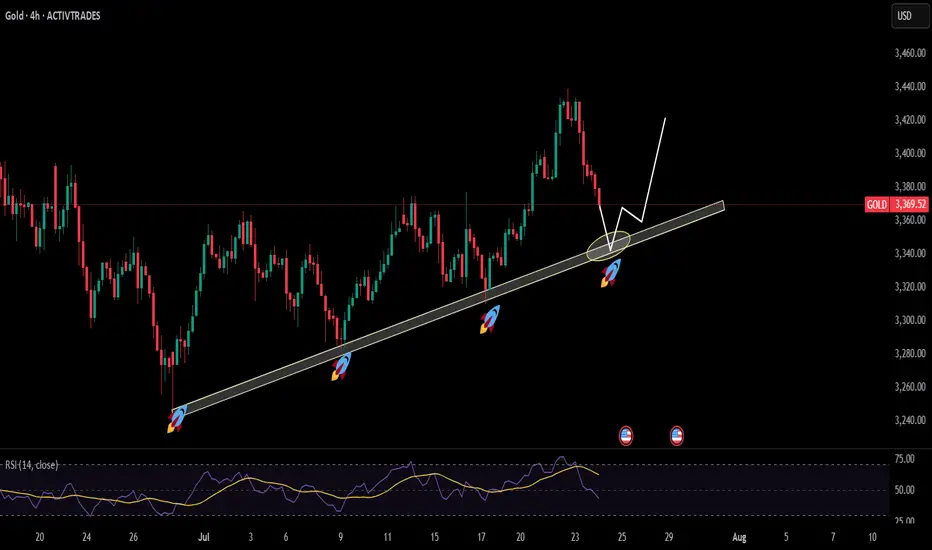
Gold is coming at support leveldrawn trendline has been proven a major support level for gold as the price has tested it multiple times and get a decent bounce to make new highs currently price is again approaching the support level opportunity will be when price hit that level then look for buy setups on shorter tfs to get higher RR
XAUUSD
XAUUSD Updated in H1 :
The gold signal is marked on the chart based on the latest price changes and the supply and demand in the market. These points include the entry point, stop loss, and take profit

XAUUSD📈 Gold (XAUUSD) Price Prediction After Weekly Resistance Rejection
After gold price touched a weekly resistance and faced a strong rejection, while the overall trend remains bullish, we can outline two potential scenarios:
🔹 Primary Scenario (Bullish Continuation)
Price performs a healthy pullback to the nearest support zone (e.g., 50 EMA on H4 or previous minor support).
A rejection candle forms (e.g., pin bar or bullish engulfing), indicating buyers are still in control.
If the pullback holds:
Price could break through the weekly resistance again
And continue rallying toward the next resistance zone (e.g., $2,480 or $2,500)
✅ Confirmation:
RSI remains above 50 (bullish momentum intact)
No strong bearish divergence on H4/D1
Volume or open interest increases during upward moves
🔸 Alternative Scenario (Deeper Correction)
If the rejection leads to weaker buying volume:
Price may correct deeper toward a stronger support zone like the previous consolidation area (e.g., $2,400 or even $2,375)
Possible formation of a double bottom or higher low before resuming the uptrend
📊 Trading Strategy:
Buy on dip: Look for entries around key support zones, wait for bullish reversal confirmation
Use trailing stop if already in a buy position, as breakouts can be sharp and quick
Watch for upcoming fundamental catalysts (e.g., FOMC, CPI, US labor data) that may drive volatility

Gold is weak. Will it continue to fall?Yesterday, the price of gold did not continue to rise as strong as in the previous two days. After reaching the previous top position, it began to retreat under pressure.
The market is too bullish, and under this pattern, the market is likely to have an unexpected reversal. Yesterday, it fell below the 3400 integer mark, so it is likely to maintain a volatile downward trend in the future.
The current main support level is around 3370, which is also the primary point for the bears to continue to break down in the future. Once it falls below this position, the target may be around 3345-3355. It cannot be said that it has completely turned to a bearish position at the moment. It is just a bearish oscillation pattern within a large range, and the upper pressure is maintained near 3405, which is also the support point for the first downward step of the bears on Wednesday.
Today, we still need to operate around the short position first. The price rebounds to 3405 and shorts, and the profit range is around 3390-3380, and the stop loss is 3415.
After a new low appears in the European session, wait for the US session to rebound and continue shorting.


Gold fell from a high and may fall back to the rangeGold fell from a high and may fall back to the range
During the U.S. trading session on Wednesday (July 23), spot gold fell from a high and is now trading around $3,390/ounce. Previously, gold prices broke through the $3,400 mark on Tuesday, reaching a high of $3,433.37/ounce during the session, a new high since June 16, and finally closed up 1% at $3,431.59/ounce.
The main factors driving the rise in gold prices include:
Weak U.S. dollar: The U.S. dollar index fell 0.3% to 97.545, a two-week low, providing support for gold.
Trade uncertainty: The market is closely watching the deadline for U.S. tariff negotiations on August 1, and the continued deadlock has increased risk aversion demand.
Lower U.S. Treasury yields: The downward trend in yields weakens the attractiveness of the U.S. dollar, and funds flow to gold.
However, if there is a breakthrough in trade negotiations or the Federal Reserve releases hawkish signals, market risk appetite may rebound and gold prices may face correction pressure. In the short term, gold prices are still dominated by fundamentals, but we need to be alert to the possibility of high-level shock adjustments.
Technical aspect: Overbought signals appear, pay attention to key support and resistance
Daily level:
Strong rise: three consecutive days of positive closing, breaking through the 3400 and 3420 trend line pressure, the Bollinger band opening widens, showing strong bullish momentum.
Overbought risk: RSI and MACD show a top divergence, technical correction needs are enhanced, but market sentiment still dominates the trend.
Key observation points: If it continues to close positive today, the upper target will look at 3450; if it closes negative, it may start a short-term adjustment and test the 3380-3370 support.
4-hour level:
Short-term peak signal: It hit 3438 in the early trading and then fell back. If it falls below the 3405-3400 support, it may further test 3385 or even 3375-3350.
Long-short watershed: If 3400 is held, high-level fluctuations will be maintained; if it is lost, the correction may continue.
Operation strategy: Be cautious about high-level fluctuations
Short-term resistance: 3400-3405 (if the rebound is under pressure, consider shorting)
Short-term support: 3380-3370 (if it stabilizes after a pullback, you can try long with a light position)
Summary: Although gold is still in a bullish trend, the technical overbought and fundamental uncertainty require vigilance against the risk of a high-level correction. It is recommended to rebound high and short as the main, and pull back low and long as the auxiliary, and pay close attention to the gains and losses of the 3400 mark and changes in market sentiment.
Gold going for ath again?Im looking for another long on gold! Dollar is dumping so gold should go up.. right? If it close above 3431 my long will be entered! So i will be sitting on my hands till than!

XAUUSD on bearish retest sellGold is currently still holding rising channel along with the swing moves we were on sell throughout from yesterday and my 1st Attempt on sell achieved with 200 PIPs Tp now I'm expecting the again reversal retest move!!
What's possible scanarios we have?
▪️I opened again sell opportunity from 3420-3425 area by following our structural retest strategy, my Selling trade target will be 3405 then 3395 in extension.
▪️if H4 candle closing above 3435 this Parallel moves will be invalid.
#XAUUSD

Gold analysis WednesdayHello guys today I update the gold price action analysis, some parts of my journey and plan, and how we must prepare for every scenario that would come. Thankyou for watching

48-HOUR FREE ACCESS TRADING AtroNox INDICATOR⚡️ Atronox: The Eternal Market Sovereign
Unleash Limitless Trading Power on TradingView
"AtroNox : Where Mortals End and Market Gods Rise."
Break free from mortal limitations and ascend to a higher trading realm.
Atronox isn’t just an indicator—it is the embodiment of eternal market dominance. Fueled by god-tier algorithms and cosmic-level integrations, it transforms traders into precision-driven titans of the financial world.
48-HOUR FREE ACCESS
TRADING INDICATOR
To get access, comment "PERFECT" under the post in TradingView at this link:

Gold (XAU/USD) on the 1‑hour timeframeGold (XAU/USD) on the 1‑hour timeframe
Chart Structure & Bias
* Price remains trapped in a **rising channel** (\~\$3,328–3,333), pressing against resistance near **\$3,340–3,345**.
* Short-term momentum is bearish: both EMA 7 and EMA 21 sit above current price, with declining volume signaling weakening buyer strength.
* Overall trend leans neutral‑to‑bearish until market clears key zones decisively.
Trade Scenarios
**Bearish Breakdown (Preferred)**
* **Trigger:** Break and close below channel support (\~\$3,326).
* **Targets:** Initial drop toward **\$3,320**, then **\$3,300**, and possibly lower if momentum intensifies.
* **Invalidation:** Price pushes back above **\$3,333–3,335**, negating bearish structure.
**Bullish Breakout (Conditional)**
* **Trigger:** Clean breakout and sustained close above **\$3,342–3,345**.
* **Targets:** Upward stretch toward **\$3,355–3,360**, and if strong, **\$3,367–3,375+**.
* **Invalidation:** Fails to hold structure—retesting from above back beneath **\~\$3,338**.
Macro Drivers & Market Conditions
* Caution prevails pre‑Fed decision and ADP / GDP releases—market awaits cues on interest rate direction.
* Safe‑haven demand has softened as global trade sentiment improves, while U.S. dollar strength continues to cap upside in gold.
* Analysts favor **sell‑on‑rise positioning**, bumping up potential for controlled pullbacks.
Verdict
Gold is consolidating in a tight upward channel, showing short-term bearish pressure. The **bearish breakdown scenario holds the edge** unless price convincingly clears above **\$3,345** on strong volume, which could flip bias. A confirmed break below **\$3,326** sets the stage for downward moves toward **\$3,300** or lower.

Gold May Dip Mildly Before US Data📊 Market Overview:
Spot gold is trading around $3,329/oz, up ~0.1%, supported by falling U.S. Treasury yields and a slightly weaker dollar, while investors await potential Fed dovish signals or rate cut in September . Meanwhile, easing U.S.–EU trade tensions weighed on safe-haven demand for gold.
📉 Technical Analysis:
• Key Resistance: ~$3,335–3,350 (recent highs and potential test zone)
• Nearest Support: ~$3,310 (previous stable support)
• EMA09 position: Price is above EMA9, indicating a mild bullish bias in the short term
• Momentum/Volume: RSI ~53 (neutral), MACD & StochRSI showing small buy signals. However, bullish momentum is fading, suggesting a possible mild pullback
📌 Conclusion:
Gold may dip modestly toward $3,310 if the dollar strengthens or if Fed rate-cut expectations recede. A break above $3,335–3,350 could pave the way for further gains, though current momentum remains insufficient to confirm a breakout.
💡 Suggested Trade Strategy:
SELL XAU/USD: $3,333–3,336
🎯 Take Profit: 40/80/200 pips
❌ Stop Loss: $3339
BUY XAU/USD: $3,310–3,308
🎯 Take Profit: 40/80/200 pips
❌ Stop Loss: $3305


Schabacker's Gold Trap Inside the Trap: Schabacker Congestion, VWAP Warfare & The Silent Distribution on XAU/USD
1. The Congestion Area – Schabacker Style
🔍 What We Saw:
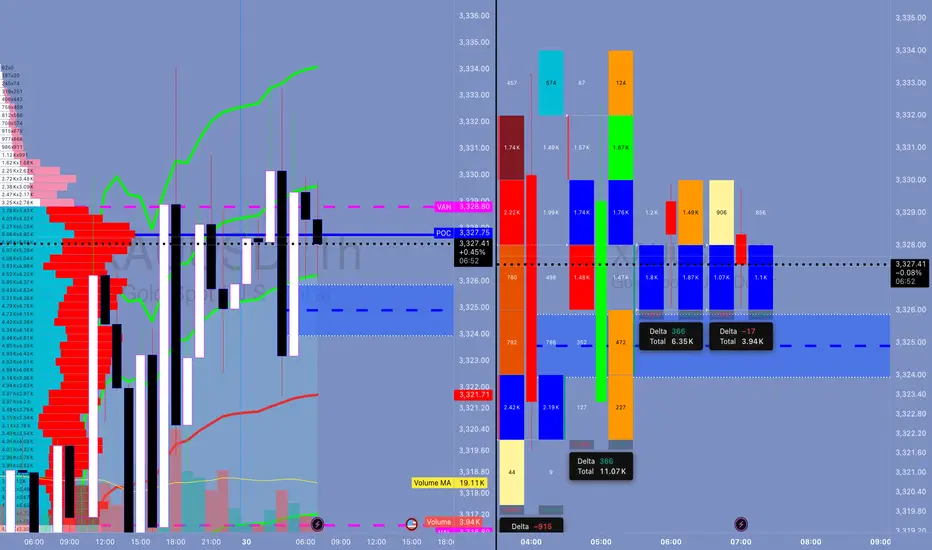
Price action rotated in a tight range: 3,324.5 - 3,329.5.
This is not random. This is Schabacker’s classic Congestion Zone:
Duration: 12+ hours
Width: ~5 points
Volume: tapering near edges
Failed breakouts on both sides = classic neutral wedge compression.
🎯 Schabacker Teaching Applied:
"Congestion areas are places of rest and preparation — they are the breeding grounds of significant breakouts or breakdowns."
From his bible “Technical Analysis and Stock Market Profits”:
Congestion after a trend → likely a continuation (but confirm via breakout volume).
Multiple failed breakouts = deceptive strength/weakness → traps.
Range becomes psychological equilibrium → breakout from this zone is explosive.
📘 Lesson:
Watch for breakout confirmation only AFTER price escapes the congestion and retests the range (confirm with volume and delta). If volume weakens and price returns inside = fakeout, fade that sh*t.
🔥 How Schabacker Explains July 29 Price Action
"This was a classic congestion scenario with symmetrical compression, rejecting value high and value low over and over — a balanced market ripe for an imbalanced expansion."
Price coiled with lower highs + higher lows inside the value zone = triangle-like congestion.
Breakout attempts both sides failed = energy stored.
Delta flipped negative toward the close + volume dried = distribution inside the congestion.
✅ Congestion was not random chop. It was the Smart Money disguising their exit before slamming price.
⚔️ ENHANCED STRATEGIC OUTLOOK FOR TODAY (JULY 30, 2025)
🎯 Bias: Short bias unless proven wrong by breakout + acceptance above 3,329.50
Schabacker’s congestion broken to the downside = high probability short trigger.
First target = edge of congestion zone @ 3,316.80 (previous VAL).
Second target (extension) = swing low anchor near 3,310.
📘 Volatility Note:
After tight range like this (Schabacker Box), volatility expansion is imminent. Don’t get caught trading inside — trade the break and retest.
💣 HYPOTHETICAL TRADE PLAN: SCHABACKER STRATEGY IN PLAY
Order Type: 🔻 Sell Stop Below Congestion Break
Entry: 3,322.00
Stop Loss: 3,330.00 (above congestion top + failed breakout zone)
Take Profit 1: 3,316.80 (edge of range, VAL)
Take Profit 2: 3,310.00 (target from congestion width projection)
Confidence: 78%
🧠 Justification:
Factor Explanation
VWAP Flatlined = balanced market
FVRP Price camped near POC = equilibrium
Footprint Absorption at highs, silent selling = distribution confirmed
Delta Early buyer strength flipped = trap
Schabacker Congestion Classic box breakout setup = timing the expansion
🧠 EDUCATIONAL SUMMARY — WHAT YOU JUST LEARNED
✅ Schabacker’s Congestion Area Tactics
Congestion after a move Leads to continuation (trend resumes after pause)
Multiple failed breakouts Traps traders = setup for fakeout fade
Volume dries inside box = Explosive breakout likely
Use congestion width To project breakout targets
You don't fade chop — you exploit it after the breakout.
Don't waste your bullets inside the box. Wait for the beast to break loose — then you unload.
Clear bearish flows till the next liquidity Gold has been falling for some days now but still we need that liquidity wiped out near 3270 for bigger moves
