Gold Outlook – The Range Holds, Direction Still Pending📆 What happened recently?
Since the middle of last week, I’ve been repeating the same core idea like a broken record:
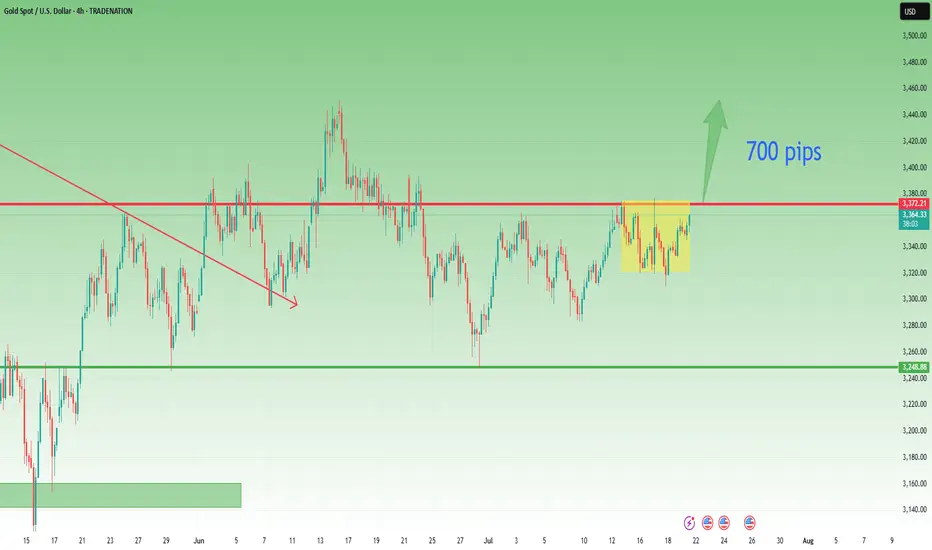
👉 “Gold needs to break out of the range to define its next real move.”
And once again, on Friday, TRADENATION:XAUUSD respected the structure, fluctuating quietly and closing the week right in the middle of the range — no breakout, no confirmation.
📈 Current status:
The new week opened with some bullish interest, and at the time of writing, Gold trades around 3363. Still inside the box.
So far, no technical change, and certainly no resolution.
❓ What am I watching for?
A clear break above 3375 → confirms bullish continuation
A decisive break below 3320 → confirms reversal potential
Until then, everything in between is noise and chop.
🧭 Trading plan:
My stance remains unchanged:
⏳ No position. No bias. Just waiting.
Once we get confirmation in either direction, I’ll take action.
📌 Conclusion:
Gold is still locked inside the range. The market is coiling, but no side is winning yet.
Patience here is a weapon — and I’m keeping it loaded. 🚀
Disclosure: I am part of TradeNation's Influencer program and receive a monthly fee for using their TradingView charts in my analyses and educational articles.
XAUUSDG trade ideas
XAU/USD BULLISH SETUPThe XAUUSD chart displays a strong bullish setup, with price action moving consistently above the ascending trendline. Recent price movements show a breakout from a consolidation phase, which is confirmed by the Ichimoku cloud providing additional support for upward momentum. The chart highlights a blue demand zone where buyers have stepped in multiple times, indicating strong support and buying interest. The projected move suggests a continuation toward the next resistance zone around the 3400 level, marked as target-1. Previous resistance levels have been successfully retested as support, further strengthening the bullish scenario. The overall market sentiment favours buyers, aiming for higher highs as long as the price stays above the key support levels.
Entry Buy: 3335
Target point: 3397
Stop loss: 3317
If you found this analysis helpful, don’t forget to drop a like and comment . Your support keeps quality ideas flowing—let’s grow and win together! 💪📈

GOLD ROUTE MAP UPDATEHey Everyone,
Quick follow-up on yesterday’s 1H chart update
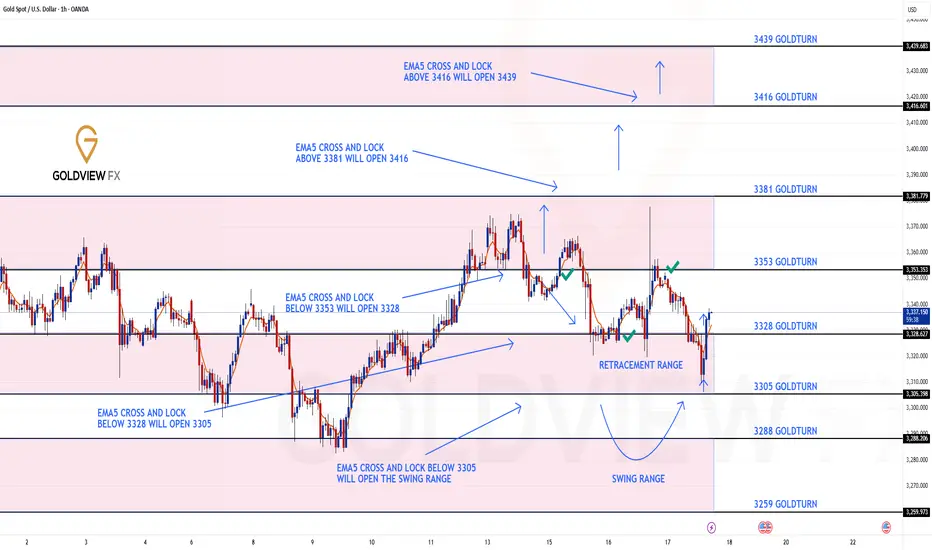
After hitting 3353, we did not see an EMA5 cross and lock above this level. That lack of confirmation was key and it validated a rejection right at 3353, leading to another drop into the retracement zone.
As per plan, that retracement provided yet another clean bounce, perfectly in line with our dip buying strategy.
We are once again looking toward 3353, and just like before, we will be closely watching for an EMA5 cross and lock confirmation to validate any continuation.
This kind of movement continues to confirm the power of patience, structure, and disciplined execution. No chasing just clean planned executions with high probability setups based on our EMA5 methodology.
We’re also still watching the 3381 gap a key magnet above, and a level we’ve been tracking since the Monday outlook. The roadmap remains unchanged. We’re trading the structure, managing risk, and letting confirmations guide the execution.
Updated Reminder of Key Levels:
BULLISH TARGET
3381
EMA5 CROSS & LOCK ABOVE 3381 opens
3416
EMA5 CROSS & LOCK ABOVE 3416 opens
3439
BEARISH TARGETS
3353 ✅ HIT
EMA5 CROSS & LOCK BELOW 3353 opens
3328 ✅ HIT
EMA5 CROSS & LOCK BELOW 3328 opens
3305
EMA5 CROSS & LOCK BELOW 3305 opens Swing Range:
3288
3259
As always, we’ll continue monitoring and sharing updates, as price reacts around these zones. Thank you all for the continued support, your likes, comments, and follows are genuinely appreciated!
Mr Gold
GoldViewFX
Gold is rising steadily.Gold technical analysis
Daily chart resistance: 3400, support: 3320
Four-hour chart resistance: 3390, support: 3340
One-hour chart resistance: 3375, support: 3348.
After bottoming out last Thursday, gold began to fluctuate upward on Friday, and the 1-hour bottom structure reappeared, which indicates that a new bullish opportunity has appeared again! It is worth noting that after breaking through 3344 on Friday, it continued to rise to around 3360. Today, after retreating to 3444 in the Asian session, it rose again. 3344 has become the top and bottom conversion position, so we can buy on dips based on the support of 3344. The second is the support at 3331.
In terms of intraday operations, the support below is 3344 and 3331, and it may not fall to around 3344. It is probably waiting to buy in the 3350-55 area. Pay attention to the key resistance around 3377 above. After the 15-minute top pattern appears, sell near this area.
Sell: 3375near
Buy: 3355near

Gold: holding flat grounds Gold was traded relatively flat during the previous week, moving within a range of $3.370 and $3.313. The safe-haven asset was holding relatively steady on eased geopolitical and economic tensions. The US Dollar gained a bit last week on better than expected inflation and jobs data posted during the week. Analysts are in agreement that current concerns related to the U.S. debt growth and further trade tariffs updates will certainly support the price of gold in the near future period.
The RSI was holding relatively steady modestly above the level of 50. This indicates that investors are still not ready to take the move toward the oversold market side. The MA50 modestly slowed down its divergence from MA200, however, two lines are still holding a higher distance between them, in which sense, cross is certainly not in store for some time in the future.
Charts are indicating that the price of gold continues to be well supported around current levels. There is some potential for a small move toward the down side, till the levels around $3.310. Also, the $3.3K support line might be tested. On the opposite side, any news related to geopolitical or economic tensions might swiftly push the safe-haven asset toward the upside, at least till the level of $3.370.

xauussWe will probably have a minor correction in this direction. We will wait for the trend line to break, if it breaks, the targets will be touched in order.

Expecting Gold bullish Movement Gold (XAU/USD) is showing signs of a potential bullish reversal on the 1 hour chart. Price action has respected the highlighted support zone around the 3,340 level forming higher lows and indicating buying pressure
A strong support level has been established in the red zone, suggesting buyer interest and a potential springboard for upward momentum. The projected path shows a bullish breakout with a possible rally toward the target area near 3,400 3,410 as indicated by the blue resistance zone
If the current support holds XAU/USD may continue to form higher highs and higher lows leading to a potential test of the upper resistance zone Traders should monitor price action closely near the support for confirmation of bullish continuation

Expecting Gold bullish Movement Gold (XAU/USD) has exhibited a strong bullish reversal from the key support zone near 3325 marked by the red area on the chart The price formed a series of higher lows indicating bullish momentum buildup before breaking out sharply above the descending channel and resistance zone around 3340
Following this breakout, the market is now consolidating above the broken resistance, which is acting as new support signaling a potential continuation of the upward trend
Key Levels
Target 1 3365 3370 grey resistance zone
Target 2 3385 3390 major resistance zone
If price holds above the support at 3340 and continues forming higher lows, we expect bullish continuation toward Target 1 and eventually Target 2 if momentum sustains Traders should monitor price action closely at each target zone for potential reactions or reversals

THE KOG REPORT - UpdateEnd of day update from us here at KOG:
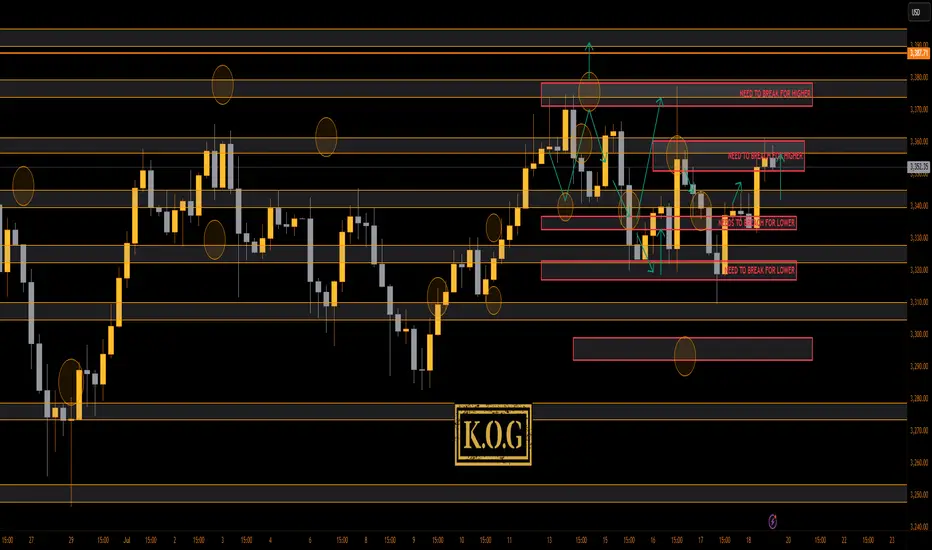
What a week on the markets with our KOG report plan working well, the red boxes moving with price, the Excalibur targets being completed and then most of the bias level targets completing as well.
Have a look at Sundays report and compare the move and levels shared, you'll see how well we've managed to track this. Only thing we haven't got (yet) is that curve ball, so let's see how we close today and open on Sunday.
For now, support below is at the 3340 level with resistance 3370. We may just see a late session move here so play caution.
KOG’s bias for the week:
Bullish above 3350 with targets above 3360✅, 3373✅, 3375✅ and 3383 for now
Bearish below 3350 with targets below 3340,✅ 3335✅, 3329✅, 3320✅ and 3310✅ for now
RED BOX TARGETS:
Break above 3365 for 3372✅, 3375✅, 3382, 3390 and 3406 in extension of the move
Break below 3350 for 3340✅, 3335✅, 3329✅, 3322✅ and 3310✅ in extension of the move
Wishing you all a great weekend and we'll see you on Sunday for the KOG Report. Please do take some time to hit the boost button, it's very much appreciated.
As always, trade safe.
KOG
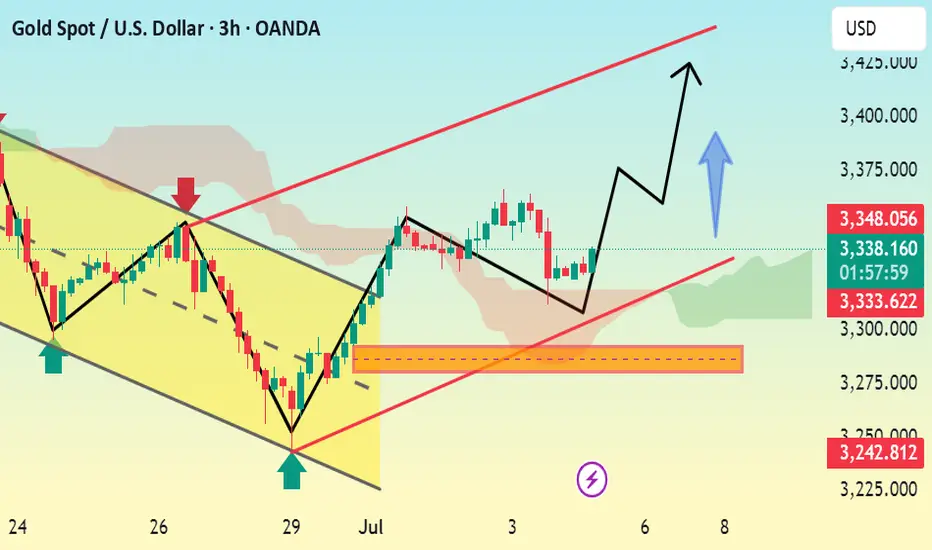
XAUUSD Bullish Outlook – Eyeing 3400+ Zone
Price is currently trading within a rising channel on the 1H timeframe. We are seeing a potential continuation move after a bullish structure was maintained above 3340 support.
🔹 Key Technical Highlights:
Price respecting ascending channel support.
Bullish reaction near lower channel & previous demand zone.
Short-term consolidation may occur near 3375–3385 supply before breakout.
Next key target: 3420–3440 Quasimodo supply zone.

THE KOG REPORT - UpdateEnd of day update from us here at KOG:
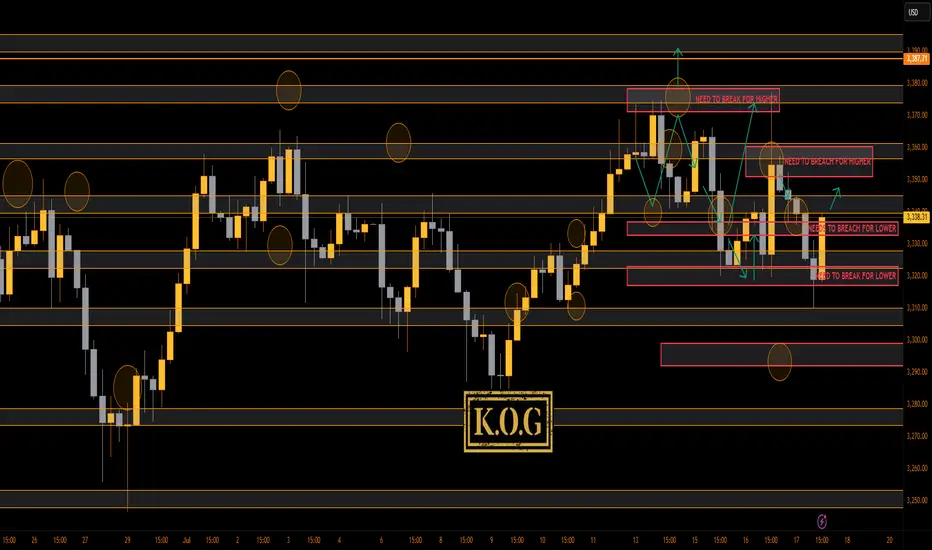
That was a difficult move to capture! I would not blame anyone for getting frustrated and FOMO'ing. Thankfully, we stuck to our guns, price was manipulated but our targets are completed as is the move we highlighted on Sundays KOG Report. I even say here and thought what on earth are they doing, but, we gave a level of 3318 as the line in the sand, we bounced before that and BOOM, all Excalibur targets completed in one go.
Now, we have support below at the 3340-45 level which is where they may settle for the session, above 3340 we're still likely to see a retest of the level, however, we said there is a curveball this week, and look at what is happening. Can't remember the last time I saw price action this bad!
Price: 3337
RED BOXES:
Break above 3350 for 3355✅, 3362✅, 3370✅ and 3376✅ in extension of the move
Break below 3335 for 3330✅, 3322✅, 3320✅ and 3314 in extension of the move
As always, trade safe
KOG

GOLD (XAUUSD): Sticking to the Plan
Update for my last Sunday's post for Gold.
Previously, we spotted a cup & handle pattern on a daily time frame.
It turned into an ascending triangle pattern - another bullish formation this week.
I am sticking to the same plan - our strong bullish signal is a breakout
of a neckline of the pattern and a daily candle close above 3378.
It will confirm a strong up movement.
❤️Please, support my work with like, thank you!❤️
I am part of Trade Nation's Influencer program and receive a monthly fee for using their TradingView charts in my analysis.

THE KOG REPORT - UpdateEnd of day update from us here at KOG:
Nice! Our idea from yesterday worked well giving the short trade into the level we wanted, to then break below the bias level and give us our 2 Gold Excalibur targets and 1 of our red box targets shared with the wider community. We suggested our traders watch the level of 3310 for a potential RIP, and that's exactly what we got upside.
Now, we have support at the 3330-27 level and resistance above at 3340-3. We have a red box above as well so we'll be waiting to see if the close is significant enough for us to target higher tomorrow! For now, keep an eye on the retracement into the 3335-2 level initially.
RED BOXES:
Break above 3335 for 3341, 3355, 3362, 3370 and 3376 in extension of the move
Break below 3320 for 3310✅, 3304, 3297 and 3294 in extension of the move
As always, trade safe.
KOG
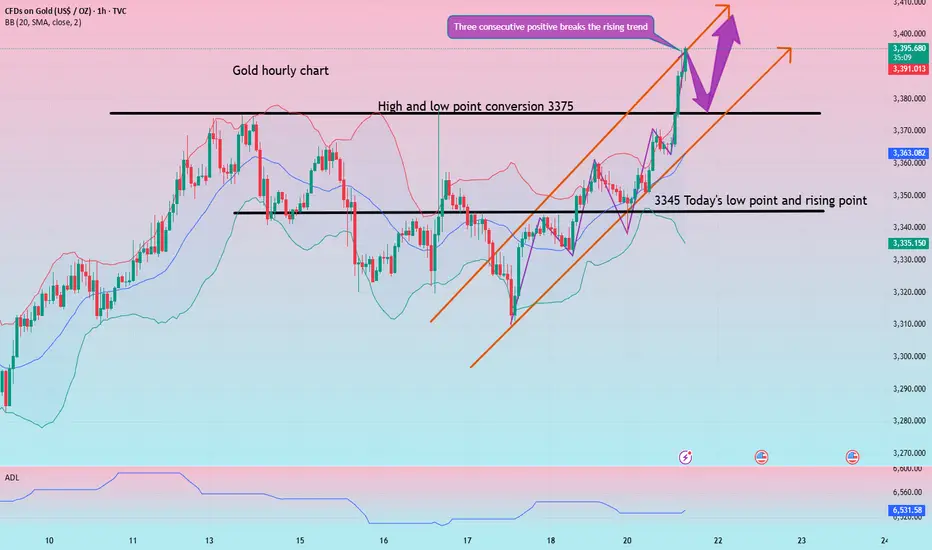
Gold rises continuously and then moves unilaterally? 3375 is the
At the beginning of this week, international gold prices rose, benefiting from the weaker dollar, while investors paid attention to news on trade progress before the US tariff deadline on August 1. As US inflation data was lower than expected and the market may have some defensive bets against tariffs, gold finally rebounded from the main upward trend line again. The lower-than-expected US inflation data did not trigger the market to re-price more hawkish rate hike expectations.
From a larger perspective, as the Fed's easing policy progresses, real yields may continue to fall, and gold should maintain an upward trend.
Views on today's trend!
Today, gold is rising slowly, and basically there is no chance of a correction, so it also led to our opening directly chasing a wave of gains, and the market has actually had some risks after the rebound to above 3370. After all, the 3373-75 line was a dense pressure area before.
From the current hourly chart, gold has been moving along the upper track of the moving average and has accelerated since breaking through the 3375 line. It is possible that it will test the 3410 line today. After all, it is already at the 3395 line, and today's strength and weakness watershed has actually shifted from 3340 to 3375. After all, the top and bottom conversions are raised synchronously!
Gold: Long around 3375, defend 3365, and target 3395-3405!
3 Trading Scenarios To Choose From - Which Do You Prefer? The setup that we're looking at in this video is going to be a potential bearish bat pattern on GOLD.
However, what's more important is the lesson that I wanted to cover on different tactics for adjusting your stop/loss & dig into the pro's and con's of each.
I'd love to hear which way you guys would choose in this particular situation (or in general) so please share your opinion in the comments section below.
Wishing a great weekend and a great upcoming week in the markets.
Akil

XAU/USD (Gold) Key Technical Levels:🔍 Key Technical Levels:
🔼 Resistance Zones:
3365 – 3368: Strong supply zone, price has reacted here multiple times.
3377 – 3380: Next resistance zone with past price rejections.
3393 – 3404: High-level resistance, potential breakout target.
3410: Upper extreme resistance level (major target zone).
🔽 Support Zones:
3337 – 3333: Key support zone aligned with the 50.60% Fibonacci retracement level.
3309: 4-hour support level.
3283 – 3290: Strong demand zone (marked in green).
📈 Bullish Scenario:
If price retraces to 3333 – 3337 and holds:
Potential bounce upward toward:
3365 → 3377 → 3393 → 3404
Look for bullish confirmation (e.g., bullish engulfing, strong volume, or break above local highs).
📉 Bearish Scenario:
If price breaks below 3333 with strong bearish momentum:
Downward targets become:
3309 → 3283
Look for rejection at resistance zones or bearish structure before entering short trades.
⚖️ Neutral / Consolidation Possibility:
Market may range between 3333 – 3365 before a breakout.
Upcoming economic news or events (like those marked on the chart calendar) could act as a trigger.
🔔 Trade Setup Ideas:
Buy Entry: Near 3333 – 3337 with bullish confirmation.
Sell Entry: Below 3333 if price breaks down with strong volume.
Take Profits: At the next resistance levels (3365, 3377, 3393...).
Stop Loss: Slightly below support for longs / above resistance for shorts.
Let me know if you'd like a trading plan, alert script, or breakdown of upcoming fundamental events for Gold.

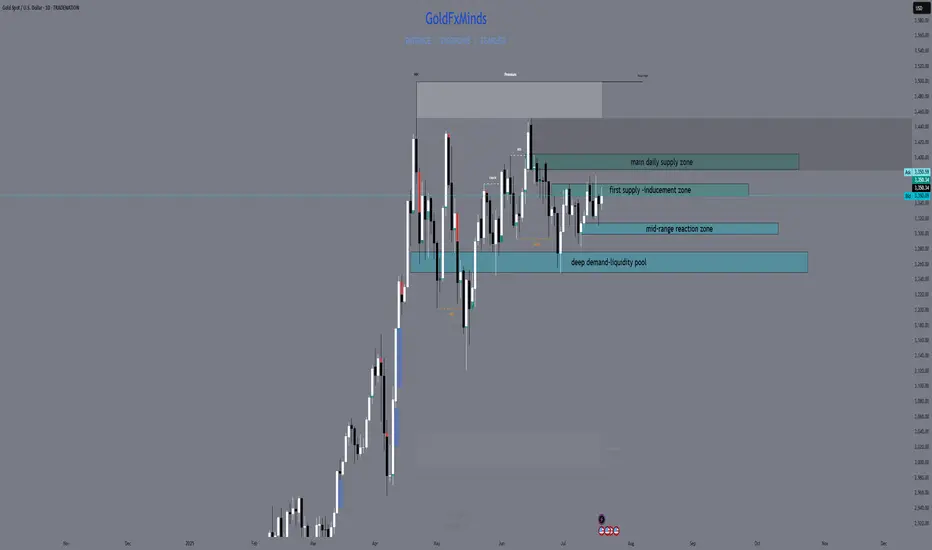
XAUUSD Daily Outlook – July 21, 2025Hey traders 💙
Gold continues to move inside a high timeframe range, with both bulls and bears defending structure at the edges. Price remains stuck between supply and demand — and only the strongest levels matter now. Here’s how the chart truly looks:
🔸 Key Supply Zones
1. 3380–3405: Main Daily Supply / Liquidity Pool Above
This is the top wall of the current range and the zone with the highest supply. Multiple failed breakouts, long upper wicks, and a clear cluster of liquidity just above. Unless we get a solid daily close above 3405, this area remains a trap for late buyers and a magnet for liquidity grabs.
2. 3355–3375: Internal Supply / Inducement Block
This zone has acted as an internal ceiling since the last CPI event. Here, price repeatedly failed to close above, and every return has produced quick rejections or fake breakouts. It often works as an inducement, catching breakout buyers and flipping the market lower.
🔹 Key Demand Zones
1. 3312–3300: Internal Demand / Mid-range Reaction
Here we see a clear reaction point where buyers have defended aggressively after CPI and NY session moves. It’s an internal demand area, often working as a temporary bounce or a place for stop hunts before larger moves.
2. 3275–3250: Main Daily Demand / Liquidity Pool Below
This is the base of the range, holding as support multiple times this month. Every dip into this zone has triggered large bounces, but the liquidity sitting below is also a key magnet for potential sweeps. Only a full daily breakdown here would flip the higher timeframe bias bearish.
📊 Technical Structure & Strategy
We are stuck between Main Supply (3380–3405) and Main Demand (3275–3250).
Every “middle” move is either inducement or a set-up for liquidity collection — not a real trend.
No daily close above 3405 → no bullish continuation.
No breakdown below 3250 → no clean bearish momentum.
Your edge: Only act when price confirms a reaction at a major zone with CHoCH/BOS, strong OB, or a liquidity sweep.
🧠 Takeaway:
This is not the time to guess direction — let the market show its intent at the edges. Use TradingView alerts on your key levels, be ready for volatility from macro news, and don’t get trapped in the mid-range games.
💬 Comment your bias or questions below.
Follow GoldFxMinds for more advanced XAUUSD updates and sniper-level education.
Stay patient, stay precise, and let structure work for you!
Posted using Trade Nation broker feed. As a participant in the Trade Nation Influencer program, I receive a monthly fee for using their TradingView charts in my educational content.
— GoldFxMinds 💙
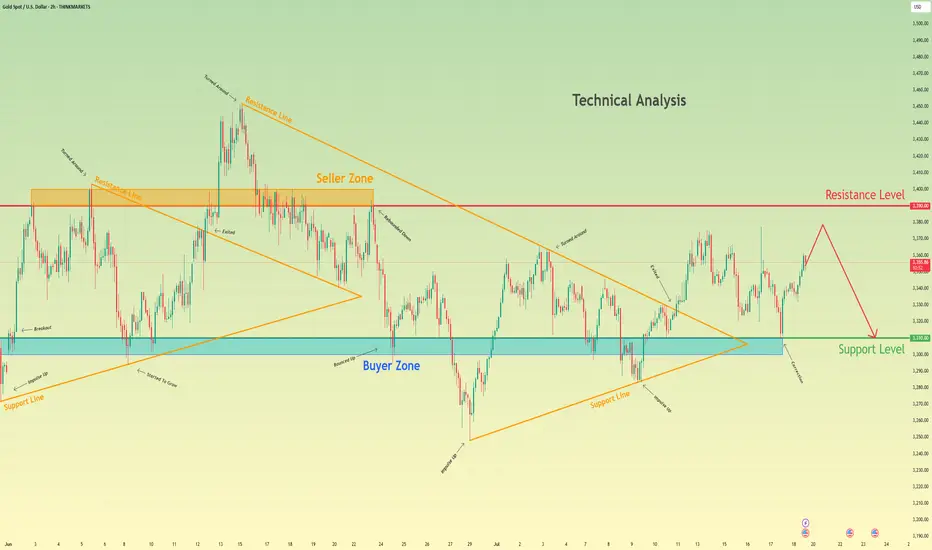
Gold may rise a little and then drop to support levelHello traders, I want share with you my opinion about Gold. Initially, gold was trading within a large consolidating pennant, showing both upward and downward impulses as it moved between the converging trend lines. The price eventually saw a breakout from this pattern, followed by a strong impulse up, but this momentum stalled as it approached the major horizontal resistance level at 3390. This level, which corresponds with the upper seller zone, has proven to be a significant barrier for buyers, rejecting the price and confirming a strong seller presence in that area. Currently, the market is in a corrective phase after being rejected from the highs. The price is drifting upwards once again in what appears to be a final retest of the aforementioned seller zone. This slow upward movement lacks the impulsive strength of the previous trend, suggesting that buyers are losing control and sellers are preparing to defend the 3390 resistance level once more. I expect this corrective move to fail upon reaching the seller zone around 3390. After this retest, I anticipate a sharp reversal and the beginning of a new downward trend. The logical target for this move is the major support level at 3310, an area that has historically acted as a strong buyer zone. That is why my TP is set at 3310. Please share this idea with your friends and click Boost 🚀
Disclaimer: As part of ThinkMarkets’ Influencer Program, I am sponsored to share and publish their charts in my analysis.
Step-By-Step Guide to Building a Winning Gold Trading Strategy
In the today's article, I will teach you how to create your first profitable gold trading strategy from scratch.
Step 1: Choose the type of analysis
The type of analysis defines your view on the market.
With technical analysis you rely on patterns, statistical data, technical indicators, etc. for making trading decisions.
Fundamental analysis focuses on factors that drive the prices of gold such as micro and macroeconomics, news and geopolitics.
A combination of technical and fundamental analysis implies the application of both methods.
For the sake of the example, we will choose pure technical approach.
Step 2: Specify the area of analysis
Technical and fundamental analysis are complex and multilayered subjects. That is why it is crucially important to choose the exact concepts and techniques that you will apply in gold trading.
For example, with a technical analysis, you can trade harmonic patterns, or apply a combination of key levels and technical indicators.
With fundamental analysis, you can build your trading strategy around trading the economic calendar or important news releases.
Here we will choose support & resistance levels and smart money concepts.
Step 3: Select a trading time frame
Your trading time frame will define your trading style. Focusing on hourly time frame, for example, you will primarily catch the intraday moves, while a daily time frame analysis will help you to spot the swing moves.
You can also apply the combination of several time frames.
We will choose the combination of a daily and an hourly time frames.
Step 4: Define your trading zones
By a trading zone, I mean an area or a level on a price chart from where you will look for trading opportunities.
For example, a technical indicator trader may apply moving average as the trading point.
For the sake of the example, we will choose support and resistance levels on a daily time frame as our trading areas.
Step 5: Choose confirmations
Confirmation is your entry reason . It is the set of conditions that indicates a highly probable projected outcome.
For an economic calendar traders, the increasing CPI (inflation) figures can be a solid reason to open a long position on Gold.
Our confirmation will be a local change of character on an hourly time frame.
Step 6: Define your stop loss placement, entry and target selection and desired reward to risk ratio
You should know exactly where should be your entry point, where will be your stop loss and where should be the target.
We will open a trading position immediately after a confirmed change of character, stop loss will lie below the lows if we buy or above the highs if we sell.
Target will be the next daily structure.
Minimal reward to risk ration should be 1.5.
Step 7: Define Your Lot Size and Risk Per Trade
You should have precise rules for the calculation of a lot size for each trade.
For our example, we will strictly risk 1% of our trading deposit per trade.
Step 8: Set trade management rules
When the trade is active, trade management rules define your action:
for example, whether you strictly wait for tp or sl, or you apply a trailing stop loss.
In our strategy, we will move stop loss to entry 10 minutes ahead of the release of the US news in the economic calendar.
Step 9: Back test your strategy
Study the historical data and back test at least 50 trading setups that meet your strategy criteria.
Make sure that the strategy has a positive win rate.
Step 10: Try a trading strategy on a demo account
Spend at least a month on demo account and make sure that you obtain positive overall results.
If you see consistent profits on a demo account, it is the signal for you that your strategy is ready , and it's time to start trading on a real account.
In case of negative results, modify your trading conditions and back test them again, or build a new strategy from scratch.
❤️Please, support my work with like, thank you!❤️
I am part of Trade Nation's Influencer program and receive a monthly fee for using their TradingView charts in my analysis.
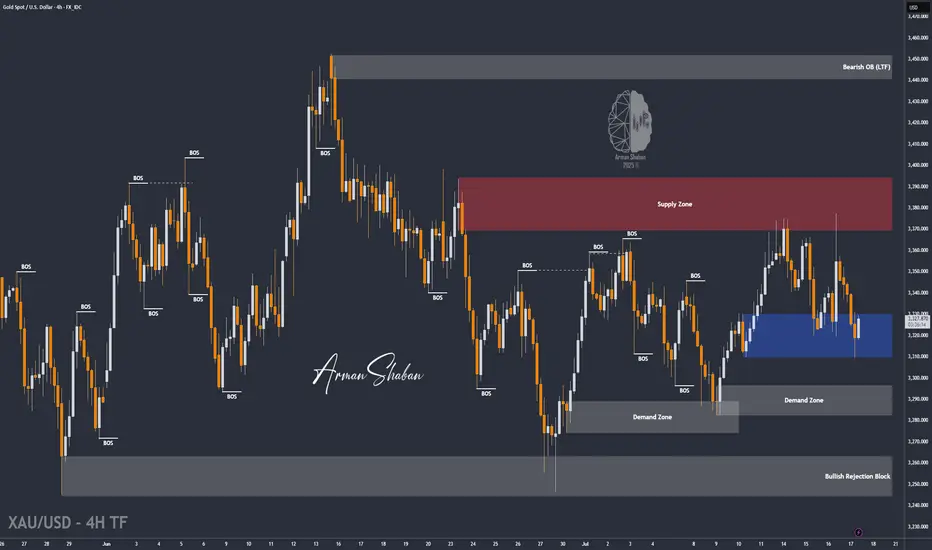
XAU/USD | First LONG to $3345, Then a Potential DROP Below $3300By analyzing the gold chart on the 4-hour timeframe, we can see that last night the price first tapped into the $3340 level, showing an initial push up to $3352. However, the drop intensified soon after, breaking the $3340 resistance and, according to the second scenario, falling to $3310. Upon reaching this key demand level, buying pressure kicked in, pushing the price back up to $3325. Now, the key question is whether gold can hold the $3310 support. If this level holds, we can expect a rise toward $3331 as the first target and $3345 as the second. After this move, a rejection from the $3345 area could trigger another drop, possibly pushing gold below $3300. So, first LONG, then SHORT!
THE LATEST VIDEO ANALYSIS :
Please support me with your likes and comments to motivate me to share more analysis with you and share your opinion about the possible trend of this chart with me !
Best Regards , Arman Shaban
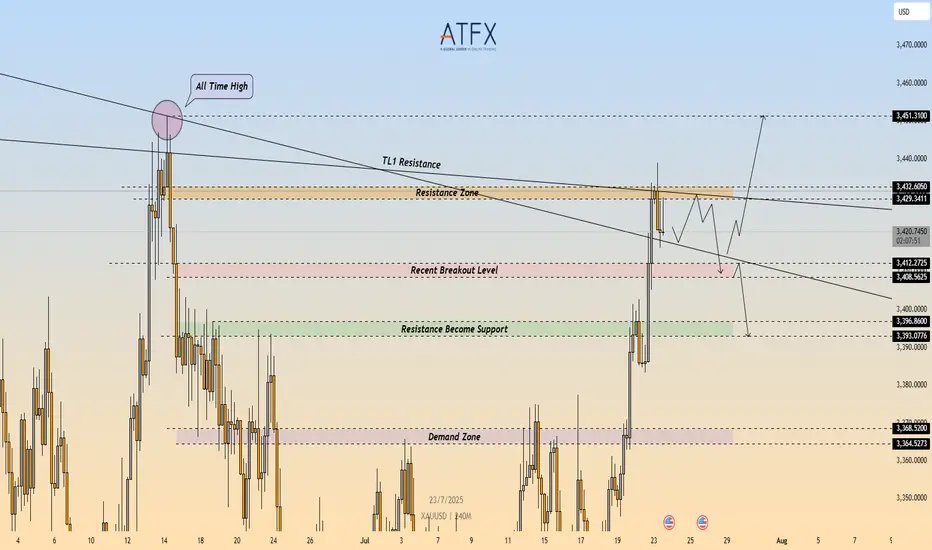
XAU/USD: Bearish Rejection at $3,432 – Short Setup in Play🔴 XAU/USD – Bearish Rejection at Key Resistance Zone ($3,432)
🔍 Technical Outlook
Gold (XAU/USD) failed to break through the $3,429–$3,432 resistance zone, which aligns with a descending trendline (TL1) and prior swing high. The rejection from this confluence zone is reinforcing bearish pressure, with price now carving out lower highs on the 4H timeframe.
A clean break below $3,412 would confirm bearish continuation and open the door toward the $3,400 area, followed by the demand zone at $3,368–$3,365.
🔻 Short Setup
Entry: 3,432
Stop Loss: 3,436
Take Profit 1: 3,412
Take Profit 2: 3,396
R\:R Ratio: ≈ 1 : 6.95
Invalidation: Close above 3,436
📌 Key Levels
Resistance: 3,429 – 3,432
Support 1: 3,412
Support 2: 3,368 – 3,365
Trendline: Long-term descending resistance acting as ceiling
📘 Summary
Gold remains capped beneath a critical resistance cluster. The rejection around $3,432 could trigger a deeper pullback toward $3,396, especially if sellers push price below $3,412. Bearish bias remains valid while price holds under the trendline.
📉 Bias: Bearish
📈 Confirmation Trigger: Break below $3,412
⚠️ Invalidation Level: Above $3,436
XAUUSD CHART PATTERN 2\HTrade Setup (Buy Position):
Entry Point: 3330
Target 1: 3380
Target 2: 3420
Stop Loss: 3290
Strategy Insight
You’re targeting a +50 pip move to Target 1 and +90 pip move to Target 2.
Risk is -40 pips from the entry (3330 → 3290).
Risk-Reward Ratio:
To Target 1: 1.25 : 1
To Target 2: 2.25 : 1
This is a moderately aggressive setup with a good reward potential.
XAUUSD Bearish Structure Breakdown – Targeting 3310 ZoneXAUUSD is currently respecting the key resistance zone near 3340 and forming consistent lower highs, signaling a bearish momentum. After breaking the support area around 3325–3320, we expect price to continue its downward trajectory. If the support fails to hold, the next major target lies at the 3310 zone. This setup aligns with market structure and order flow, suggesting a high-probability sell opportunity on any pullback toward resistance.
Keep an eye on price action near the support zone for confirmation.
Bias: Bearish | Timeframe: 1H
