Gold-Bullish Leg to ContinueGold is Bullish. a minor pullback may happen before it continues its leg up. Looking at uncertainty at global level, Gold might push to 3400.
XAUUSDG trade ideas
XAUUSD CAN FLY HIGHXauusd buy from 3375
Tp1 3385
Tp2 3395
Tp3 3405
Stope lose 3368
Trade at your own risk

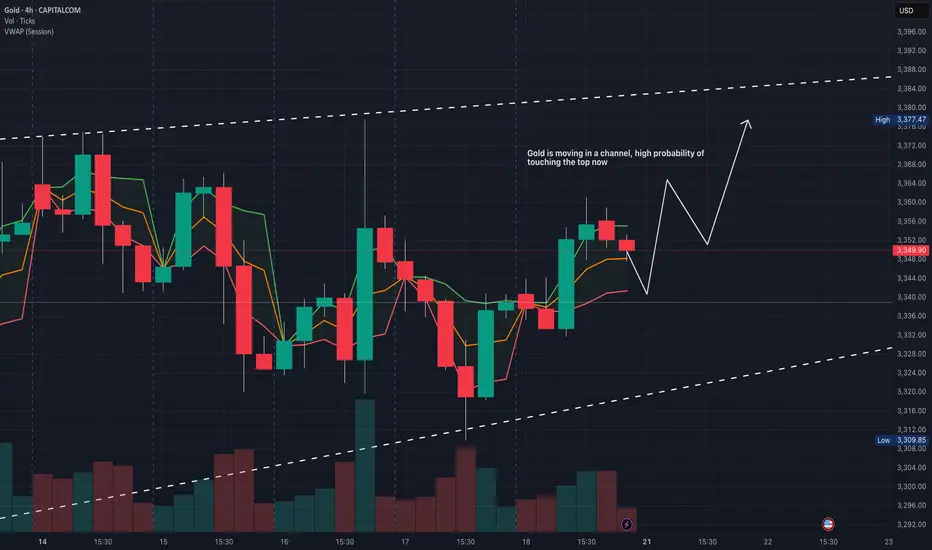
Gold technical outlook – Signs of exhaustion at channel topOANDA:XAUUSD is climbing within a well-defined ascending channel, and price is now brushing up against the upper boundary, a dynamic resistance zone that has historically triggered pullbacks. If price gets rejected here, we may see a healthy correction toward the key support at 3,350, offering a potential reload point for bulls.
Should buyers step in and defend this level, the bullish structure remains intact, setting the stage for a renewed push higher. On the other hand, a clean break below 3,350 could open the door for a deeper retracement toward the lower edge of the channel, where more significant demand may lie.
All eyes should be on price action and volume in this regio, watch for reversal patterns like bullish pin bars or engulfing candles to confirm entries. As always, risk management comes first. Don't trade assumptions, trade confirmations.
What’s your take on this setup? Drop your thoughts below and let’s discuss!

The callback continuity is poor, and the bulls are still strong📰 News information:
1. Geopolitical situation
2. Tariff retaliation
📈 Technical Analysis:
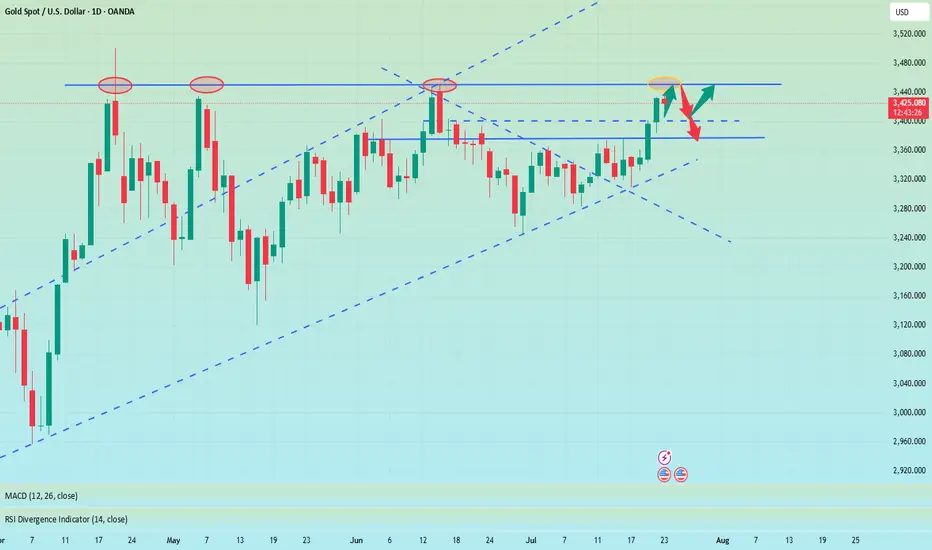
Trump continued to lash out at the Fed, but seemed to have backed off on whether to remove Fed Chairman Powell. The continuous rise of the gold index, once close to 3440, also ushered in a new high in more than a month. Next, we need to pay attention to whether gold can reach the 3450 mark.
Judging from the daily chart, there were three times when it touched around 3450 and then fell back. If it breaks through and stabilizes above 3450 this time, the historical high of 3500 may be refreshed. If it cannot effectively break through 3450, the probability of subsequent retracement is still very high.
From the hourly chart, the bottom support is almost at 3405-3400. However, the recent rhythm belongs to the consolidation of the Asian and European sessions, the US session has begun to rise, and the risk of serious overbought data indicators is still there. This is why I told everyone in the morning that we need to be vigilant about the current rise. Waiting for a pullback to go long is relatively more stable. I also explained in the morning that if it falls below 3405-3400, the decline may continue to around 3385. After all, the fundamental purpose of our trading is to make a profit, so we must minimize the foreseeable risks to the greatest extent possible.
On the whole, if there is an obvious stop-loss signal at 3405-3400, you can consider going long and looking at 3450. Once it falls below 3400, don't chase it easily, and pay attention to the possibility of a retracement below 3385.
🎯 Trading Points:
BUY 3405-3400
TP 3440-3450
In addition to investment, life also includes poetry, distant places, and Allen. Facing the market is actually facing yourself, correcting your shortcomings, facing your mistakes, and exercising strict self-discipline. I share free trading strategies and analysis ideas every day for reference by brothers. I hope my analysis can help you.
FXOPEN:XAUUSD OANDA:XAUUSD FX:XAUUSD FOREXCOM:XAUUSD PEPPERSTONE:XAUUSD TVC:GOLD
Gold Price Analysis July 23📈 Gold Trend Analysis – Strong Uptrend but Signs of Slowdown
Gold continued to set a new peak for the week when closing the day above 3430 – confirming that the uptrend is still dominant. However, buying power is starting to slow down as the market formed a fairly wide range, around 50 prices in today's session.
Profit-taking pressure at high prices can create a short-term correction, opening up two-way trading opportunities for flexible investors.
🔑 Important technical levels (Key Levels):
🔻 Resistance zone & Sell zone:
3445: Price rejection zone – can consider selling if price fails to break through.
3463: Strong Sell zone – expect increased supply here.
🎯 Sell target:
3405: Nearest support, target for short-term sell orders.
🟢 Buy Setup:
3402: Breakout zone in US session – if price breaks strongly through this support with good volume, consider buying on the next uptrend.

Gold (XAU/USD) Technical Analysis:Gold is currently retesting the $3,440 zone — a key level for the next move.
🔹 Bullish Scenario:
If the price breaks and holds above $3,440, we may see a continuation toward $3,455, where a pullback or bearish correction could occur.
🔹 Bearish Scenario:
If selling pressure increases and the price breaks below $3,420 with confirmation, a move down to retest the $3,385 area is likely.
⚠️ Disclaimer:
This analysis is for educational purposes only and does not constitute financial advice. Always do your own research before making any trading decisions.

XAUUSD Analysis todayHello traders, this is a complete multiple timeframe analysis of this pair. We see could find significant trading opportunities as per analysis upon price action confirmation we may take this trade. Smash the like button if you find value in this analysis and drop a comment if you have any questions or let me know which pair to cover in my next analysis.

Weekly Analysis on GOLDFor next week trading session i will wait for buy set up since market structure is still in a bullish trend. There might be a selling opportunity but still i will wait for a great buy set up.

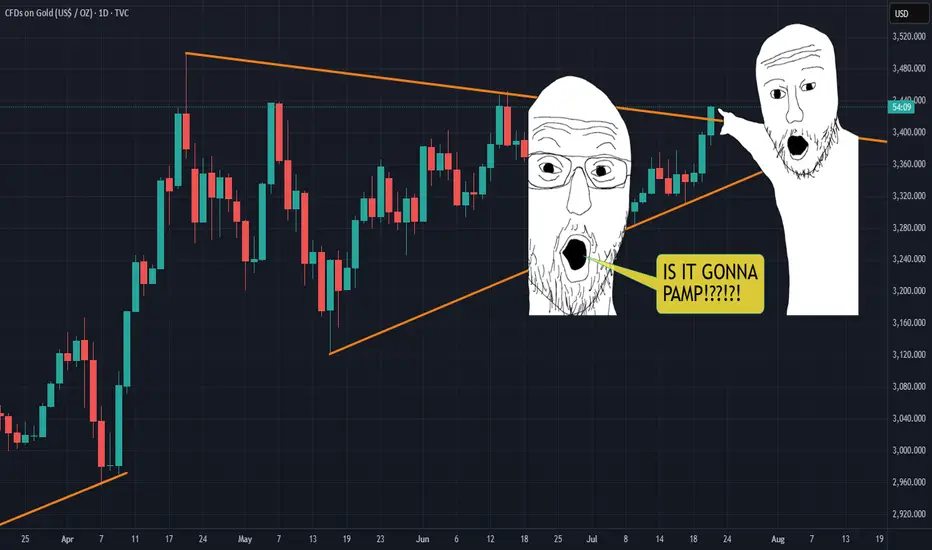
Will we be SHOWERED with GOLDen gainz?!IS IT PAMPIN TIME?!?!?! Looks like it's tryna break out, but beware of the fakeout. WIll it pop or double top!?
To those holding the golden treasure, may the lawd of pamp bless thee with gainz forever.
Gold miners went ham today too... probably nothing. LETS PAMP IT!
THANK YOU FOR YOUR ATTENTION ON THIS MATTER.
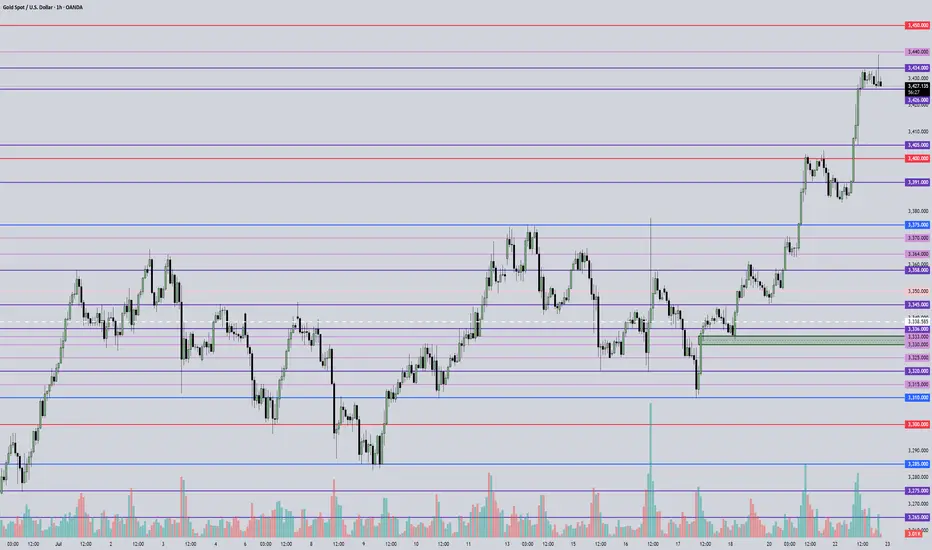
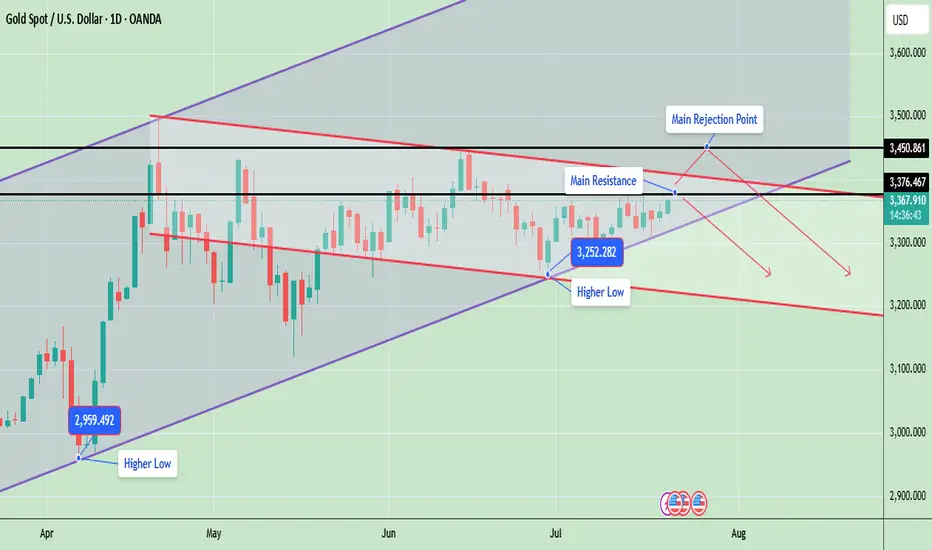
Gold Price Update – Testing Key ResistanceGold is currently trading around 3367, showing strong bullish momentum as it continues to form higher lows, which indicates an ongoing uptrend. The market structure is developing inside a rising wedge pattern, with the price consistently respecting both the ascending support and resistance lines.
Gold is now testing a key resistance zone between 3376 and 3450, an area that previously acted as a major supply zone and caused sharp rejections. A successful breakout and close above 3450 will likely confirm a bullish continuation and may open the door for a rally toward 3500 and possibly 3580. However, if gold fails to break this level, it could retrace back to the 3300 or 3250 support zones, especially if a rejection candle forms in the daily timeframe.
📊 Key Technical Highlights:
- Price has approached the upper resistance boundary of the wedge.
- Daily candle is bullish, indicating strong buying momentum.
- However, unless price closes above 3,376–3,450, there’s still a risk of rejection from the top channel and a pullback toward 3,300–3,250.
🔑 Key levels to watch:
- Gold is currently trading around $3,367, just below a crucial horizontal resistance at $3,376
- A strong breakout above $3,376, and especially above $3,450, could open the door for further bullish movement toward the $3,500–$3,600 range, following the upper trendline of the ascending channel.
- On the downside, if price fails to hold the higher low at $3,252, a drop toward $3,200 or even $3,100 is possible aligning with the downward red trendline.
- The structure remains bullish overall, as price is still making higher lows and staying within the rising channel
📊 Weekly Gold Chart Analysis
Gold is currently trading around $3,368, forming a symmetrical triangle pattern on the weekly timeframe. This pattern typically indicates a period of consolidation before a potential breakout in either direction. The price is getting squeezed between lower highs and higher lows, which is a sign of decreasing volatility and approaching breakout.
🔑 Key Technical Insights:
- ✅ Current Structure: Price has been consolidating within a triangle since April 2025 after a strong upward move. It is now near the apex of the triangle, suggesting a breakout is imminent—most likely in the next 1–2 weeks.
🔼 Bullish Breakout:
- If gold breaks above the triangle resistance (~$3,385–$3,393), it could trigger a sharp rally.
- Upside targets post-breakout: $3,450, $3,500, $3,600+ (if momentum continues)
🔽 Bearish Breakdown:
- A break below the triangle support (~$3,335–$3,325) may lead to a deeper correction.
- Downside targets post-breakdown: $3,285, $3,200
- Possibly $3,100–$3,050 if bearish sentiment intensifies
📉 Volume Drop:
As typical with triangles, volume has likely decreased, signaling indecision. Once volume returns, it will likely confirm the breakout direction.
Note
Please risk management in trading is a Key so use your money accordingly. If you like the idea then please like and boost. Thank you and Good Luck!

XAUUSD buy when touched the black trendlinethis is a high possible scenario which means the Gold will still be on a bullish cycle

XAUUSD For Swing Trade It has broken out of a symmetrical triangle and looking good for a swing trade.

XAUUSD NEW LOOKXauusd sell from 3433
Tp1 3425
Tp2 3415
Tp3 3405
Stopelose 3445
Trade at your own risk

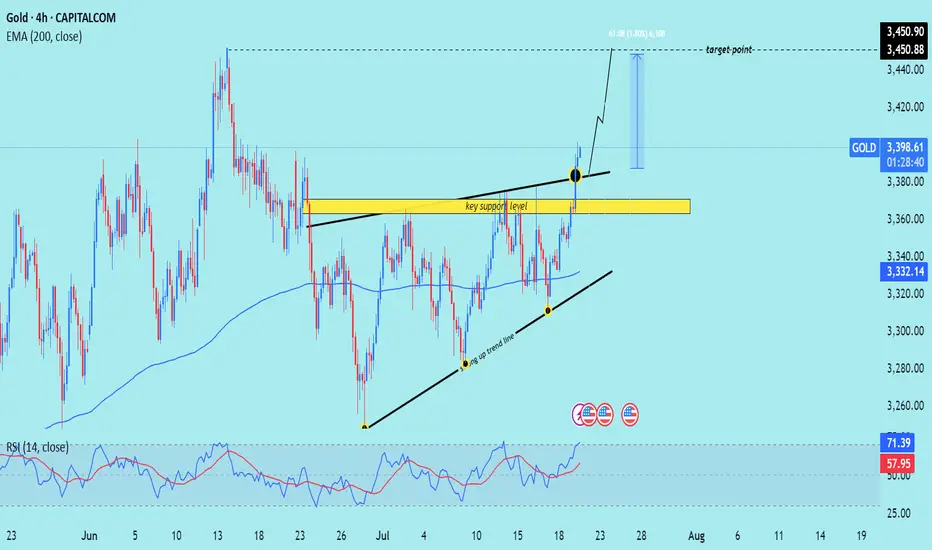
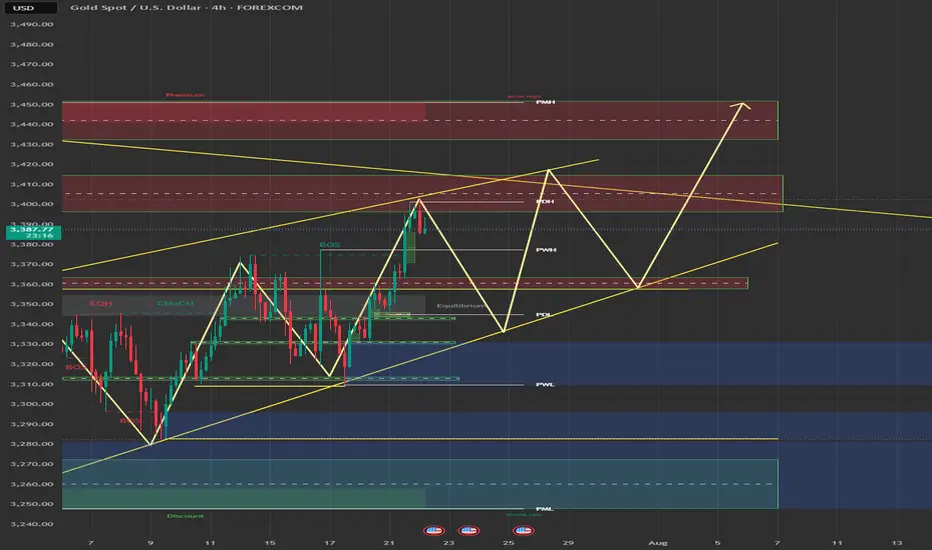
XAU/USD) breakout analysis Read The captionSMC Trading point update
Technical analysis of (XAU/USD) on the 4-hour timeframe, highlighting a move toward the $3,450 target. Here's the full technical breakdown
---
Technical Analysis – Gold (4H)
1. Breakout from Resistance Zone
Price has broken above a key horizontal resistance level (now turned support, marked in yellow).
The breakout is confirmed by a strong bullish candle with momentum, suggesting buyers are in control.
2. Ascending Triangle Formation
Price formed an ascending triangle, a classic bullish continuation pattern.
The breakout above the upper boundary confirms the pattern, projecting a potential measured move.
3. Trendline Support & Higher Lows
The structure shows a rising trendline (black), where price bounced multiple times — confirming a higher low sequence.
The confluence of trendline support + breakout level adds strength to the bullish case.
4. 200 EMA Confluence
The 200-period EMA (3,332.13) has been acting as a dynamic support throughout.
Price retested it earlier in the move, then surged upward — validating trend continuation.
5. RSI Indicator
RSI is at 71.13, entering overbought territory.
This implies strong bullish momentum, but a short-term pullback to retest the breakout level is possible.
6. Target Projection
Target Point: $3,450.90, calculated from the height of the triangle (~61 pts or 1.80%) added above the breakout zone.
A retest of the breakout area (yellow zone) around $3,370–$3,380 could offer a better entry before continuation.
Mr SMC Trading point
---
Summary
Bias: Bullish
Current Price: $3,397.62
Support: $3,370–$3,380 zone (previous resistance turned support)
Trend: Higher lows + breakout above resistance
EMA Support: 200 EMA at $3,332.13
Target: $3,450.90
RSI: 71.13 – bullish but near overbought
Please support boost 🚀 this analysis)
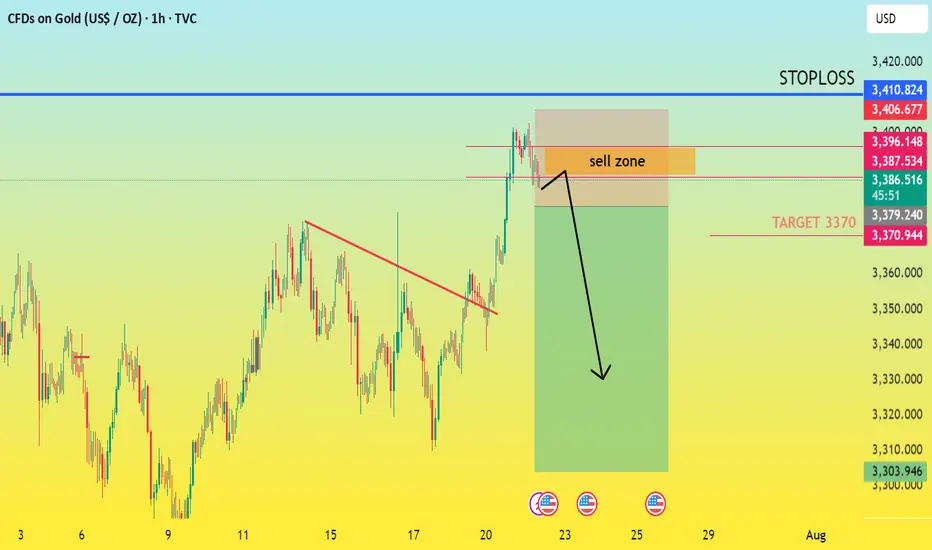
XAUUSD: THE GOLDEN OPPORTUNITY FOR BEARS!FUNDAMENTAL ANALYSIS
Are you ready to capitalize on the impending short-term correction in Gold? XAUUSD is flashing clear sell signals from the 3390 to 3370 zone, setting the stage for a profitable bearish move. Don't miss this chance to ride the downward momentum!
Here's why we anticipate Gold's descent to 3370:
The Ceiling is Here: Key Resistance at 3390-3400
Gold has been grappling with strong resistance in the 3390-3400 area. This level represents a critical juncture where bullish momentum is consistently capped. Multiple attempts to breach this ceiling have been met with selling pressure, indicating a clear supply zone. As long as XAUUSD remains beneath this formidable barrier, the path of least resistance is to the downside
Technical Exhaustion: After a notable rally, Gold is showing signs of being overextended. The recent consolidation around current levels suggests buyer exhaustion and a lack of conviction to push higher. This often precedes a short-term correction to digest recent gains.
Dollar Strength Brewing: While the US Dollar has seen some recent weakness, there are underlying signals that a rebound could be on the horizon. A strengthening Greenback typically exerts downward pressure on dollar-denominated assets like Gold, making it more expensive for international buyers and reducing demand. Keep an eye on the DXY for confirmation.
Targeting the Support Zone: The Path to 3370
Our immediate target for this bearish impulse is the key support zone around 3370. This level is not arbitrary; it aligns with:
Previous Price Action: This level has historically acted as both a support and resistance pivot, making it a significant area of interest for market participants.
Fibonacci Retracement Levels: Depending on the swing high from which we're retracing, 3370 often aligns with a significant Fibonacci retracement level, indicating a probable area for a bounce or temporary halt in the downtrend.
Dynamic Support (e.g., Short-term EMAs): Falling prices are likely to find their first significant bounce around the 50-period Exponential Moving Average (EMA) on shorter timeframes, which often converges around this 3370 level.
Trade with conviction and precision! The bearish short trend in XAUUSD from 3390 offers a compelling opportunity for sellers to target the 3370 support. Prepare to act decisively as the market unfolds.
ENTRY POINT 3390
TARGET 3370
STOPLOSS 3400
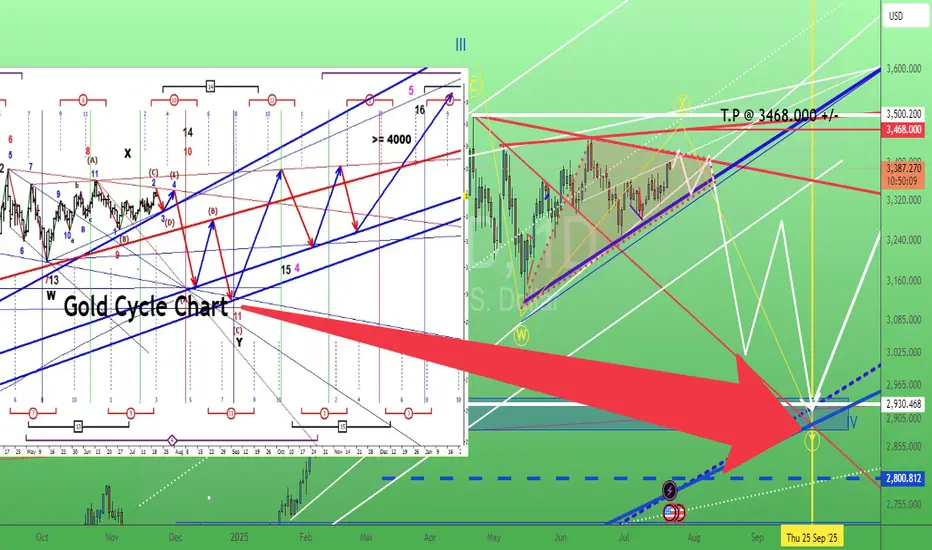
Gold is forming a bull or bear triangle. 22/July/25XAUUSD. is gold forming a bearish or bullish triangle, but the cycle chart shown it is pointing to the "south", maybe my analysis s is "wrong"...
Gold - Week of 21st July (updated)Market Outlook Update
Following up on Sunday evening’s analysis — honestly, I didn’t expect the move to unfold this quickly. We’ve still got questions on the table: will the market call Trump’s bluff, or just shrug it off? The Euro certainly didn’t ignore the developments, as we saw with that strong bullish London session yesterday.
Will we see one or two more retracements? Or is the market gearing up for a favourable month-end close? Either way, I hope you’re kicking off the week with high energy — because XAUUSD is primed for fireworks. With Powell speaking tomorrow, expect increased volatility and some fakeouts. Stay sharp, stay focused — it’s all about reading the true structure and keeping it 100% sniper.
Key Intraday Zones
🔻 Main Sell Zone: 3440–3452
This is our strongest supply area for now. Last touch saw aggressive selling. If price revisits this zone, look for a clear rejection: wick rejections, bearish engulfing, or BOS on M5/M15.
⚠️ No FOMO — only short if the market shows real weakness.
🔁 Flip/Sell Zone: 3412–3427
This is the "chameleon" zone — flips between support and resistance. Price often hunts liquidity here. Watch for a sweep or a sharp rejection before entering.
✅ Look for confirmation: clean rejection or a break back below.
🟢 Buy Zone: 3360–3372
Last strong base of buyers. If price drops into this range, wait for a solid bullish response: long wicks, bullish engulfing candles, or a CHOCH.
🚫 Don't catch a falling knife — wait for buyers to show up.
🟩 3345–3350 (Main H1 Demand / Flip Zone)
Why it matters: Strong structural flip — former resistance turned demand + previous session low. A deeper pullback here offers a solid swing re-entry.
📌 Enter only on confirmation: strong wick, CHOCH, or clear reversal pattern.
🎯 Swing Target Zone: 3380–3420
🔸 Decision Zone: 3395–3405
Keep an eye here — this zone may dictate the short-term direction.
Disclaimer: For educational context only.
XAUUSD TRADE SETUPWait for retest the entry level and bullish momentum then take a trade for Buy otherwise skip this setup

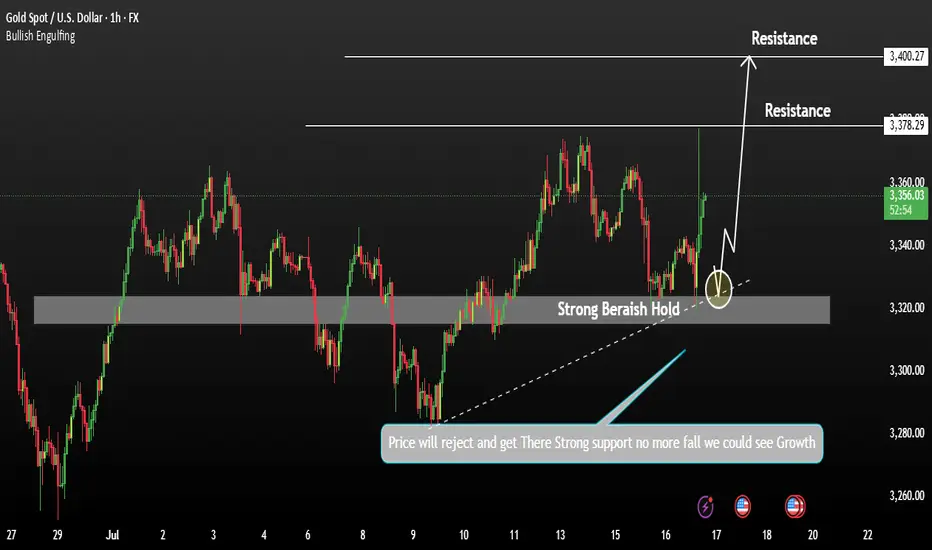
Gold Pullback in play Aiming Growth for 3400Gold prices initially rejected from recent highs and found strong support, indicating limited downside. Despite the recovery, gold remains under pressure due to rising U.S. bond yields and a stronger U.S. dollar. The higher-than-expected inflation data from the U.S. has reduced the likelihood of an early Fed rate cut, which is weighing on the metal.
Technical Analysis:
If the 1H candle closes above 3350, the price is likely to push back into the bullish zone.
Potential upside targets: 3378 and 3400
You any see more details in the chart.
PS: Support with like and comments for more better insights Thanks for Supporting.
Gold has broken trendline and consolidatingGold has broken trendline and consolidating in narrow zone waiting for bullish fundamental cue.

xauusd ideaposible buy At the confluence of additional Fibonacci extensions, we have an institutional price that can be visited before rising through those highs.

July 22, 2025 - XAUUSD GOLD Analysis and Potential OpportunitySummary:
Currently watching the 3450–3452 zone closely — a key resistance area. Strategy remains to buy on pullbacks, but if price fails to break this resistance, short setups become more favorable. Keep an eye on 3426 support — if it breaks, bearish momentum may strengthen. As always, observe price action at key levels and adjust accordingly.
🔍 Key Levels to Watch:
• 3460 – Resistance
• 3450–3452 – Critical resistance zone
• 3440 – Resistance
• 3435 – Resistance
• 3426 – Key support
• 3405 – Support
• 3400 – Psychological level
• 3375 – Support
• 3364 – Support
📈 Intraday Strategy:
• SELL if price breaks below 3426 → target 3420, then 3415, 3410, 3405
• BUY if price holds above 3434 → target 3440, then 3445, 3450, 3455
👉 If you find this helpful or traded using this plan, a like would mean a lot and keep me motivated. Thanks for the support!
Disclaimer: This is my personal view, not financial advice. Always use proper risk control.