Gold Reload at 3360? Let the Fib Do the Work3360 lines up with key support and the 0.618 Fib—ideal zone for bulls to step back in.
If price holds this level, we may see a continuation toward 3389 and 3400
Plan stays simple: buy the dip, let the trend do the heavy lifting.
XAUUSDG trade ideas

XAUUSDGold is trading inside a rising wedge on the 4H chart — typically a bearish reversal pattern but often bullish during strong trends. Price consistently respects this zone during retracements, offering reliable bounce setups. Each Golden Pocket bounce aligns with a rising trendline, strengthening the support zone.
Price is hovering below upper wedge resistance — suggesting a possible pullback to the lower trendline. Another bounce at Golden Pocket + trendline could offer a long entry. A breakdown below trendline support could shift sentiment toward a deeper correction.
If You Fallow our analysis and enjoy from this analysis
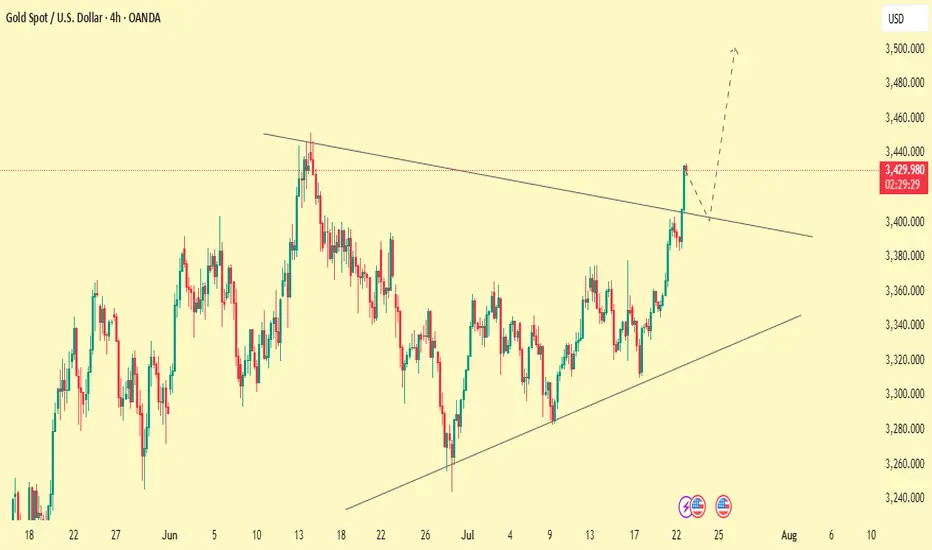

GOLD → Consolidation before the next jump to 3450?FX:XAUUSD continues to rally, with the price updating its local high to 3438 and moving into consolidation, possibly for another jump...
After hitting a five-week high of $3,438, traders are taking a break. Optimism is fuelled by Trump's statements about the largest deal with Japan and negotiations with Canada, but uncertainty about the details of the agreements and political instability in Japan are keeping caution in check. The market is waiting for further signals on trade and political issues, which remain key factors for gold.
Technically, the dollar continues to fall, which generally supports gold. But! Gold is approaching strong resistance at 3445-3450, where growth may be temporarily halted.
Resistance levels: 3433, 3446
Support levels: 3416, 3401, 3375
As part of a local correction, gold may test consolidation support or 0.5-0.7f before continuing to rise. There are quite a few orders in the 3433-3446 zone, and it will be difficult to break through this area to reach the target. Consolidation before this level may help the rise to continue.
Best regards, R. Linda!

Institutional Footprint Detected Gold Hits FVG + Breaker Block.GOLD has now entered a significant confluence zone, aligning with both a bullish Fair Value Gap (FVG) and a breaker block areas commonly respected by institutional algorithms. In the process, it has also swept sell-side liquidity resting below recent lows, which often serves as fuel for a reversal. This combination of technical factors suggests a high-probability scenario for a bullish bounce from this region.
Traders should closely monitor price behavior around the marked Equal Relative Liquidity (ERL) zone for additional confirmation before executing any trades.
Always conduct your own analysis (DYOR) and manage risk accordingly.

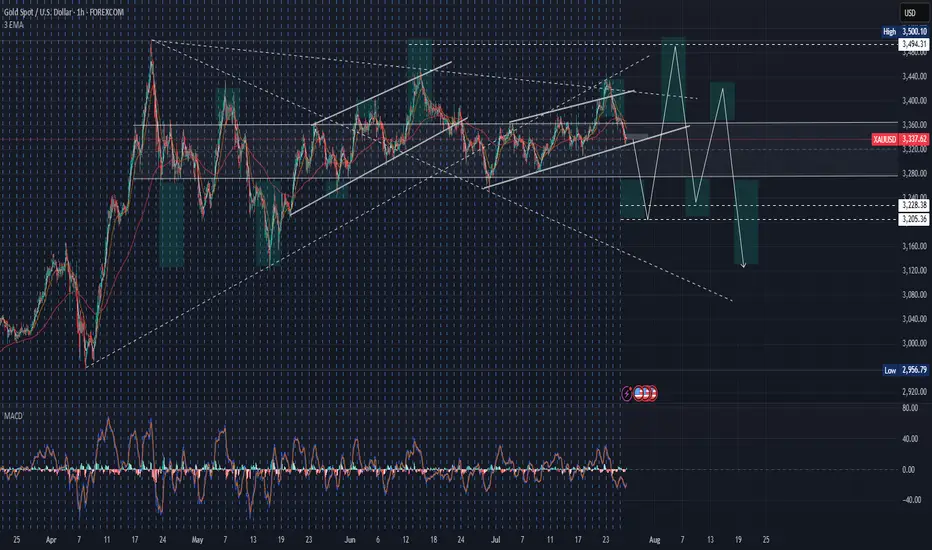
Monday market forecast and analysis ideas#XAUUSD
There will be a lot of data next week, such as the 8.1 tariff deadline that I have repeatedly emphasized, the Federal Reserve decision, NFP data, etc. It can be said that it is relatively difficult to analyze purely from a technical perspective, because there is uncertainty in many data, the data results are often non-linearly correlated with market reactions (good news does not necessarily lead to a rise, and bad news does not necessarily lead to a fall), and large fluctuations can easily form oscillating K-lines with long upper and lower shadows. Therefore, the first arrangement for next week is to participate in trading with a light position and avoid letting emotions control your thinking.
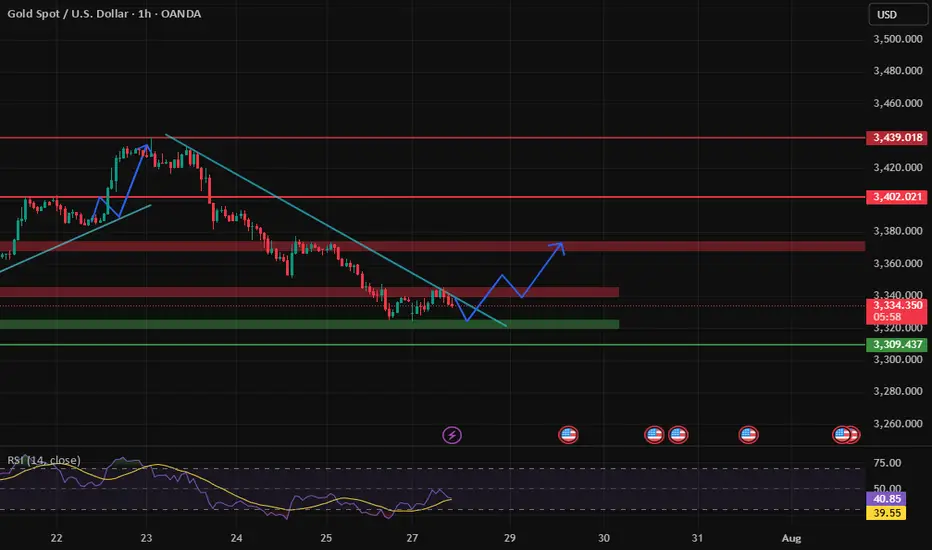
The closing price on Friday was near 3337, proving that the short-term judgment on the rebound momentum of gold is correct, so there are two possible situations on Monday.
1. The first thing we need to pay attention to is 3345-3350 to determine whether it constitutes a short-term pressure level. The weekly line closed with a negative cross star. Combined with the monthly line trend, in terms of support, focus on the trend line support near this week's low of 3325. If this position is not broken, the market is expected to usher in a wave of rebound; if it falls below 3325, the bottom may look to 3310 or even 3295 for support.
2. The rebound momentum of Friday continued on Monday, breaking through 3350 first, and then it is possible to reach the previous high resistance area of 3370-3380. If it encounters resistance here, gold will continue to fall and fluctuate, and the target may even be 3310. If the price remains strong and issues such as interest rate cuts and tariffs are imminent, it means that the short-term downward trend has ended and may even set a new high.
The above content is only a forecast for Monday’s market. It will be greatly affected by data and news, and may be adjusted in real time next week based on intraday trends. You can refer to this, but remember not to be swayed by emotions. We will participate with a light position, and the specific trading strategy can wait for my trading signal.

Gold (XAUUSD) - Liquidity Sweep Setup and Long Bias PlanPrice is currently respecting my projected structure and moving in line with expectations. I'm anticipating a deeper liquidity sweep into the marked demand zones below, where multiple liquidity pools are likely to be taken out. These areas have historically provided strong reactions.
🟦 Key Zones:
Three stacked liquidity sweep levels are highlighted, where previous lows and stop clusters are expected to be swept.
Watch closely for bullish reaction after liquidity grab in these zones.
🟢 Plan:
Looking for potential Entry Long after confirmation from the sweep and market structure shift.
Expecting price to accumulate, fake out with a final sweep (as sketched), and then launch upwards.
If the sweep completes and the structure confirms, targeting a strong bullish continuation move.
📈 Context:
Higher timeframe bullish structure still intact.
Setup aligns with ICT Smart Money Concepts – targeting liquidity and institutional order flow behavior.
💡 This idea will be updated as the setup develops. Trade safe and wait for confirmation.

GOLD (XAU/USD) SHORT TRADE PLAN
July 25, 2025
Trade Overview (My setup)
- Direction: Short (SELL)
- Entry Price: $3,330
- Take-Profit: $3,270
- Stop-Loss: $3,370
- Lot Size: 0.18 lots (18 oz)
- Risk: $720
- Reward: $1,080
- Risk/Reward Ratio: 1.5 : 1
Technical Analysis Supporting the Bearish Bias
1. Price Structure & Trend
- Descending channel observed on the 4H chart - strong short-term bearish signal.
- Series of lower highs and lower lows confirms bearish trend.
- Price is testing $3,325-$3,300 support - breakdown opens downside to $3,270-$3,250.
2. Key Support/Resistance Zones
- Key support: $3,300 being tested.
- Resistance: $3,360-$3,370 zone - logical stop-loss location.
3. Indicator Confirmations
RSI (4H): ~35-40, bearish territory, no bullish divergence.
Moving Averages: Price below 50 EMA and 200 EMA - bearish crossover.
MACD: Bearish crossover, histogram confirms selling momentum.

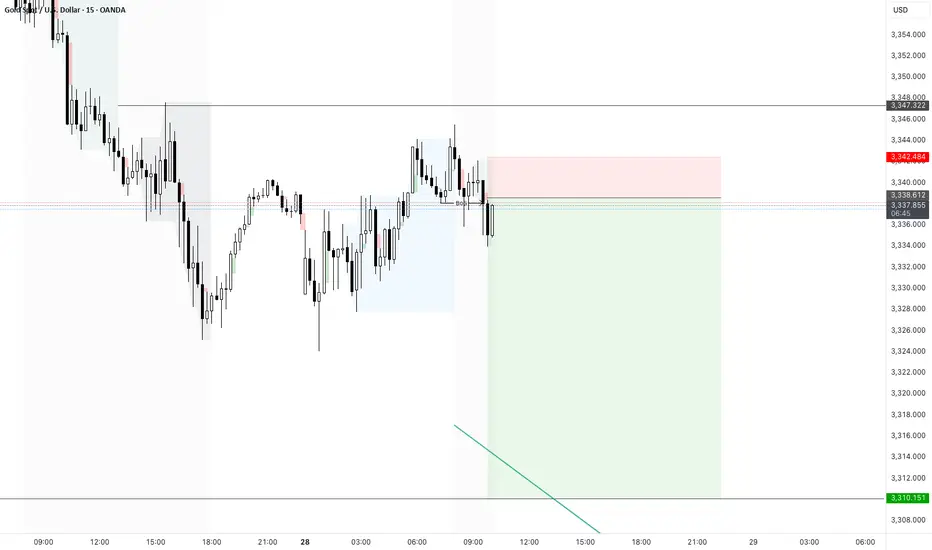
XAUUSD -28/5/25 - Day trade in bearish directionWatching DXY i noticed some string bullish momentum in the dollar.
As a result it looks like gold may have continued weakness today.
I see a pivot formed on the 15in and taking a bearish trade to the hight time frame liquidity equal levels below.
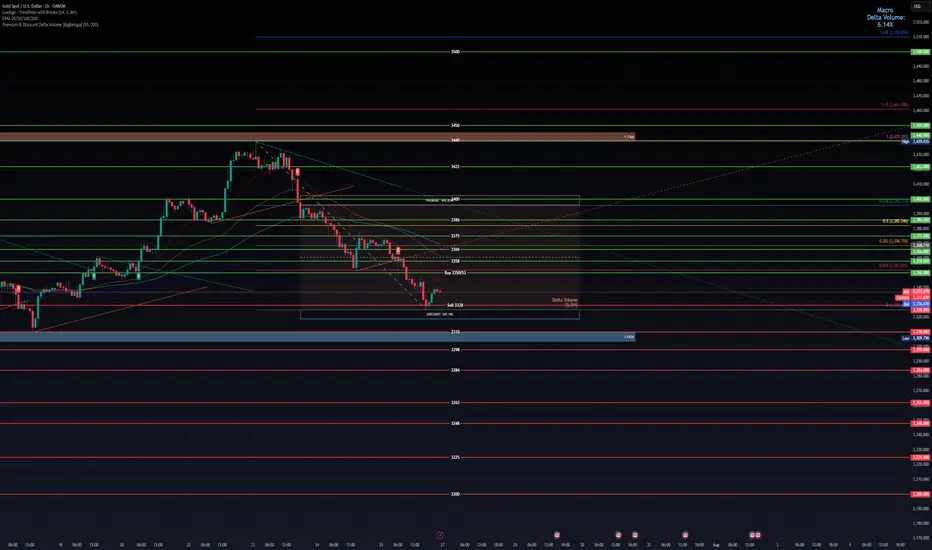
Gold weekly chart with both buy and sell entriesAnalysis of the Buy Entry: 2350/52
This level has been chosen as a potential long entry point due to a confluence of several technical factors.
Smart Money Concepts (SMC) - Discount Zone: The chart has a "Premium - Discount" range drawn over the recent downward price leg. The equilibrium (EQ) level is marked in the middle. According to SMC principles, traders look to buy assets at a "discount" (below the 50% EQ level) and sell at a "premium" (above the EQ level). Your buy entry at 2350/52 is located deep within the discount zone, making it an attractive price from this perspective.
Key Horizontal Support Level: The 2350 price is a significant psychological and technical level. Looking to the left of the chart, this area has previously acted as both support and resistance. By placing a buy order here, you are anticipating that this historical support level will hold again and cause price to bounce.
Potential Mean Reversion: At the point of entry, the price is significantly extended below the moving averages (the thin red, orange, and green lines). This can sometimes indicate an "oversold" condition in the short term, increasing the probability of a corrective bounce back up towards the moving averages (the "mean").
In summary, the buy entry is a calculated risk, betting on a bounce from a confluence of a deep discount price, a strong historical support level, and an oversold condition.
Analysis of the Sell Level: 2328
This level is critically important and likely serves two potential purposes: as a stop-loss for the buy trade, or as a trigger for a new short (sell) position.
Breakdown of Major Support: The chart highlights a significant support zone (the thick blue/grey box) roughly between 2330 and 2334. Your sell level at 2328 is placed just below this entire support structure and also below the most recent swing low. A price break below 2328 would signify a failure of this support, confirming that sellers are still in firm control.
Confirmation of Bearish Trend Continuation: In a downtrend, the price makes a series of lower highs and lower lows. A move down to 2328 would create a new lower low, reinforcing the bearish market structure and suggesting that the price is likely to continue much lower. This makes it an ideal place to exit a long position (cut losses) or to initiate a new short position to follow the dominant trend.
Order Flow and Volume Clues:
The note "Delta Volume?" next to this level suggests you are looking for confirmation from order flow data. A strong negative delta (more aggressive sellers than buyers) as the price breaks 2328 would provide strong confirmation for a short trade.
The label "LVN 2334.86" indicates a Low-Volume Node from a volume profile analysis. Price tends to move very quickly through these areas of low liquidity. By placing the sell level below the LVN and the support zone, you are anticipating an acceleration or a "flush" downwards once these key levels are breached.
In summary, the 2328 level is the invalidation point for the bullish "bounce" idea. If the price reaches this level, the reasons for buying are no longer valid, and the evidence strongly points towards a continuation of the downtrend.
Overall Strategy
The plan is to:
Enter a counter-trend long at 2350/52, anticipating a bounce from a strong support and discount zone.
Define risk by placing a stop-loss just below the key support structure at 2328.
Potentially use the 2328 level as a trigger to close the long and open a new short position to trade with the dominant bearish trend if the support level fails.
GOLD Possible Scenario Gold break the Major support but the price didnot pullback so aggressively and buyers have reduced looks like it will likely go down to 3300-3280 range. the major sell point will be 3355-3360.

XAUUSD clean to dropXAUSD CLEAN TO DROP for the next 3 weeks
I will bee waiting for this set up and now all that we need is patience

XAUUSD 28/2/25 - Morning bullish pushBased on the 1hr- there is a break of structure and i am looking for a bullish move this morning.
There is a chance that this trade fails as there is a 4hr equal low liquidity below which could draw the price to.
Im still going to take this trade and let price do its thing today.

Gold Continues Mild Uptrend – Watching for Reaction at $3351📊 Market Overview:
Gold maintained its bullish momentum during the Asian–European session, rising from $3330 to $3344. A slightly weaker USD and safe-haven demand supported prices. However, price is now approaching a key resistance zone, where technical rejection may occur in the U.S. session.
________________________________________
📉 Technical Analysis:
• Key near-term resistance: $3345 – $3351
• Stronger resistance (higher zone): $3360 – $3366 and $3374
• Nearest support: $3335 – $3332
• Stronger support (lower zone): $3322 – $3315
• EMA 09 (H1): Price is above EMA09 → confirms short-term uptrend
• Candlestick / Volume / Momentum:
• Price is consolidating in an ascending triangle
• A breakout above $3345 may target $3360+
• RSI remains below overbought; volume is stable → room for continuation
________________________________________
📌 Outlook:
If gold holds above $3335 and breaks above $3351, the uptrend could extend toward the $3366–$3374 zone. However, failure to break $3351 followed by a drop below $3332 could lead to a deeper pullback toward $3315.
💡 Recommended Trading Strategies:
BUY XAU/USD: $3318 – $3315
🎯 TP: 40/80/200 PIPS
❌ SL: $3321
SELL XAU/USD: $3360 – $3363
🎯 TP: 40/80/200 PIPS
❌ SL: $3357

Gold protracted consolidation The Gold remains in a bullish trend, with recent price action showing signs of a continuation breakout within the broader uptrend.
Support Zone: 3308 – a key level from previous consolidation. Price is currently testing or approaching this level.
A bullish rebound from 3308 would confirm ongoing upside momentum, with potential targets at:
3387 – initial resistance
3400 – psychological and structural level
3435 – extended resistance on the longer-term chart
Bearish Scenario:
A confirmed break and daily close below 3308 would weaken the bullish outlook and suggest deeper downside risk toward:
3290 – minor support
3268 – stronger support and potential demand zone
Outlook:
Bullish bias remains intact while the Gold holds above 3308. A sustained break below this level could shift momentum to the downside in the short term.
This communication is for informational purposes only and should not be viewed as any form of recommendation as to a particular course of action or as investment advice. It is not intended as an offer or solicitation for the purchase or sale of any financial instrument or as an official confirmation of any transaction. Opinions, estimates and assumptions expressed herein are made as of the date of this communication and are subject to change without notice. This communication has been prepared based upon information, including market prices, data and other information, believed to be reliable; however, Trade Nation does not warrant its completeness or accuracy. All market prices and market data contained in or attached to this communication are indicative and subject to change without notice.

XAUUSD and AUDUSD Analysis todayHello traders, this is a complete multiple timeframe analysis of this pair. We see could find significant trading opportunities as per analysis upon price action confirmation we may take this trade. Smash the like button if you find value in this analysis and drop a comment if you have any questions or let me know which pair to cover in my next analysis.

Gold. Bull Trap "triangle". 28/July/25XAUUSD, by checking gold latest speed of chart with its cycle. we might have a bull 'trap" triangle. A base for rallying to ATH again before a very deep pullback toward 233 Daily EMA which have not been "touched" for long time...

XAUUSD REBOUNDED FROM CURRENT TRENDLINE. WHAT'S NEXT?XAUUSD REBOUNDED FROM CURRENT TRENDLINE. WHAT'S NEXT?
Gold had successfully rebounded from the trendline, still showing mid-term bullish trend despite recent news on U.S. - E.U. and U.S. - Japan trade deals. Currently price is attempting to hold above the EMA20 on 1-h chart timeframe.
If this occurs and the asset develops another short-term bullish impulse, we may expect the price to reach 3,360.00 resistance level with further possible impulse towards 3,400.00 level.

XAUUSD Outlook – From Bias to Execution Previous day closed bearish on XAUUSD, leading to a sell bias, On the 45M, I am looking out for possible entry and exit after a valid breakout of the bearish pennant, in line with my sell bias.

Elliott waveAccording to the bearish structure, the ABC wave is completed, there are 5 more bearish waves.
Sell 3334, stoplos 3344, tp 3310

XAUUSD - Scalping ideaPrice is stuck in a range between 3348.90 and 3324.87.
📌 Looking for a clean breakout to take action:
Buy above 3348.90 → Targeting 3354.09
Sell below 3324.87 → Targeting 3319.15
Not interested in any trades inside the range only jumping in once we break out and close outside either level. Waiting for confirmation to avoid getting chopped up.
Let’s see where it goes. 📉📈
No rush, just reacting.