XAUUSDG trade ideas

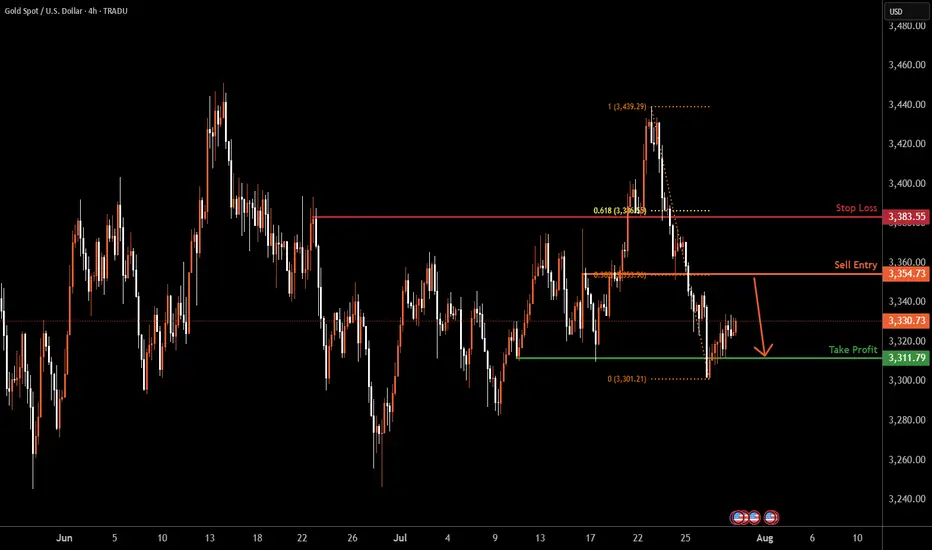
XAUUSD H4 | Heading into pullback resistanceBased on the H4 chart analysis, the price is rising towards the sell entry, which is a pullback resistance that lines up with the 38.2% Fibonacci retracement and could drop to the take profit.
Sell entry is at 3,354.73, which is a pullback resistance that aligns with the 38.2% Fibonacci retracement.
Stop loss is at 3,383.55, which is a pullback resistance that is slightly below the 61.8% Fibonacci retracement.
Take profit is at 3,311.79, which is a multi-swing low support.
High Risk Investment Warning
Trading Forex/CFDs on margin carries a high level of risk and may not be suitable for all investors. Leverage can work against you.
Stratos Markets Limited (tradu.com ):
CFDs are complex instruments and come with a high risk of losing money rapidly due to leverage. 65% of retail investor accounts lose money when trading CFDs with this provider. You should consider whether you understand how CFDs work and whether you can afford to take the high risk of losing your money.
Stratos Europe Ltd (tradu.com ):
CFDs are complex instruments and come with a high risk of losing money rapidly due to leverage. 66% of retail investor accounts lose money when trading CFDs with this provider. You should consider whether you understand how CFDs work and whether you can afford to take the high risk of losing your money.
Stratos Global LLC (tradu.com ):
Losses can exceed deposits.
Please be advised that the information presented on TradingView is provided to Tradu (‘Company’, ‘we’) by a third-party provider (‘TFA Global Pte Ltd’). Please be reminded that you are solely responsible for the trading decisions on your account. There is a very high degree of risk involved in trading. Any information and/or content is intended entirely for research, educational and informational purposes only and does not constitute investment or consultation advice or investment strategy. The information is not tailored to the investment needs of any specific person and therefore does not involve a consideration of any of the investment objectives, financial situation or needs of any viewer that may receive it. Kindly also note that past performance is not a reliable indicator of future results. Actual results may differ materially from those anticipated in forward-looking or past performance statements. We assume no liability as to the accuracy or completeness of any of the information and/or content provided herein and the Company cannot be held responsible for any omission, mistake nor for any loss or damage including without limitation to any loss of profit which may arise from reliance on any information supplied by TFA Global Pte Ltd.
The speaker(s) is neither an employee, agent nor representative of Tradu and is therefore acting independently. The opinions given are their own, constitute general market commentary, and do not constitute the opinion or advice of Tradu or any form of personal or investment advice. Tradu neither endorses nor guarantees offerings of third-party speakers, nor is Tradu responsible for the content, veracity or opinions of third-party speakers, presenters or participants.
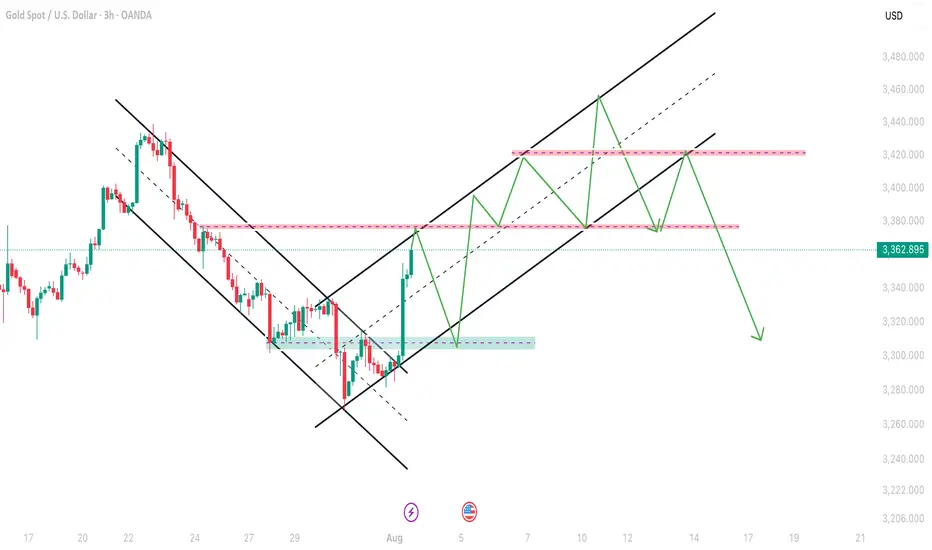
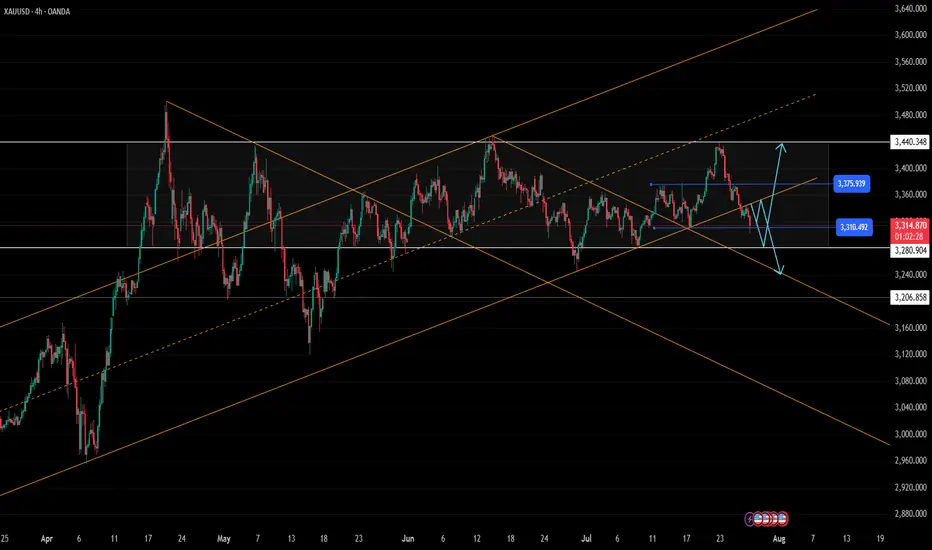
Gold next prediction Aug 4 onwardsAs you can see in this chart gold was moving in a downtrend channel and after a big breakout in Non-Farm Gold moves to 3362 so now it will make a new Bullish channel in which first hurdle will be 3374-3380 and then can retrace till 3H and 4H chock point and then can continue to bullish side overall move can be done upto 3452-3460 which is last resistance of the market as my analysis this can be plan A.I will update about Plan B in my next analysis.
GOLD: Bottoming Out or Just the Calm Before the Storm? – GOLD: Bottoming Out or Just the Calm Before the Storm?
Gold has dropped nearly $50 over the last 4 sessions, showing clear bearish momentum. But is this just a liquidity grab before a reversal — or are we simply pausing before another leg down?
🔍 Market Context:
Recent US–EU defence and trade agreements may have weakened gold’s short-term appeal as a safe haven.
The US dollar and equities have both gained on strong macroeconomic data, redirecting capital flows away from metals.
Overall market sentiment has tilted risk-on, putting additional pressure on gold prices.
📊 Technical Overview (12H Chart):
Price has broken below the 3342 key support zone and rejected the retest — turning it into short-term resistance.
Current range sits between:
Sell-side liquidity zone: 3301–3292
Major demand/FVG zone: 3272–3270
Above price:
Resistance at 3342, and a broader sell zone at 3370–3388 (OB + FVG + Fib 0.5–0.618)
🔧 Trade Plan (Reaction-Based — Not Predictive):
🟢 Scenario 1 – Buy (Scalp Reaction)
Entry: 3292 – 3290
Stop Loss: 3285
Targets: 3296 → 3300 → 3305 → 3310 → 3315 → 3320 → 3325 → 3330
📍 Intraday bounce play from a high-liquidity zone
🟢 Scenario 2 – Buy (Deeper Reversal Swing)
Entry: 3272 – 3270
Stop Loss: 3265
Targets: 3276 → 3280 → 3284 → 3288 → 3292 → 3294 → 3300 → Trail
📍 Potential mid-term bottom setup if liquidity is fully swept
🔴 Scenario 3 – Sell (Short-Term Rejection)
Entry: 3340 – 3342
Stop Loss: 3346
Targets: 3335 → 3330 → 3325 → 3320 → 3310
📍 Clean rejection setup if price fails to reclaim key resistance
🔴 Scenario 4 – Sell (Higher Supply Zone)
Entry: 3370 – 3372
Stop Loss: 3376
Targets: 3365 → 3360 → 3355 → 3350 → 3345 → 3340 → 3330 → 3320
⚠️ Higher risk; only valid with strong confirmation
⚠️ Risk Notes:
Be mindful of fakeouts around London and NY opens, as liquidity sweeps are common.
Wait for price to enter your zone, then react — don’t anticipate.
Strict risk management is key in a volatile environment like this.
🧭 I’ll continue monitoring how price reacts around these zones.
If this kind of structured planning resonates with your approach,
feel free to stay connected — or share your perspective in the comments.

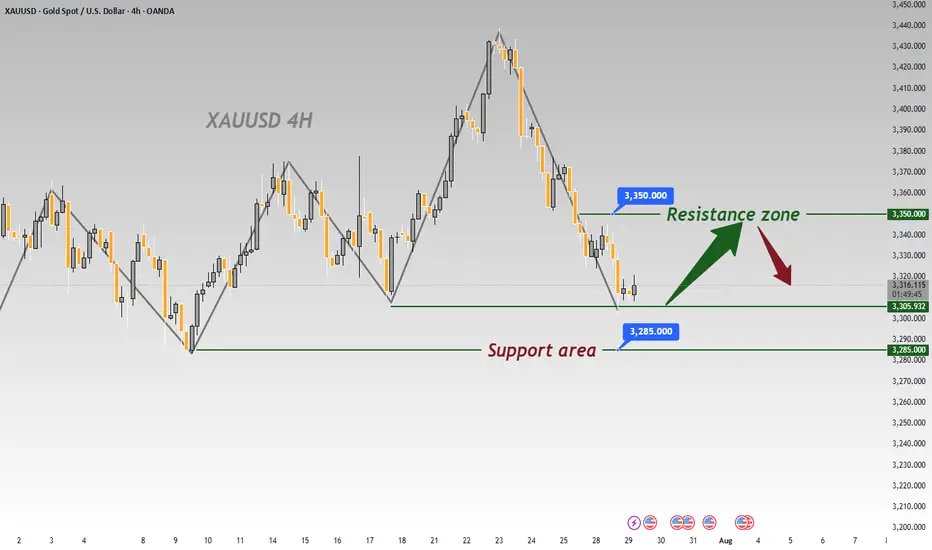
Gold: This Week's Analysis & StrategyThis week, the fluctuations have clearly moderated📉. Focus on a strategy of buying at lows and selling at highs as much as possible📈. Currently, the resistance around 3350 is prominent🚧, and 3300 acts as support below🛡️. If the decline continues, it may reach around 3285👇
We successfully took short positions last week 📉, and this week I recommend going long at lower levels 📈. Over the long term, gold remains in a bull market 🐂, but it will not repeat the frenzy seen in April; instead, it will maintain a steady upward pace ⬆️.
Market expectations for Fed rate cuts have been volatile so far this year 📊. At the start of the year, as Trump-related developments unfolded, market optimism faded 😐. Meanwhile, the de-dollarization trend fueled growing expectations of Fed rate cuts 💹. By early April, Trump’s reciprocal tariff measures—far more aggressive than expected—roiled global financial markets 🌍, triggering a surge in concerns about a U.S. recession ⚠️. Markets thus anticipated that the Fed would cut rates quickly to shore up the economy, with expectations for rate cuts within the year once exceeding 100 basis points 📉. However, shortly after, Trump announced a 90-day extension of the reciprocal tariffs, easing market pessimism 😌 and driving a strong rebound in U.S. stocks 📈. At this point, markets began worrying that his tariff policies could spark an inflation rebound 🔥, leading to a steady decline in rate cut expectations—currently, expectations for rate cuts this year have dropped to fewer than two 🔄.
Risk Warning ⚠️
Event Sensitivity: Outcomes of China-U.S. trade talks 🤝, the Fed’s statements , and nonfarm payroll data 📊 may trigger one-sided volatility. Positions should be adjusted promptly to avoid risks 🛡️
⚡️⚡️⚡️ XAUUSD ⚡️⚡️⚡️
🚀 Buy@ 3300 -3310
🚀 TP 3320 - 3330 - 3340
🚀 Sell@ 3350 -3340
🚀 TP 3330 - 3320 - 3310
Daily updates bring you precise trading signals 📊 When you hit a snag in trading, these signals stand as your trustworthy compass 🧭 Don’t hesitate to take a look—sincerely hoping they’ll be a huge help to you 🌟 👇
XAU/USD at Make-or-Break: $3,304 Holds the Key!"XAU/USD is testing a key resistance at $3,304. A breakout could trigger a rally to $3,315, while rejection may lead to a drop to $3,292."
Price Action & Key Levels
Support: 3,298 → 3,292 (critical demand zone).
Resistance: 3,304 → 3,310 (supply zone).
Breakout Level: 3,304 (confirmation needed).
Indicator-Based Evidence
RSI: "RSI at 62 (not overbought), suggesting room for upside."
MACD: "MACD histogram is rising, supporting bullish momentum."
Moving Averages: *"Price above 9 & 21 EMA, short-term trend bullish."
Fundamental Context
"Gold is supported by Fed rate cut expectations, but a strong USD could limit gains."
"Geopolitical risks (e.g., Middle East tensions) may boost safe-haven demand."
Scenario 1: Bullish Breakout
Entry: Buy above $3,304 (confirmed close).
Target: $3,310 → $3,315.
Stop-Loss: Below $3,298 (risk management).
Scenario 2: Bearish Rejection
Entry: Sell below $3,298.
Target: $3,292 → $3,288.
Stop-Loss: Above $3,306.
Gold Rush Stop?It seems like gold has reached exhaustion according to my analysis, and after checking my previous long term analysis () it confirms where price was suspected to possibly reverse.
Happy trades

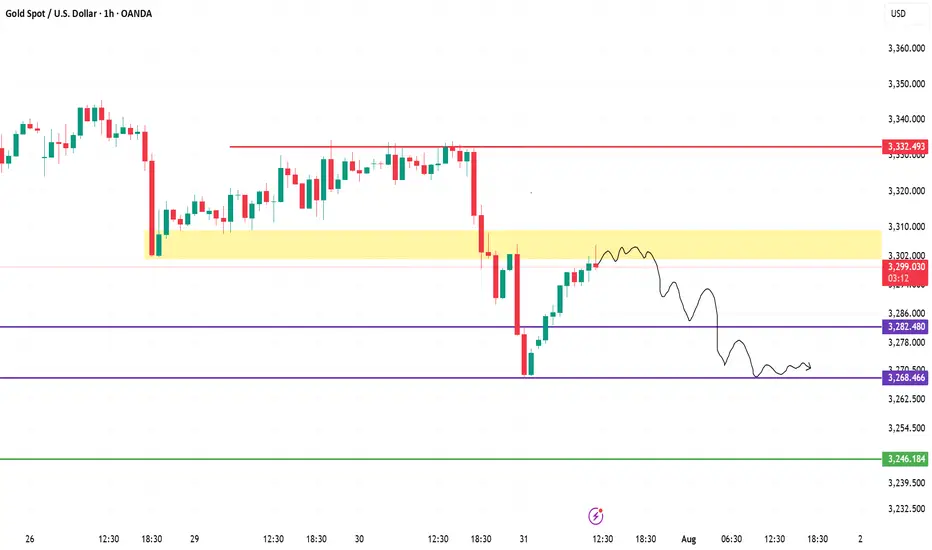
XAUUSD (Gold) Analysis – 1H Chart | July 31, 20251. Fakeout & Rejection from Supply
Price faced sharp rejection near the 3,332 resistance. The strong red candle indicates aggressive selling and liquidity grab.
2. Retest of Broken Demand Zone
Gold is now retesting the **3,298–3,305** yellow zone, which previously acted as demand but may now flip to resistance (supply).
3. Bearish Market Structure
The price formed a **lower high and lower low** pattern — a clear sign of downtrend resumption. Current bounce looks corrective.
4. Projection: Potential Drop Ahead
As per the drawn path, if price fails to reclaim above 3,305, a likely drop toward 3,282, then 3,268 is expected.
5. Key Levels to Watch
Resistance: 3,305 → 3,332
Support: 3,282 → 3,268 → 3,246
Bearish bias remains valid below 3,305.

Gold: ADP, Fed & Key Resistance Gold has been range-bound today—let’s focus on the impact of the ADP data and Fed rate decision ⚠️.
Key resistance lies around 3345-3350 📍: a breakout could fuel further upside 📈, while a rejection may trigger an oscillating pullback 📉
⚡️⚡️⚡️ XAUUSD ⚡️⚡️⚡️
🚀 Buy@ 3325
🚀 TP 3333 - 3339 -3344
Daily updates bring you precise trading signals 📊 When you hit a snag in trading, these signals stand as your trustworthy compass 🧭 Don’t hesitate to take a look—sincerely hoping they’ll be a huge help to you 🌟 👇

Gold (XAU/USD) 4H Timeframe UpdateGold opened the week continuing its bearish move down to the 3303 area. Since then, price has been slowly climbing, showing signs of retracement — but structure remains uncertain.
On the 4H timeframe, we’re currently forming a head and shoulders pattern (now 2/3 complete), and price action is also shaping a bearish flag, suggesting a possible continuation to the downside.
We’re heading into heavy economic news starting tomorrow morning, along with the beginning of earnings season for major assets — all of which could trigger sharp volatility in gold.
Key levels to watch:
• A break above the swing high at 3345 would suggest a bullish continuation.
• A break below the swing low at 3308 would confirm a bearish move.
• The resistance level at 3365 is a key zone to monitor — this is where I expect the right shoulder of the head and shoulders pattern to complete.
Importantly, the 50 SMA is currently traveling in line with this 3365 resistance, adding extra confluence. A break above 3365 would not only take out a strong historical level but also break above the 50 SMA, signaling potential strength to the upside. On the flip side, a rejection from this area would serve as a double rejection — from both resistance and the 50 SMA — reinforcing the bearish case.
For now, it’s a tug of war between buyers and sellers, and with the upcoming data releases, momentum could shift fast.
⚠️ As always, wait for confirmed setups, manage your risk, and only trade with a plan.
Limit risk to 1–2% of your capital per day.

Gold 4H OverviewAs you can see Gold was running in a channel from last so many days which alreadh broke out 28 july 2025 so this is the time for retest of channel and then downtrend continuation.
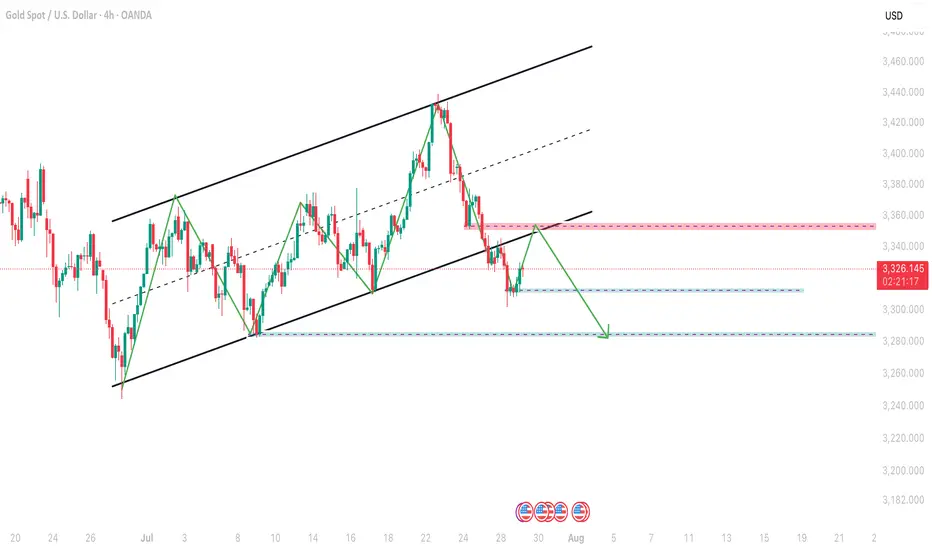
I am going short on gold I am going short on gold chasing down trend for Daily time frame
position opened short 3337 stop 3346 will target 3325 3315

Xausd techinical analysis.Xausd techinical analysis next move posibale at h1 time frame not finchinical advice.

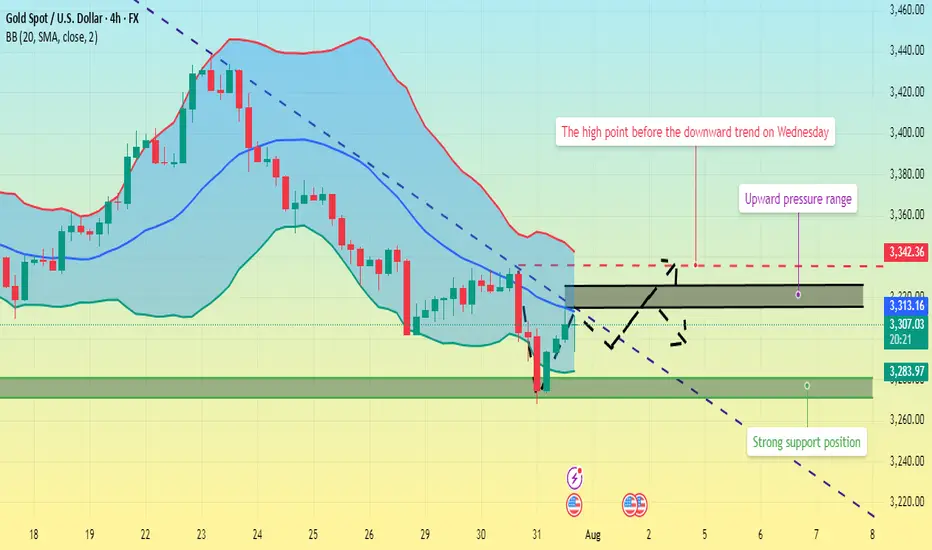
Gold fluctuates. Is the decline halted?Information Summary:
Despite diminished market expectations for a September US rate cut, gold rebounded from a one-month low hit the previous session on Thursday, boosting its safe-haven appeal as newly announced US tariffs sparked new trade uncertainty.
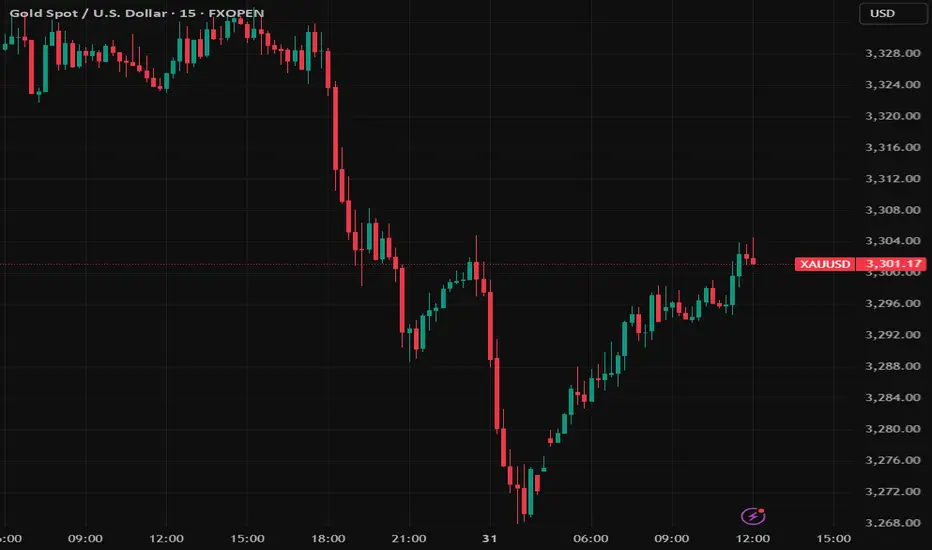
So far, gold has risen 1.15%, hovering around $3,310, a gain of nearly $40 today. On Wednesday, gold prices hit their lowest point since June 30th: $3,267.79.
Market Analysis:
On the 4-hour chart, prices remain below the middle Bollinger Band, with a descending trendline defining the current bearish momentum. Prices rebounded after hitting this month's low on Wednesday. In the short term, watch for price rejection signals near the trendline. Upward pressure currently lies between $3,315 and $3,325, while support lies between $3,280 and $3,270.
Currently, prices are fluctuating upward. Quaid believes the bullish trend may continue. If the current resistance level is broken, it could reach the 3335 high before Wednesday's decline.
Trading strategy:
Go long near 3300, stop loss at 3290, profit range 3320-3330.
gold in retracement gold in retracement and will find a strong resistance to continue its downtrend there after.

XAUUSD SELL OFF CONTINUATION All my trade entry criterias met with the backing of the ADP Non-Farm Employment Change news release being positive for the USD, a SELL trade on GOLD

GOLD REMAINS UNDER PRESSURE AFTER U.S. INFLATION DATA📊 Market Overview:
Gold is trading around $3294, down from $3311 earlier after U.S. Core PCE and Employment Cost Index came in as expected — reinforcing the Fed's hawkish stance. A stronger dollar and rising Treasury yields continue to weigh on gold.
📉 Technical Analysis:
• Key resistance: $3302 – $3305
• Nearest support: $3285 – $3275
• EMA09 (H1): Price is below the 9-period EMA → short-term trend remains bearish
• Candlestick / volume / momentum: After the sharp drop, price is consolidating between $3293–$3298 with low volume. Failure to break above $3302 may trigger further downside. RSI near 45 suggests room for more selling.
📌 Outlook:
Gold may continue to decline in the short term if it fails to reclaim $3302 and the dollar remains strong through the Asian and European sessions.
💡 Suggested Trade Setup:
🔻 SELL XAU/USD: $3296 – $3298
🎯 TP: $3280 / $3275
❌ SL: $3305
🔺 BUY XAU/USD: $3275 – $3278 (if reversal candle appears)
🎯 TP: $3295
❌ SL: $3270

GOLD: Strong Bullish Sentiment! Long!
My dear friends,
Today we will analyse GOLD together☺️
The recent price action suggests a shift in mid-term momentum. A break above the current local range around 3,296.556 will confirm the new direction upwards with the target being the next key level of 3,310.375 and a reconvened placement of a stop-loss beyond the range.
❤️Sending you lots of Love and Hugs❤️

GOLD PLAN – LIQUIDITY HUNT BEFORE THE REAL MOVE? SCALPING PLAN – LIQUIDITY HUNT BEFORE THE REAL MOVE? 🔍
🔹 Timeframe: 30M
🔹 Bias: Intraday Bullish to Bearish Reversal
🔹 Posted by: Clinton Scalper | Smart Money Focus
🔹 Date: July 30, 2025
🔍 MACRO CONTEXT – WHY GOLD REMAINS HIGHLY REACTIVE
The macro backdrop continues to favor volatility in gold:
🟢 Dovish Fed tone ahead of FOMC
– Fed speakers hint at a pause or rate cut timeline.
– Inflation pressures are easing → lowers interest rate expectations.
📉 USD weakening + falling yields
– 10Y U.S. bonds retreating → dollar under pressure → gold gains ground.
🌐 Geopolitical risks remain elevated
– Tensions from Middle East and global recession risks continue to drive flows into safe-haven assets like gold.
🧭 Conclusion: Short-term upside still viable – but be cautious of liquidity traps and OB rejection.
📈 TECHNICAL + SMC INSIGHTS – THE CHART TELLS THE STORY
🔹 Structure Overview:
Market broke out of a descending channel and formed a bullish ascending wedge.
However, price is now approaching multiple OB SELL zones, aligning with smart money exhaustion levels.
🔹 Key Zones:
🔺 OB SELL Zones:
3,334 → 3,342
3,354 → 3,369 (Fibonacci 1.618 extension)
🔻 OB BUY Zones:
3,302 → 3,291 (confluence with previous liquidity sweep)
📍 Current Price: 3,330 – approaching first supply zone.
🔹 Smart Money Flow:
Liquidity above 3,334 has likely been targeted.
If price reaches 3,354–3,369 and shows exhaustion, expect distribution + reversal.
Key confirmation will be a break back below the ascending structure with momentum.
🎯 TRADE PLAN – TWO POSSIBLE SCALPING SCENARIOS
✅ SCENARIO 1: SHORT FROM PREMIUM OB SELL ZONE
Looking to fade bullish liquidity grab near top of range.
Entry: 3,354–3,369
SL: 3,375
TP1: 3,334
TP2: 3,302
TP3: 3,291
Ideal for reversal scalpers catching the distribution move.
✅ SCENARIO 2: LONG FROM DISCOUNT OB BUY ZONE
If price rejects OB SELL and dumps into unfilled demand.
Entry: 3,291–3,302
SL: 3,275
TP1: 3,322
TP2: 3,343
TP3: 3,354
Smart money often reloads after hunting liquidity beneath discount OBs.
⚠️ EXECUTION REMINDERS
✅ Wait for confirmation candles: engulfing / wick rejection / breaker structure
⛔ No market orders without OB reaction
📊 Risk max 1–1.5% per position
📉 Use volume to confirm absorption / exhaustion in OB zones
📢 FINAL THOUGHT – TRAPS COME FIRST, THEN MOVES
Smart Money doesn't chase price — it hunts stops first.
We’re watching closely to see if price completes its liquidity sweep at 3,354–3,369 before a potential reversal. Alternatively, we wait for price to return to the OB BUY zone around 3,291 for a high-RR long play.
🔥 If this helped you:
👍 Like this idea
💬 Comment your thoughts below
🔔 Follow Clinton Scalper for weekly institutional-grade setups

technical analysis- (xau-usd) (H1)This chart highlights a large symmetrical triangle formation, with an internal WXYXZ corrective structure blended with impulsive Elliott Waves (1)-(5). The price action is marked by key structural shifts: CHoCH, BOS, and EOH, signaling trend reversals and liquidity grabs.
📌 Price recently bounced off the ascending trendline, forming a potential wave (2) low, suggesting a bullish move into a wave (3) impulse.
🔼 Short-term target points to a revisit of the strong resistance zone around 3,400–3,410.
📊 Key Setup:
• Pattern: Symmetrical Triangle
• Wave Count: Corrective WXYXZ + impulsive structure in progress
• Signals: Bullish CHoCH + BOS confirmation
🎯 Trade Idea:
• ✅ Direction: BUY
• 🎯 Take Profit (TP): 3,400 – 3,410
• 🔻 Stop Loss (SL): 3,296
🔁 Sideways range compression sets up ideal conditions for short-term swing or breakout scalps.

Key fluctuation range of gold price: 3300-3345Key fluctuation range of gold price: 3300-3345
As shown in Figure 4h
It is expected that the gold price will still fluctuate widely in the range of 3280-3440.
However, the special thing is that the gold price trend has broken through the support of the long-term upward trend, and the triangular oscillation convergence structure has been destroyed.
The important ranges to pay attention to next:
Pressure zone: 3330-3345
Support zone: 3300
Through technical analysis: Obviously, intraday trading is mainly based on high-altitude thinking.
It should be noted that 3300 points is an important watershed between the bull market and the bear market, so there is definitely no shortage of bargain hunting chips.
Be cautious about bottom-fishing.
In the next few days, the trend of gold prices will focus on the fluctuation performance of the 3300-3345 range.
Operation strategy:
Buy: 3300-3310
Stop loss: 3295
Target: 3320-3345
Sell: 3330-3340
Stop loss: 3350
Target: 3300-3280
Buy cautiously at low prices, and try to short at high prices
Gold (XAUUSD) - Liquidity Sweep Setup and Long Bias PlanPrice is currently respecting my projected structure and moving in line with expectations. I'm anticipating a deeper liquidity sweep into the marked demand zones below, where multiple liquidity pools are likely to be taken out. These areas have historically provided strong reactions.
🟦 Key Zones:
Three stacked liquidity sweep levels are highlighted, where previous lows and stop clusters are expected to be swept.
Watch closely for bullish reaction after liquidity grab in these zones.
🟢 Plan:
Looking for potential Entry Long after confirmation from the sweep and market structure shift.
Expecting price to accumulate, fake out with a final sweep (as sketched), and then launch upwards.
If the sweep completes and the structure confirms, targeting a strong bullish continuation move.
📈 Context:
Higher timeframe bullish structure still intact.
Setup aligns with ICT Smart Money Concepts – targeting liquidity and institutional order flow behavior.
💡 This idea will be updated as the setup develops. Trade safe and wait for confirmation.
