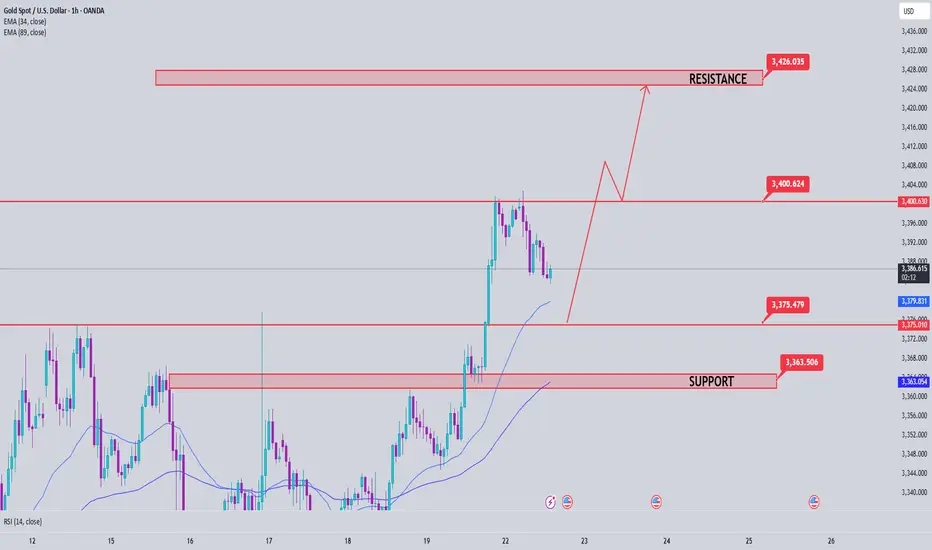
Gold Price Analysis July 22Gold continues to maintain its upward momentum as expected, and yesterday's session reached the target of 3400. This is a signal that the bullish wave structure is still holding. In today's European trading session, the price is likely to make a technical correction to important support zones before continuing the main trend in the US session.
The current trading strategy still prioritizes following the uptrend, focusing on observing price reactions at support zones to find safe entry points. Waiting for buyers to confirm participation is a key factor to avoid FOMO at the wrong time.
🔑 Key Levels
Support: 3375 – 3363
Resistance: 3400 – 3427
✅ Trading Strategy
Buy Trigger #1: Price reacts positively and rejects the support zone at 3375
Buy Trigger #2: Price rebounds strongly from the deeper support zone at 3363
Buy DCA (Moving Average): When price breaks and holds above 3400
🎯 Next Target: 3427
📌 Note: It is necessary to closely monitor price reaction at support zones to determine whether buying power is strong enough. If there is no clear confirmation signal, it is better to stay on the sidelines and observe instead of FOMOing to place orders.
XAUUSDK trade ideas
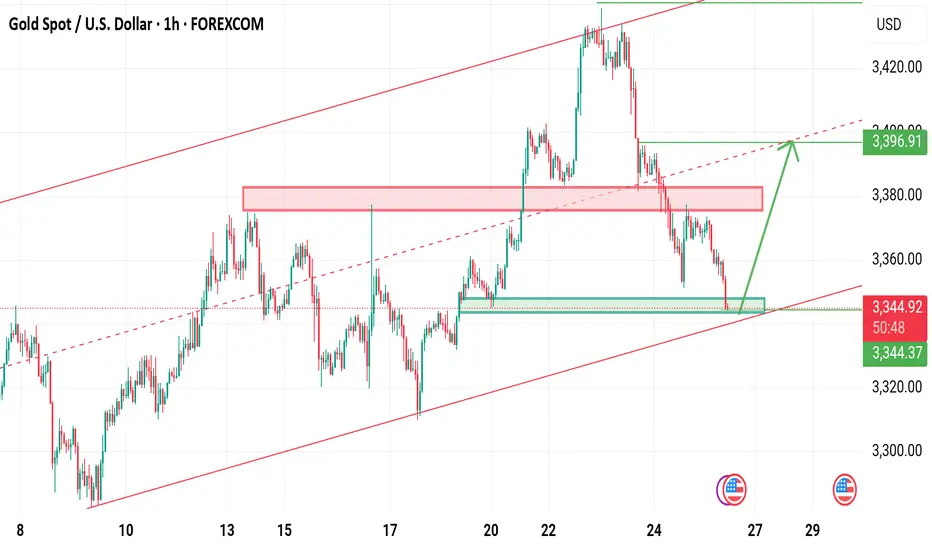
SWING TRADE OPPORTUNITY 〉LONGAs illustrated, I try to visualize what the next bullish impulse could look like if price holds 3300 as a key psychological and algorithmic price level.
Illustrated are the potential buy areas (a current one and an extended one in case a pullback occurs to manipulate lower levels in the next 24-48 hours).
This projection, if valid, could hold from now until next week, so it can be considered a swing trade to hold at least the next week and into the following one).
--
After this post, I will upload another analysis on the Daily timeframe projecting the longer term move, so make sure to go in my profile to check it out.
GOOD LUCK

Gold. Could this be the final "shape" of triangle? 26/July/25XAUUSD. back to previous ideas that we possible having a contracting /symmetrical triangle pattern on gold chart..Probarly a "big surprise" on 31 July FED/FOMC meeting?

Gold Breaking Previous Highs — Bullish Trend ContinuesHello everybody!
Price is continuing its bullish trend and has broken some significant resistance.
According to the market structure, we’re looking for it to go higher, up to the 3430 area.
The break of the downward trendline is a confirmation for a buy position.
Manage your risk and trade safe!
Closing all of my orders in ProfitAs discussed throughout my yesterday's session commentary: "My position: I will continue Buying every dip on Gold as stated many times throughout my recent remarks maintaining #3,377.80 and #3,400.80 benchmark as an Medium-term Targets."
I have closed set of Buying orders engaged within #3,360.80 - #3,363.80 Support belt / some on #3,377.80 Resistance and some above. My #3,400.80 Medium-term Target I mentioned many times throughout my remarks was hit successfully.
Technical analysis: Gold continues to Trade under heavy gains and prior to Fundamental expectations, it is important to monitor independently what the result will be, either Gold closing above #3,400.80 benchmark or vital for Sellers / reversal. Each result - except a very surprising spikes all along however sequence will not be DX friendly. Based on my estimations, I do believe that generally Gold will continue with an aggressive Medium-term Bullish values and so called Risk aversion will disappear. When Risk taking is returning to the markets the DX will gain further against all major currencies. From my personal point of view, the best opportunity is to keep Buying Gold on the Long-run and even if I am usually Gold Bear, I cannot Sell Gold at all costs currently with Gold Bullish non-stop since October #2023 Year. I continue Buying Gold on each dip.

XauusdThe market structure is bearish, but there is a possibility of a price increase to remove liquidity from traders.


Gold Trade SetupI will risk!!!
It seems we are near at the end of correction wave...
The first target R/R is 2 and the second is 4...

XAUUSDHello Traders! 👋
What are your thoughts on GOLD?
Gold has broken above its descending trendline and completed a successful pullback to the breakout level. Now, the price appears ready to resume its upward move, but it's still facing resistance near the $3375 level.
We expect another attempt to break through the $3375 resistance zone.
A confirmed breakout above this area would open the path toward higher targets and potentially trigger strong bullish momentum.
As long as price holds above the broken trendline and key support zone, the overall bias remains bullish.
Don’t forget to like and share your thoughts in the comments! ❤️

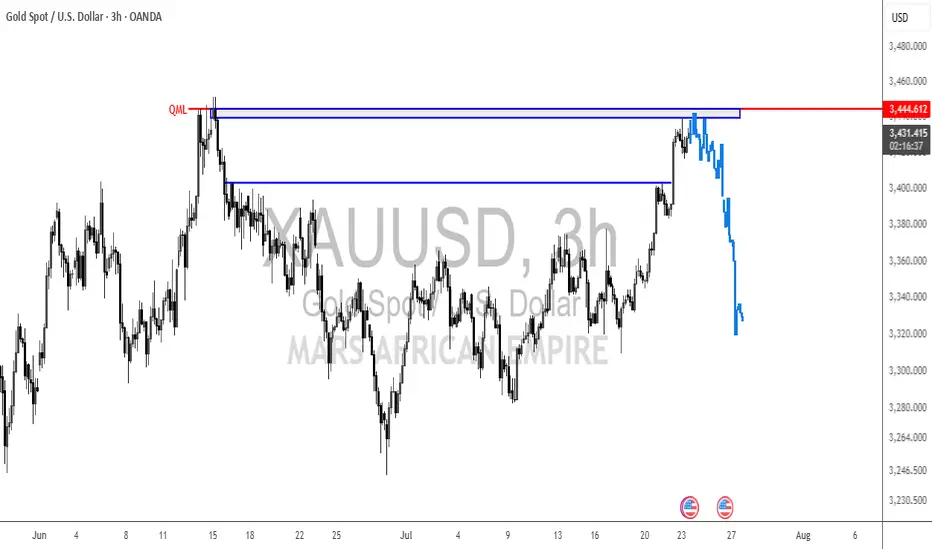
Gold breaks price channel, officially starts falling✏️ OANDA:XAUUSD price has officially broken the bullish wave structure and broken the bullish channel. A corrective downtrend has begun to form. If there is a pull back to the trendline today, it is considered a good opportunity for sell signals.
The liquidity zone 3250 is the target of this corrective downtrend. The 3283 zone also has to wait for confirmation because when the market falls and the momentum of the decline, the number of FOMO sellers will be very strong. The opposite direction is when closing back above 3375, Gold will return to the uptrend.
📉 Key Levels
SELL zone 3343-3345
Target: 3250
BUY trigger: Rejection candle 3285
Buy zone: 3251
Leave your comments on the idea. I am happy to read your views.


XAUUSD Last hope for buyers Gold is currently still holding rising channel last hope for buyers the bottom trendine .
Below 3335 buyers will be liquidate
What's possible scanarios we have?
▪️I'm gonna take buy trade from 3340-3338 area by following our rising Trend along with structural liquidity sweeps strategy, my target will be 3357 then 3368 in extension.
▪️if H4 candle closing below 3335 this Parallel moves will be invalid and don't look for buy till confirmation
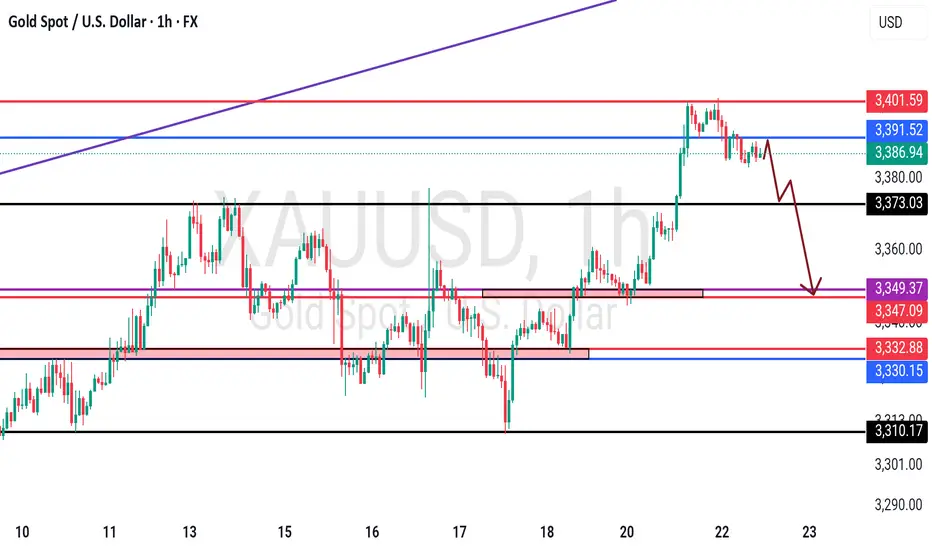
XAUUSD--SHORT--second shoulder of "head and shoulder" pattern is about to form.
--next week, pullback to near to crossection point o two orange line, between levels 3369 and 3355
--then downward movement to the level 3283

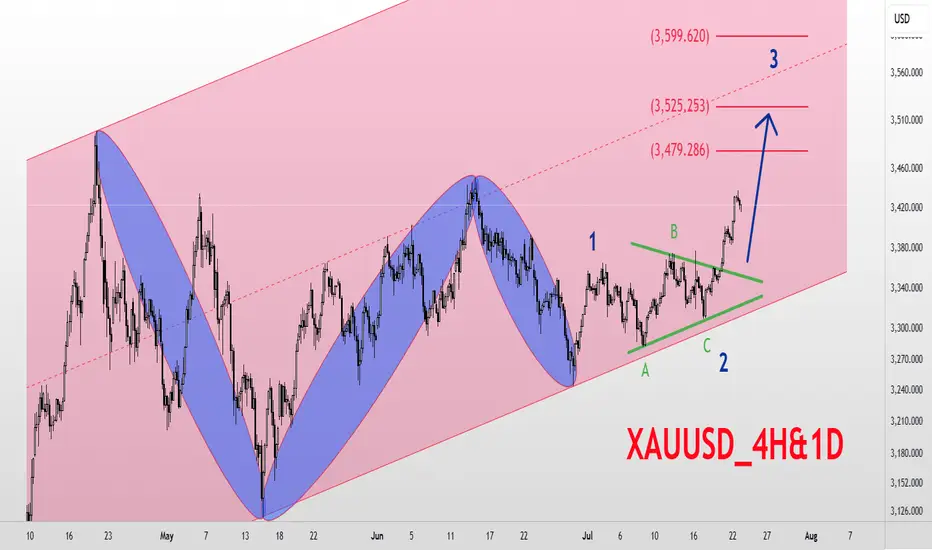
XAUUSD_4H&1D_BuyGold Analysis 4-hour and Daily Medium-term Time Frame Elliott Wave Analysis Style Gold is in a long-term ascending channel Based on Elliott Waves, the market is expected to have entered a new upward trend and has broken waves 1 and 2 and is currently in a large wave 3. The targets for wave 3 are $3480, $3525, and $3600, respectively. Good luck and wish everyone abundance and wealth 💚💚💚
Gold Reload at 3360? Let the Fib Do the Work3360 lines up with key support and the 0.618 Fib—ideal zone for bulls to step back in.
If price holds this level, we may see a continuation toward 3389 and 3400
Plan stays simple: buy the dip, let the trend do the heavy lifting.

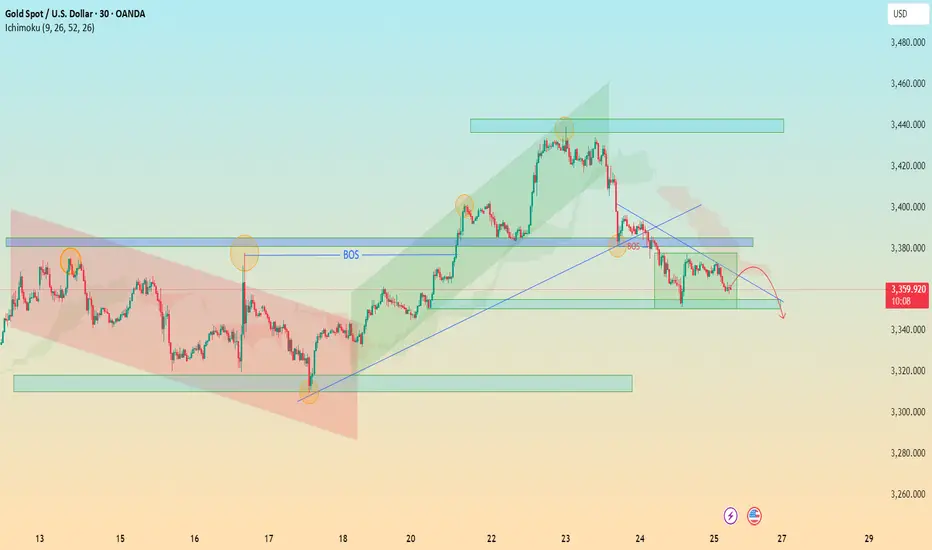
XAU/USD Bearish Retest in Motion – Watch 3340 for Breakout 🔍 XAU/USD (Gold) – Bearish Reversal Outlook
Timeframe: 30-Minute
Date: July 25, 2025
Indicators Used: Ichimoku Cloud, BOS (Break of Structure), Trendlines, Support & Resistance Zones
---
⚙ Technical Breakdown:
1. Previous Market Structure – Accumulation to Expansion:
Descending Channel (Red Box): Market moved within a bearish channel until the breakout occurred.
Key Break of Structure (BOS) around 3365 level signaled the beginning of bullish momentum — a textbook shift from accumulation to expansion phase.
Rally towards 3445 zone: Strong impulsive wave followed by higher highs and higher lows within a green rising channel.
2. Bull Trap and Structural Breakdown:
At the 3445-3460 resistance zone, price failed to maintain momentum and formed a double top / distribution setup.
The second BOS near 3385 confirmed a shift from bullish to bearish market structure.
Ichimoku Cloud also flipped bearish — price is now trading below the cloud, signaling potential continued downside.
3. Current Consolidation and Bearish Retest:
Price is now trapped in a bearish flag / rectangle pattern between 3360 – 3380.
Recent rejections from the descending trendline and overhead supply zone indicate weak bullish attempts and presence of strong selling pressure.
4. Anticipated Move – Bearish Continuation:
The projected red path suggests a retest of the diagonal resistance, followed by a breakdown toward key demand zone at 3340 – 3320.
If that zone fails, we may see a deeper move toward 3280.
---
📌 Key Technical Zones:
Zone Type Price Level (Approx.) Description
Resistance 3445 – 3460 Double Top / Strong Supply
Support 3340 – 3320 Historical Demand Zone
Short-term Resistance 3375 – 3385 BOS Retest + Trendline
---
🎯 Trading Insight:
📉 Bias: Bearish
⚠ Invalidation Level: Break above 3385 with volume
📊 Potential Target: 3340 → 3320
🧠 Trade Idea: Look for short entries on weak retests near descending trendline or cloud rejection.
---
🏆 What Makes This Chart Unique for Editors’ Picks:
✅ Multiple Confluences: Structural shifts (BOS), trendlines, Ichimoku, and classic patterns (channels, flags).
✅ Clear Visual Storytelling: Logical flow from bearish to bullish and back to bearish structure.
✅ Forward Projection: Predictive outlook based on strong technical context — not just reactive analysis.
✅ Educational Value: Useful for beginners and intermediate traders alike to understand structure transitions and key levels.
XAUUSD: Market analysis and strategy for July 24.Gold technical analysis:
Daily chart resistance 3440, support 3310
4-hour chart resistance 3390, support 3340
1-hour chart resistance 3375, support 3360.
Yesterday, according to news, the United States and the European Union were close to reaching a trade agreement, which led to the recent risk aversion sentiment to subside, and the bulls took profits. The gold price has fallen by nearly $80 from its peak.
From the current power comparison, the bears are temporarily dominant. Since yesterday, the candlestick chart of the 4-hour chart has completed 6 candles today (2 of which are sideways and 4 are falling sharply). It is expected that it will not rebound until today's NY market trading session.
Gold may reach 3359 or even 3340. At that time, we will observe the stabilization of the candlestick chart. Once the downward momentum is exhausted and it starts to close higher, we can buy. The upper pressure is 3380/3400.
Buy: 3359near
Buy: 3340near
Sell: 3380near
Sell: 3400near

GOLD - Cut n Reverse Area? What's next??#GOLD... Perfect holdings upside as we discussed in our video and last idea.
Now 3390-91 is major key level because only above that you can see again bounce otherwise not.
NOTE: we will cut n reverse above 3390-91 on confirmation.
Good luck
Trade wisely
Buying GoldBought gold from here. Support is 3,280 based on Timeframe. Targeting the highs of 3,452
Tight stoploss @ 3,298
Put-Call Ratio is bullish.
COT Data on gold for the past 2 weeks continued to be bullish.

GOLD (XAUUSD): Sticking to the Plan
Update for my last Sunday's post for Gold.
Previously, we spotted a cup & handle pattern on a daily time frame.
It turned into an ascending triangle pattern - another bullish formation this week.
I am sticking to the same plan - our strong bullish signal is a breakout
of a neckline of the pattern and a daily candle close above 3378.
It will confirm a strong up movement.
❤️Please, support my work with like, thank you!❤️
I am part of Trade Nation's Influencer program and receive a monthly fee for using their TradingView charts in my analysis.

Gold trend analysis: bullish but not chasing the rise.Gold, last Thursday's daily line closed with a long lower shadow, bottomed out and stabilized, and once again stabilized at the lower track support point of the large convergence triangle. Combined with the cyclical movement after the two stabilizations at 3247 and 3282, it was three consecutive positive rises; therefore, last Friday, and at least these two days on Monday this week, there will be consecutive positive rises; today gold rose as expected, the Asian and European sessions continued to be strong, and there was a second rise in the U.S. session. Since the U.S. session went directly higher before and after, the current support below has moved up to the 3377-75 area, where a top and bottom conversion position will be formed. Therefore, if it falls back to 3375-77 in the evening, you can continue to go long and look to above 3400. If it falls below 3370, it will fluctuate. The upper short-term resistance level is 3387-3393, the previous high. If the market touches here for the first time, you can try to see a double top decline.

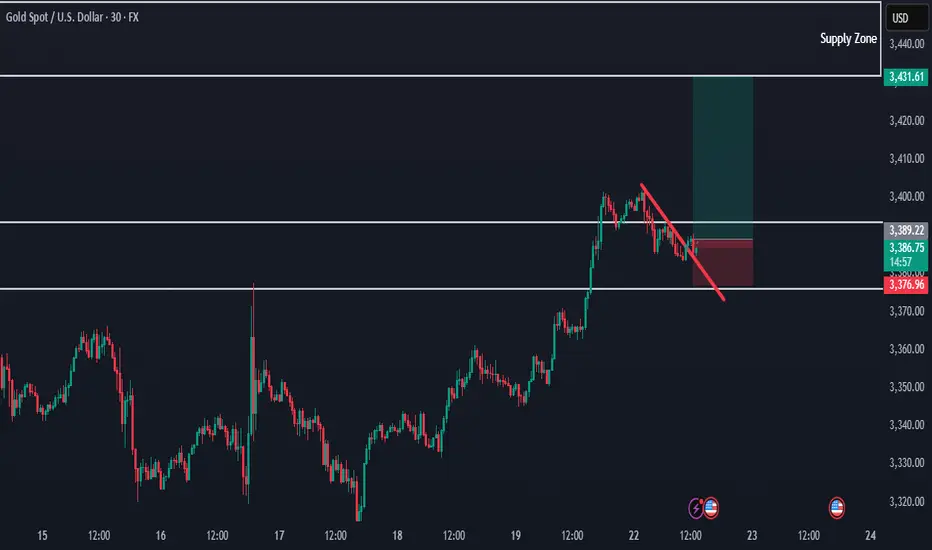
Gold 1H Intra-Day Chart 24.07.2025We saw a perfect rejection from our $3,437 zone and a drop into our first TP of $3,380. What's next?
Option 1: Gold keeps dropping lower into $3,360.
Option 2: Gold buyers hold around $3,380 & push price back up.
Which scenario do you find more likely?
