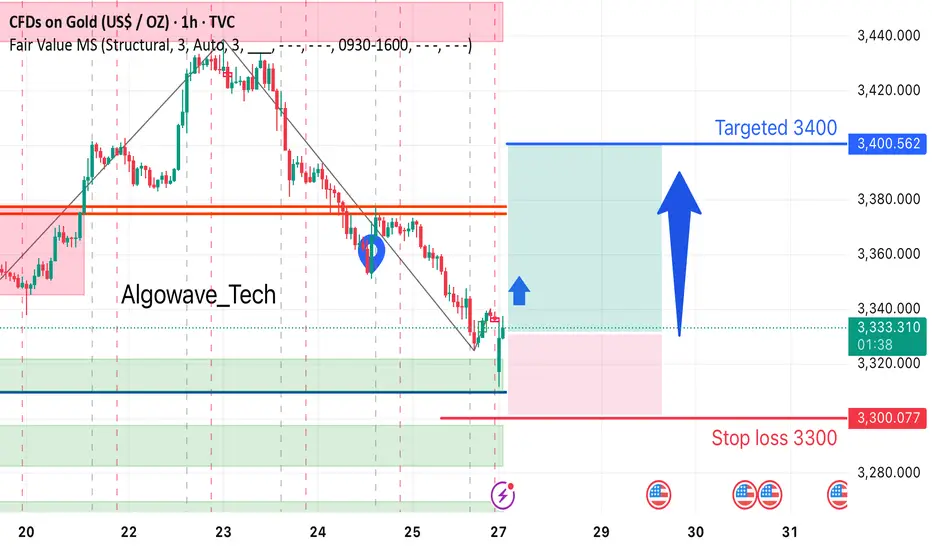
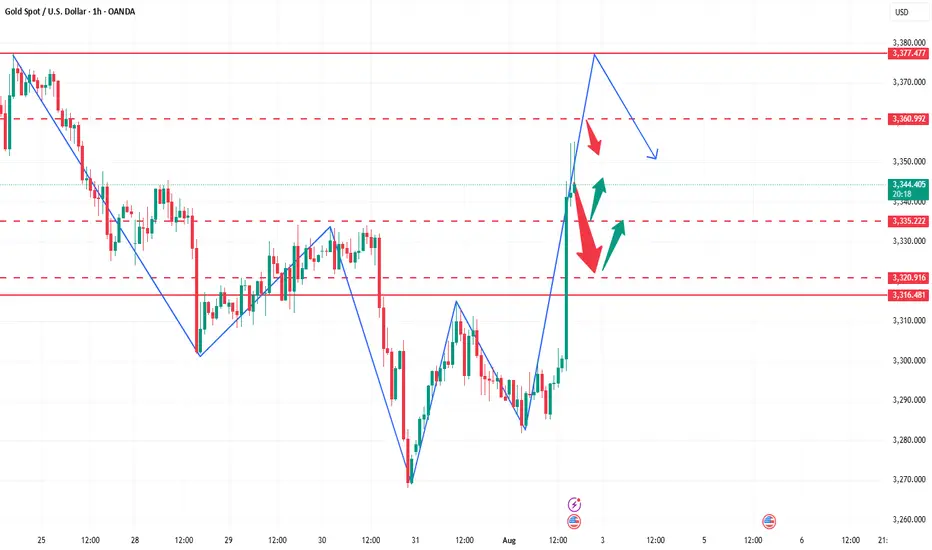
Gold Long Setup Alert!After a clean bounce from a strong demand zone, gold is showing potential for a bullish reversal.
🔹 Entry: Around 3331
🎯 Target: 3400
🛑 Stop Loss: 3300
Price has broken the bearish trendline, indicating possible momentum shift. Eyes on a push towards 3400 if bullish pressure sustains!
#GoldTrading #XAUUSD #AlgoWave_Tech #TechnicalAnalysis #BullishSetup #PriceAction #TradingSignals#Jasonwave_Fx1
XAUUSDK trade ideas
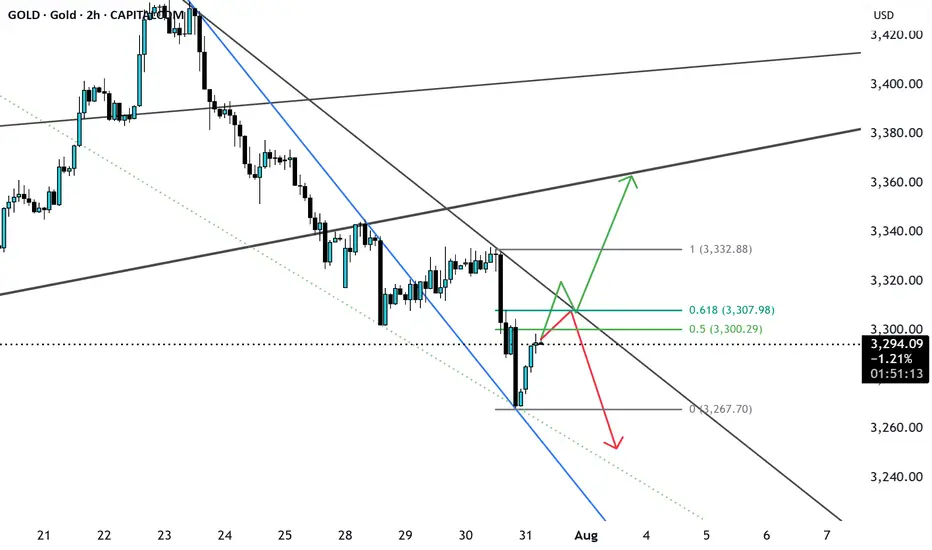
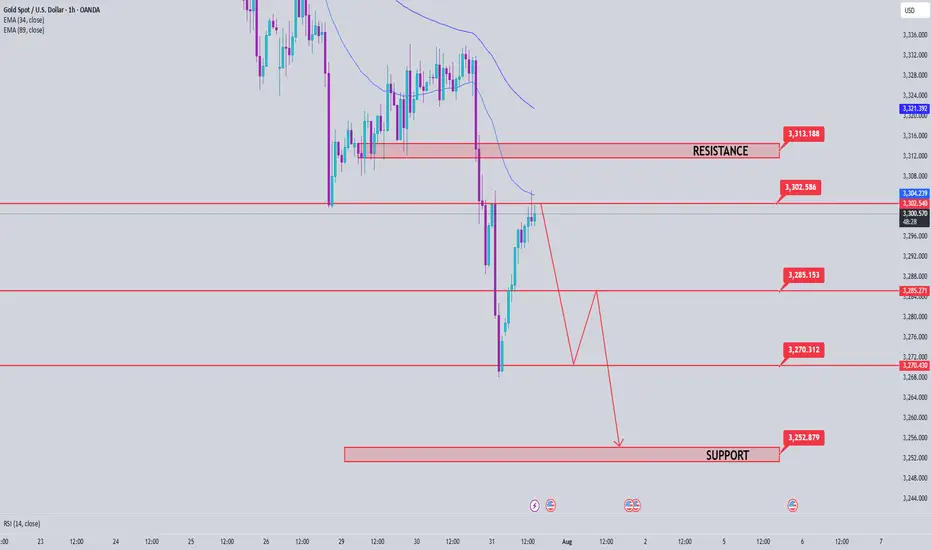
GOLD possible ScenarioCurrently gold has broken a major trendline and currently trading in bearish momentum, currently consolidating or pullback from support and may get rejected from 0.5 or 0.618 if bearish ahs to continue 3240-3250, if breaks the fib level along with trendline resistance can easily price can reach 3340 major resistance level. let us see.
Gold Price Outlook: A Deeper Correction Ahead?Hello everyone! What are your thoughts on the current gold market?
Gold's decline is picking up speed, with the price now testing the 3,320 USD level. A stronger U.S. dollar, coupled with recent developments in the U.S.-EU trade agreement, has significantly reduced demand for gold as a safe-haven asset.
From a technical perspective, the break below the rising price channel is a key signal. It could mark the beginning of a deeper correction, as oscillators are starting to show negative momentum, indicating that the path of least resistance is now downward.
Looking ahead, all eyes will be on Wednesday’s FOMC decision. The market will be watching closely for any signs of a rate cut roadmap from the Federal Reserve, especially during Powell’s press conference. Additionally, several important U.S. macroeconomic data releases this week could provide new momentum for the USD and play a crucial role in shaping gold's next move.
What are your thoughts on where gold is heading? Let us know in the comments below!

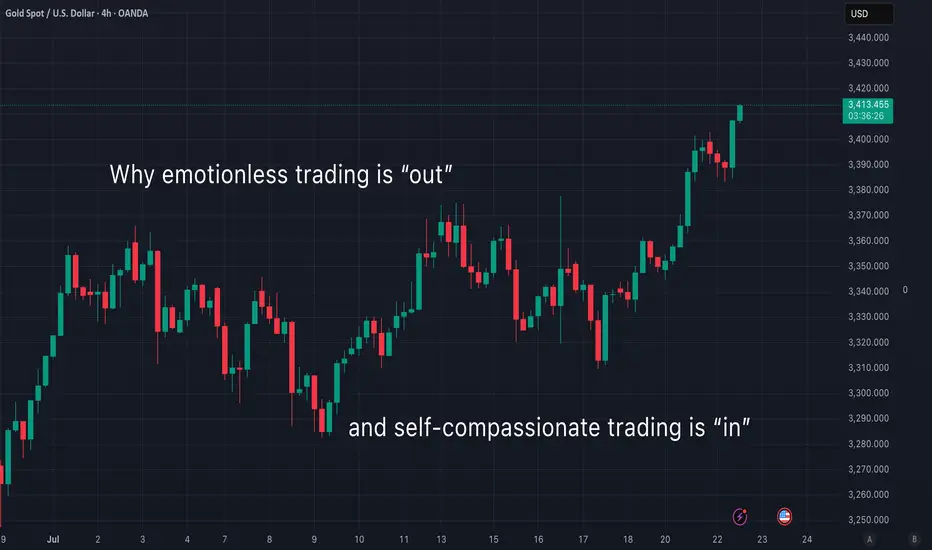
Why emotionless trading is out (and what to do instead)Curious about what self-compassionate trading really means?
Let’s do a little thought experiment together. Imagine you just closed a losing trade. You’re feeling disappointed and unmotivated. You invite two friends over to your home and tell them what happened. Which friend would you rather talk to?
🙋🏽♀️ Friend 1 says:
"What a failure you are. Why were you even stressed out? That’s so silly. Couldn’t you see this trade was going to be a loss? You should just give up—what’s the point of trying? I don’t understand how you could mess up the way you did. Let’s spend the afternoon going through everything you did wrong."
...Or would you prefer:
🙋🏽♀️ Friend 2 who says:
"I can see you’re feeling sad and disappointed about that last trade. I’m really sorry it didn’t go your way. But you know what? Losses are a part of trading—we all go through them. You’ll have another chance tomorrow. I can tell you’re doing your best. Let’s do something kind for ourselves today, and tomorrow you’ll get back to it. Don’t give up—I’m proud of you for chasing your dreams."
🤔 So, who would you choose?
I know this little experiment might sound a bit dramatic—but be honest, wouldn’t we all prefer Friend 2 ? And isn’t Friend 1 sounding suspiciously like that inner critic of yours?
For the longest time, trading advice has told us to "get rid of emotions" and stay completely “stress-free.” I wish it were that simple…
The truth is, trying to trade without emotions is like talking to yourself like Friend 1 . Not only is it impossible —it also builds a harsh, critical inner dialogue that damages both your confidence and motivation.
The reality is: we don’t have full control over our thoughts and emotions. They show up whether we want them to or not. If we could choose our emotional state, we’d all stay calm and focused every time we trade. But that’s not how the human mind works.
Instead of fighting our emotions, we can learn to open up to them—without judgment.
Self-compassionate trading means treating yourself like Friend 2 . It’s about acknowledging when things are tough, and being kind to yourself when stress or anxiety shows up. It’s about replacing harsh self-talk with encouragement, warmth and understanding.
👩🏽🔬 Some people think self-compassion is soft, ”girly”, or even “too emotional.” But guess what? It’s backed by tons of solid research. Studies show that self-compassion helps reduce self-criticism and improve motivation. It’s also an effective tool for managing tough emotions and reducing stress and anxiety.
Self-compassionate trading is a win-win approach—it helps you stay grounded and resilient while building a meaningful trading journey. So why not give it a try? 👇
💡 Pro Tip:
Next time you close a losing trade, find yourself in a losing streak, or just feel anxious about your performance—ask yourself:
“What would I say to a good friend who’s going through the same thing?”
Then offer that same kindness and support to yourself.
Happy (self-compassionate) trading! 💙
/ Tina the Trading Psychologist
GOLD - WAVE 5 BULLISH TO $3,734 (UPDATE)Quick & simple ‘Elliott Wave Theory’ analysis for our Gold ALTERNATIVE SCENARIO.
⭕️Complex 5 Sub-Wave Correction.
⭕️Buyers Remain Above $3,245.
⭕️Pending LQ at $3,500.

How to accurately grasp the gold trading opportunitiesGold was greatly affected by the positive non-farm payroll data, and it rose strongly, with the increase completely covering all the losses this week. The current gold trend has completely reversed the previous bull-short balance. After breaking through the 3300 level and rising to around 3355, it maintains strong upward momentum, and the possibility of further testing the 3360-3375 area cannot be ruled out. Due to the strong positive data, if everyone fails to chase the long position or set a breakout long position in time in the first wave of the market, the subsequent pullback opportunities may be relatively limited, so it is necessary to maintain an active strategy in operation. It is recommended to continue to be bullish when it retreats to the 3335-3320 area, and the upper target is the 3360-3375 pressure range.
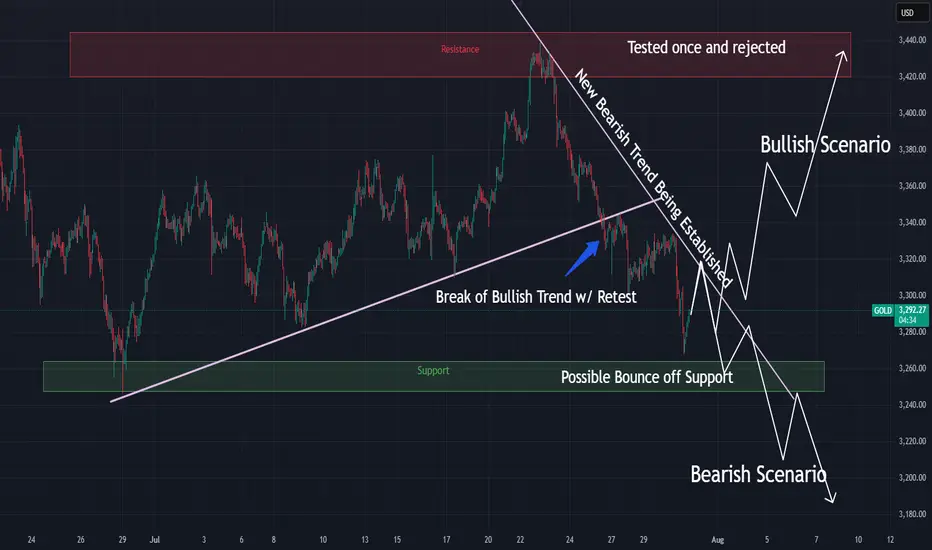
**"Gold Price Rebounding from Support:Potential Move Toward 3436This chart shows the **price movement of Gold (XAU/USD)** on a **daily timeframe**.
### Key Points:
* **Support Zone** : Around **\$3,266**, this is the area where price has bounced up multiple times, meaning buyers step in here.
* **Resistance Line**: Around **\$3,436**, this is the level where price has been rejected before, meaning sellers are strong here.
* **Current Price**: Around **\$3,293**.
### What the Chart Suggests:
* Price is near the **support** zone again.
* If the support holds, the green arrow shows a possible move **upward**.
* Price may first move up slightly, pull back, and then try to **break above resistance** at \$3,436.
Gold is in a sideways range. It's near a strong support level and might go up from here toward the resistance level, as shown by the green line.

Gold Price Analysis July 30Gold (XAUUSD) Consolidating in a Triangle Pattern – Preparing for a Big Breakout
Currently, gold is moving within a triangle consolidation pattern, reflecting the market’s indecision as investors await a series of important economic data from the US this week. This hesitation suggests that a breakout from the triangle pattern could trigger a strong FOMO effect, creating a significant price movement in either direction.
The current price action is similar to a “bull flag” or “pennant” pattern, where a breakout could lead to a clearer and more decisive trend. If the support zone in the pattern fails to hold, the possibility of a sell-off is high.
Trading scenario:
🔻 Activate SELL order:
When price breaks the triangle bottom around 3324
Downside target: 3285, further is the strong support zone at 3250
🔺 Activate BUY order:
When price breaks and holds above the resistance zone 3333
Or: when there is a bearish rejection signal and candle confirmation at the area 3385

Gold short-term bearish
From the Bollinger daily line, as shown in the figure below, the gold price should still test the lower track of $3,280 in the future. The short-term upward trend line has also been broken, and this yellow line has now become a pressure.
From the moving average system, the daily line is chaotic, and the gold price goes up and down without order and rules to cross the moving average, so the daily moving average system has no reference significance. From the weekly line, the gold price has the need to step back on the 20-week moving average of $3,277 to $3,280.
So, if I look at the bearish, I can only see $3,277 to $3,280. No deeper decline can be seen, and no more signals appear. Therefore, shorting is relatively short. Or it is short within the daily Bollinger track, not structural short or trend short. Everything has a law, just oscillation.
So, I think that even if there is a short in the future, it is the end of the short. It is the right way to stop when you see good results. Even though the current gold price has fallen due to the short-term positive tariff negotiations between Trump, Japan and the European Union, the tariff level is still much higher than before, which will undoubtedly bring more uncertainty to future economic growth. Many other factors are not conducive to a sharp drop in gold prices. The overall situation is that the basic trend of gold price increases is intact.
Therefore, the high point of $3345.30 has become the watershed between long and short positions. You can use this as the dividing line for long and short operations. There is nothing wrong with setting a loss above $3345.30 to short in batches. There is nothing wrong with placing a long position at 3346. The market trend is very uncertain, so it all depends on what order you want to make.

XAUUSD position takenI have taken a trade in XAUUSD at 3340 ( Target : 3700, SL : 3296).
Why I have taken this trade ?
It has made an ascending triangle pattern .
It is near its support line.
If you build a fixed range volume profile you will find that
it is at Point Of Control.

XAUUSD Live Trade Last Night (Killed it with 11,641 USD Profits)I managed to ride the momentum last night on XAUUSD and made over 11,641 usd profit on a live trading account. Gold usually create a range. It will create a top and a bottom then it will spend most of its time inside that range. That is pretty much how XAUUSD moves. If you can identify the top and the bottom then you can short it from the top and do a long trade on the bottom. The price will just travel from bottom to top and top to bottom. You can scalp your way to profits on this move if you can time it properly. Once in a while, a break from the top or the bottom happens. This is where you switch from trading the range to trading breakouts.

XAUUSD - 29/7/25 - continued bearish There was quite strong bearish momentum yesterday during the US session. Going into Asian session and London session today there is a consolidation bullish. There is a 4 hour zone marked out where i am looking for a retest and continuation bearish to a key zone below where a reversal pivot is expected and then continuing bullish with the larger trend.

SMC ✅ Strengths:
• Previous mitigation of institutional interest zones (1H FVG).
• BOS (Break of Structure) indicating bullish intent.
• Entry located at the 5M OB, which coincides with support and fake out (consistent with liquidity re-entry).
• TP is aligned with the previous resistance and distribution zone, which provides a good RR (2.23).
Good luck Traders

XAU / USD Weekly ChartHello traders. News was good for the US dollar this morning. Powell did nothing, as expected, and gold is testing the lower boundries of the weekly candle body from last week. So now the question is, do we push down more, or does gold move up to take out all the leveraged shorts that are in profit? I marked the area to watch. Buys and sells with break and close out of the zone. Let's see how the daily and 4 hour candles play out. Shout out to Big G. Be well and trade the trend.

Gold Trade Plan 31/07/2025Dear Traders,
3304-3307 is very important area for Gold,
Pay close attention to the 3303-3307 zone. If you see a rejection in this area, you can enter a sell position.
if Fix above 3305------> 3351
IF Fix below 3305----->3267 (again)
Regards,
Alireza

Continued recovery, positive after NFP news✍️ NOVA hello everyone, Let's comment on gold price next week from 08/04/2025 - 08/8/2025
⭐️GOLDEN INFORMATION:
Gold prices surged over 1.5% on Friday, climbing toward $3,350, as a weaker-than-expected U.S. Nonfarm Payrolls (NFP) report signaled a faster-than-anticipated slowdown in the labor market. Heightened geopolitical tensions between the U.S. and Russia further boosted safe-haven demand for the precious metal.
Following the disappointing July jobs data, markets began pricing in a potential interest rate cut by the Federal Reserve. While the Unemployment Rate held relatively steady, signs of labor market softness supported recent comments from Fed officials Michelle Bowman and Christopher Waller, who advocated for a 25-basis-point rate cut at the July 29–30 meeting.
Additional data added to the cautious sentiment: the ISM’s July report confirmed that U.S. manufacturing activity remains in contraction territory, while consumer confidence took a hit, according to the University of Michigan’s latest survey.
⭐️Personal comments NOVA:
Gold prices continue to be positively affected after last week's NFP news, market expectations of an early rate cut are rising
🔥 Technically:
Based on the resistance and support areas of the gold price according to the H4 frame, NOVA identifies the important key areas as follows:
Resistance: $3384, $3434
Support: $3331, $3307, $3268
🔥 NOTE:
Note: Nova wishes traders to manage their capital well
- take the number of lots that match your capital
- Takeprofit equal to 4-6% of capital account
- Stoplose equal to 2-3% of capital account
- The winner is the one who sticks with the market the longest

Gold price analysis July 31XAUUSD – Bearish pressure still prevails, watch for SELL in the direction of the trend
Yesterday's session witnessed a strong decline when the D1 candle closed with selling pressure up to 60 prices, forming a key candle that shapes the trend. When the market forms a main candle, the 25% and 50% candle body areas are often important price areas to continue trading in the direction of the main trend.
In the current context, the priority strategy will be to sell in the direction of the downtrend when the price rebounds to the resistance areas and there is a rejection signal.
🔹 Important resistance areas:
3301 – 3312 – 3333
🔸 Target support areas:
3285 – 3270 – 3250
🎯 Trading strategy:
Prioritize SELLing at the resistance area of 3301–3312 when there is a price reaction (rejection).
Target: 3250
BUY only considered when 3313 area is broken decisively.
Staying disciplined and sticking to the reaction price zone will be key in the context of the market moving in a clear trend.
GOLDGOLD looks like it will be giving us correction or impulse up early part of this week. Reaction will be above 3360.
Disclosure: We are part of Trade Nation's Influencer program and receive a monthly fee for using their TradingView charts in our analysis.
GOLD Local Short! Sell!
Hello,Traders!
GOLD made a retest
Of the horizontal resistance
Of 3313$ and we are already
Seeing a bearish reaction and
We will be expecting a further
Bearish move down
Sell!
Comment and subscribe to help us grow!
Check out other forecasts below too!
Disclosure: I am part of Trade Nation's Influencer program and receive a monthly fee for using their TradingView charts in my analysis.

Gold Spot / U.S. Dollar Analysis (15-Minute Chart)Key Levels
Support Levels:
Immediate: 3,294.000 (S/L level)
Next: 3,280.000
Resistance Levels:
Immediate: 3,304.000 (Entry level)
Next: 3,308.000, 3,316.250, 3,320.000
Profit Targets:
Tiered levels up to 3,328.000 (highest target).
Price Action & Trends
Current Trend:
The price is bullish (+0.84% today) but hovering near the entry level (3,299.000) and testing 3,302.700.
The presence of multiple profit targets above suggests a bullish bias in the trade setup.
Critical Observations:
Price recently dipped to 3,294.000 (S/L) but rebounded, indicating buying interest at support.
The 3,304.000 level (entry) now acts as resistance. A breakout above could target 3,308.000+.
Volume & Momentum:
Not visible in the screenshot, but the upward movement suggests moderate bullish momentum.
Trade Setup Analysis
Entry: 3,299.000
Stop-Loss: 3,294.000 (5 USD below entry)
Profit Targets:
3,304.000 (Breakeven+)
3,308.000 → 3,328.000 (Scalping opportunities).
Risk-Reward Ratio:
If targeting 3,328.000, the RR is ~5:1 (29 USD profit vs. 5 USD risk).
Actionable Insights
Bullish Scenario:
Hold if price sustains above 3,304.000 (entry resistance).
Next target: 3,308.000.
Bearish Caution:
If price falls below 3,294.000 (S/L), exit to limit losses.
Watch for rejection at 3,304.000 (potential reversal).
Market Context:
Gold is sensitive to USD strength and geopolitical events. Monitor broader trends for confirmation.

Beyond the Chart – GOLD Market Technical Analysis🧠 OANDA:XAUUSD Market Outlook: Gold (XAU/USD)
✅ Bullish Case (Upside Bias)
• Price has reclaimed multiple Fair Value Gaps (FVGs) on the way up.
• Holding above the 0.382 Fib level (3293) indicates moderate bullish momentum.
• A confirmed breakout above 3301 (0.5 Fib) may open the path to key resistance levels:
• 3308 (0.618 Fib)
• 3314 (0.705 Fib)
• 3319 (0.786 Fib)
📌 This move is likely a retracement rally within a broader downtrend — unless price reclaims above 0.786 with strength, confirming a shift in structure.
⸻
🛠️ Trading Plan
• Bullish Setup: Long above 3301, targeting 3308 → 3314, with tight stops.
• Bearish Setup: Look for rejection patterns at 3308–3314 zone, targeting a move back to the 3280 area.
⸻
📘 Disclaimer: This is educational content and not financial advice. Always do your own analysis and manage your risk accordingly
Gold Bounces From Support — Reversal Starting?Gold just wicked into support and is showing early signs of a reversal.
📌 Stoch RSI curling up from oversold
📌 Price bounced clean from the demand zone
⏱️ Timeframe: 1H
#gold #xauusd #tradingstrategy #quanttradingpro #stochrsi #tradingview #supportresistance
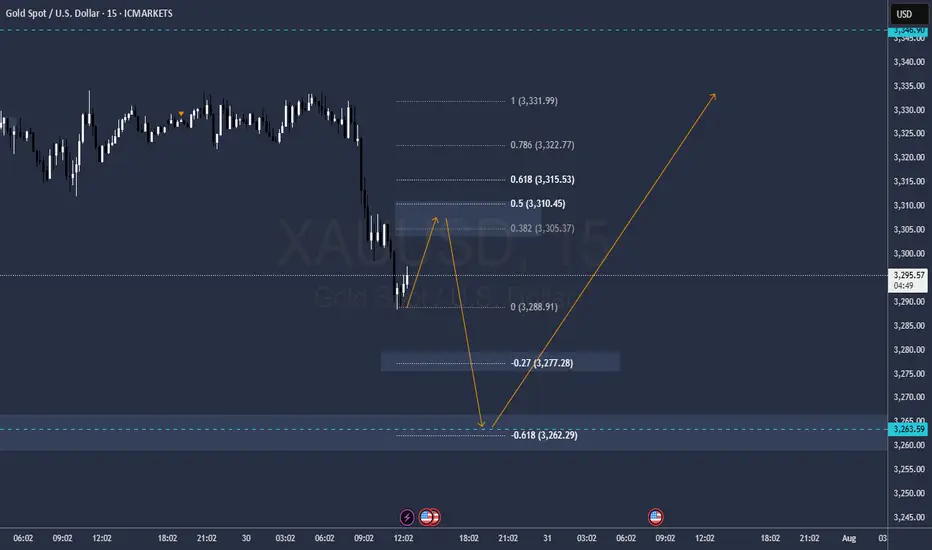
GOLD FOMC Ok it will be rising this previous FOMC 90 minutes but then will fall fasta and sharp
Sell levels 3305 / 3310 SL above .618
Targets 3277 3263
Reversal spectation on 3263 towars all time highs 3550 and 3650