XAUUSD: Bullish Now, But Trouble Ahead?Last Friday, buying momentum lifted gold prices, with potential for a further move toward the 3400 level, provided bullish momentum continues.
This move followed a weaker-than-expected Non-Farm Payroll (NFP) report, an uptick in the unemployment rate, and no change in the Fed's interest rate, all of which pressured the U.S. Dollar Index (DXY) lower and supported gold’s rise.
Interestingly, while price advanced, institutional traders reduced their long exposure by nearly 30,000 contracts, indicating some caution or profit-taking at current levels.
I remain bullish in the short term due to macro tailwinds, but bearish in the medium to long term as institutional positioning softens and resistance zones approach.
XAUUSDK trade ideas

XAUUSD: UptrendOn XAUUSD as you can see on the chart we would have a good uptrend. After the vwap indicator breaks, you can double your buy position.

Xausd techinical analysis.Xausd techinical analysis next move posibale at h2 time frame not finchinal advice.

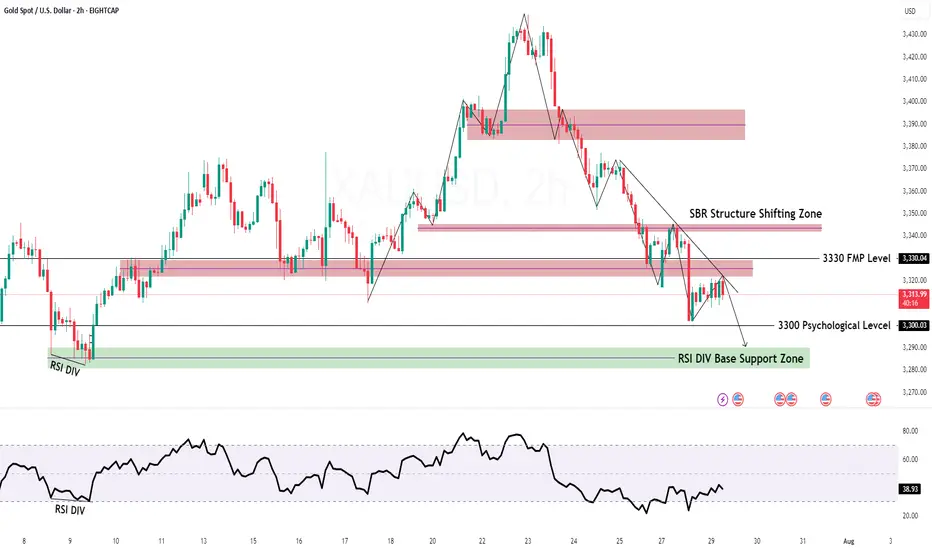
GOLD H2 Intraday Chart Update For 29 July 2025Hello Traders, Welcome to new day
we have US JOLTS high impact news today, for market sustains above 3300 psychological level
if market successfully break 3280 level then it will move towards 3280 or even 3270
if market crosses 3330 level successfully then it will move towards 3345 or even 3360
All eyes on FOMC & NFP news for the week
Disclaimer: Forex is Risky
Gold short opportunityGold completed its mini bull flag target and re-entered a micro rising channel, a potentially bearish structure.
With price now testing a key supply zone, we’re watching for rejection to initiate a short, targeting the major demand zone below.

BUY GOLD i am so humble to publish this idea on GOLD i recmmend individuals to set buy limit orders with repsect to the stoplevels including take profits and stoploss ..
after. a very longdown fall of the gold , from he butifully set up hat we had last week , price now retraces to he demand zone with fully potential for buyers to tk over the control ...
i have refined this move with fully aces of technical view , ICT and SMC
Godluck and use proper risk management , Gold is highly volatile and its not recommended for young crying babies hence use proper risk management tips

Gold Breakout Failed – Bearish Reversal in Play?Last week was both interesting and revealing for Gold.
After breaking above the key $3375 resistance—which also marked the upper boundary of a large triangle—price quickly accelerated higher, reaching the $3440 resistance zone.
However, instead of a bullish continuation, we witnessed a false breakout and sharp reversal. What initially looked like a healthy pullback turned into a full bearish rejection by week’s end.
________________________________________
📉 Current Technical Picture:
• On the daily chart, we now see a clear Three Black Crows formation
• On the weekly chart, a strong bearish Pin Bar confirms rejection
• And if we add the failed breakout above 3375, the bias tilts decisively bearish
________________________________________
📌 Key Zones and Trading Plan:
• Gold is currently bouncing from the ascending trendline zone, which is natural after dropping more than 1,000 pips in just 3 days
• The $3375–3380 area has regained importance as a key resistance zone, and that’s where I’ll be looking to sell rallies
• A bullish invalidation would only come if price manages to stabilize above $3400
Until then, this remains a bear-dominated market, and a drop below $3300 is on the table.
________________________________________
🧭 Support levels to watch:
• First support: $3280
• Major support: $3250 zone
________________________________________
📉 Conclusion:
The failed breakout, bearish candle formations, and current price structure all point to a market that's shifting in favor of sellers.
I’m looking to sell spikes into resistance, with a clear invalidation above $3400.
Disclosure: I am part of TradeNation's Influencer program and receive a monthly fee for using their TradingView charts in my analyses and educational articles.

XAUUSD Selling Expecting Movement Buy Zone Activated after rejection from resistance
First Target 3310.50
Final Target 3275.50
The bullish breakout scenario remains valid as long as price holds above the lower channel boundary. A clean break and retest of the current structure could provide further confirmation for long entries.
Key Notes
Watch for volatility near marked U.S. data events
Maintain tight risk management and monitor for rejection candles near target zones

Only by understanding the trend can you be firmly bullish.The market is changing rapidly, and going with the flow is the best way to go. When the trend comes, just go for it. Don't buy at the bottom against the trend, so as not to suffer. Remember not to act on impulse when trading. The market is good at dealing with all kinds of dissatisfaction, so you must not hold on to orders. I believe many people have experienced this. The more you resist, the more panic you will feel, and the floating losses will continue to magnify. You will not be able to eat or sleep well, and you will miss many opportunities in vain. If you also have these troubles, then you might as well follow Tian Haoyang's rhythm and try to see if it can make you suddenly enlightened. If you need help, I will always be here, but if you don't even extend your hand, how can I help you?
Gold rose unilaterally after the positive non-farm payrolls on Friday, hitting a new high this week. This week's K-line closed in a hammer shape, and the gold hourly line has a double bottom structure. However, gold should not have such a big retracement for the time being. The 3335-3330 line below is also an important support. So gold will mainly be bought on dips above 3335-3330 next week. Technically, there is still room for growth next week. The bulls continued to attack at the end of Friday and closed at 3363. Next week, we will continue to pay attention to the short-term suppression at the 3370-3375 line above. In terms of operations, we will continue to maintain retracement and buy. If your current operation is not ideal, I hope I can help you avoid detours in your investment. Welcome to communicate and exchange. Judging from the current gold trend, the short-term resistance above next week will be around 3370-3375, with a focus on the important pressure line of 3395-3400. Keep buying on pullbacks, and try to maintain a stable wait-and-see position in the middle. I will prompt the specific operation strategy at the bottom, so please pay attention in time.
Gold operation strategy: Go long on gold when it retraces to around 3340-3330, target 3370-3375, and continue to hold if it breaks through.

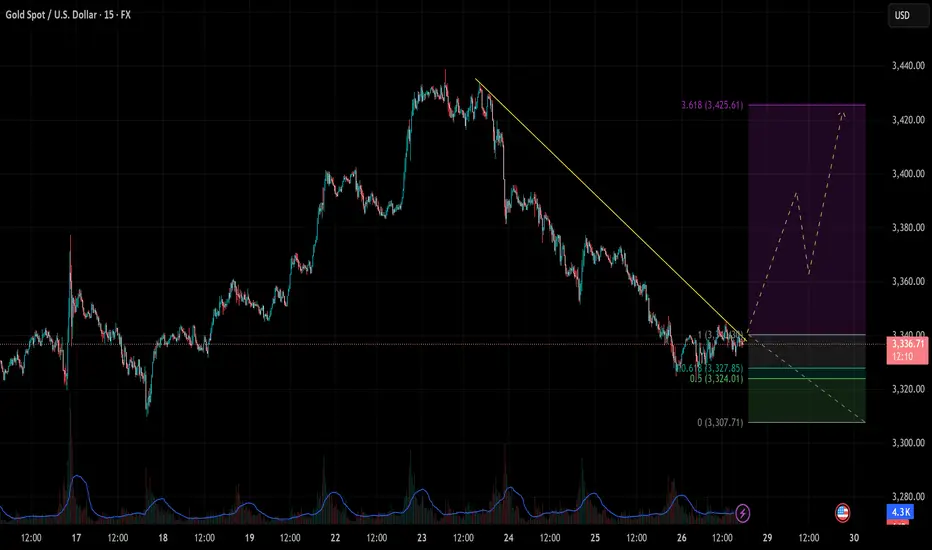
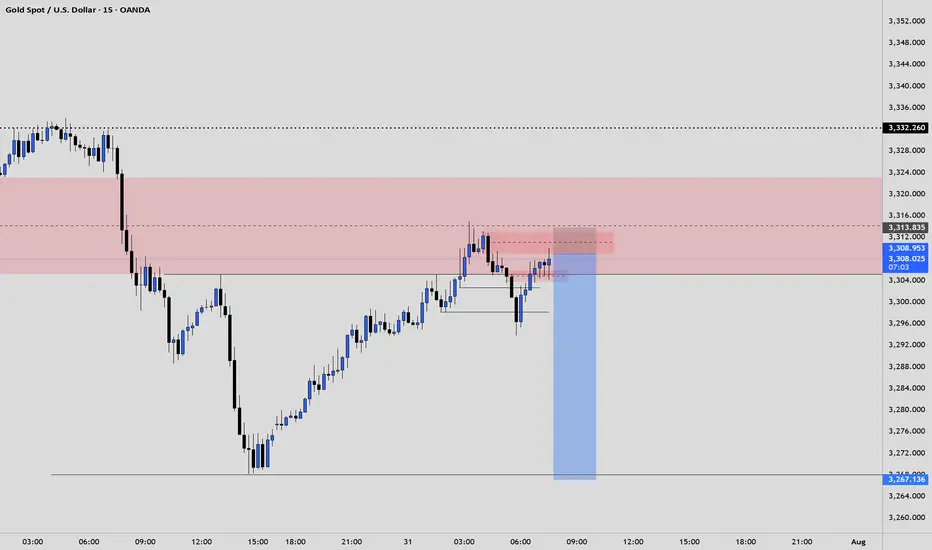
[XAUUSD] Reversal Signals from Key Support As of the July 28–29 trading sessions, the XAUUSD 15-minute chart is showing early signs of a bullish reversal, with price reacting strongly at a key Fibonacci support zone and breaking through a descending trendline.
1. Price Action and Technical Structure
After a prolonged downtrend from the 3,430 zone, gold found support at the 0.618 Fibonacci retracement (3,327.85), aligning closely with the horizontal support at 3,324 – 3,327.
A descending trendline has been breached, signaling a potential breakout setup.
A potential ZigZag corrective wave structure is forming, hinting at the beginning of a new bullish swing.
2. Fibonacci Extension & Upside Targets
The Fibonacci extension tool suggests a possible rally toward the 3.618 extension at 3,425.
This level marks the next major upside target if the breakout holds.
3. Key Price Levels
Price Zone
Technical Significance: 3,327 – 3,324 Major support zone (Fib 0.618 + horizontal support)
3,350 – 3,355 First reaction zone / interim resistance
3,380 – 3,400 Strong resistance zone
3,425 Final target – 3.618 Fib extension
4. Suggested Trading Strategy
Long Setup – Breakout & Reversal Confirmation
Entry: 3,328 – 3,332 (after bullish confirmation above trendline and support)
Stop Loss: Below 3,320 (beneath local swing low)
Take Profit: 3,355 → 3,380 → 3,425 (scaling out by zone)
Bearish Continuation Scenario
If price drops below 3,320 and breaks 3,307 support, the bullish outlook is invalidated, and a retest of deeper levels is likely.
5. Volume and Confirmation Cues
Volume has started to pick up as price tests the breakout zone – indicating that buying pressure may be returning.
Wait for a strong bullish candle with volume above average before committing to the trade.
Gold is approaching a critical inflection point, and bulls may regain control from this confluence support zone. Stay alert for a breakout confirmation. Save this idea if you find it helpful and follow for more high-probability strategies!
Gold Price Update – Bearish Flag Signals Possible Drop AheadGold is currently trading around $3,324, showing consolidation after a recent decline from the $3,345 region. The chart shows a bearish flag pattern forming after the sharp drop, indicating potential continuation of the downtrend. If gold fails to break above this region, sellers may push the price lower towards $3,301 and possibly $3,275.
The descending trend line adds further bearish pressure, limiting upside momentum unless gold decisively breaks and holds above $3,345. Overall, gold remains under short-term bearish sentiment, with the focus on support retests. Any bullish momentum will only be confirmed if the price closes above the flag and trendline resistance.
Key Points
Resistance Zones: $3,328 (0.618 Fib), $3,345 (flag top).
Support Zones: $3,301 (Fib base), $3,284, and $3,275 (bearish extension).
Trend Outlook: Short-term bearish unless price breaks above $3,345 with volume.
Bearish Targets: $3,301 → $3,284 → $3,275.
Bullish Invalidations: Break and close above $3,345 may shift bias to bullish.
Note
Please risk management in trading is a Key so use your money accordingly. If you like the idea then please like and boost. Thank you and Good Luck!

XAU/USD | Watching for Potential Drop Toward $3391! (READ)By analyzing the gold chart on the 4-hour timeframe, we can see that gold continued its bullish move after holding above $3409, successfully hitting the $3440 target and delivering over 200 pips in returns! After reaching this key supply zone, gold corrected down to $3415 and is now trading around $3421. If the price stabilizes below $3431, we can expect further downside movement, with the next bearish targets at $3415, $3404, and $3391. If this scenario fails, an alternative setup will be shared.
Please support me with your likes and comments to motivate me to share more analysis with you and share your opinion about the possible trend of this chart with me !
Best Regards , Arman Shaban

Gold continue to rise rapidly?Hello everyone! Let’s dive into what’s been happening with XAUUSD lately.
Last week, gold delivered a stunning reversal - plunging sharply and then surging nearly 800 pips within just a few sessions. This rapid shift was largely triggered by key remarks from the Federal Reserve Chair and several important economic data releases.
Specifically, weaker-than-expected US employment data has fueled growing expectations that the Fed could begin easing monetary policy sooner than anticipated. At the same time, a global financial survey shows that analyst sentiment toward gold is at its highest in months. In the face of persistent global uncertainty, gold is once again attracting strong safe-haven demand.
Despite the impressive rally, volatility remains high. The next moves in gold will likely hinge on upcoming economic indicators and further statements from Fed officials. Meanwhile, the holiday calendar may lead to quieter trading sessions ahead.
From a technical perspective, gold has broken out of its previous downtrend channel and is moving quickly. According to Dow Theory, a short-term correction may occur, but as long as price holds above key support levels, the bullish momentum could extend toward $3,416 — the 1.618 Fibonacci extension.
This breakout could mark the beginning of a new bullish phase after weeks of consolidation.
What do you think – is this just the start of something bigger for gold?

GOLD NEXT MOVE (expecting a mild bullish(24-07-2025)Go through the analysis carefully and do trade accordingly.
Anup 'BIAS for the day (24-07-2025)
Current price- 3357
"if Price stays above 3345, then next target is 3370, 3320 and 3400 and below that 3330 and 3310 ".
-POSSIBILITY-1
Wait (as geopolitical situation are worsening )
-POSSIBILITY-2
Wait (as geopolitical situation are worsening)
Best of luck
Never risk more than 1% of principal to follow any position.
Support us by liking and sharing the post.

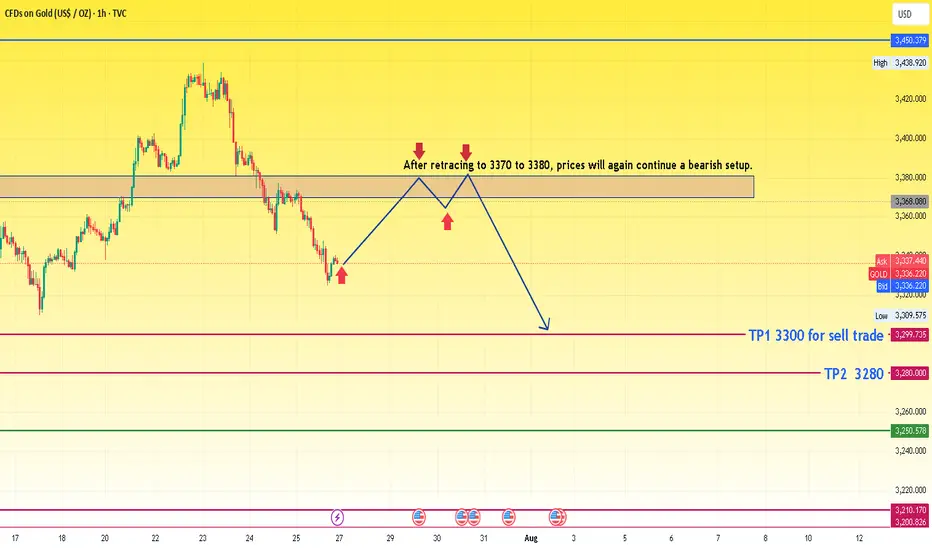
XAUUSD idea for upcoming weekThe chart presents a bearish outlook for gold based on a retracement and continuation pattern. Here's a detailed analysis:
🔍 Chart Summary:
Current Price: Around 3336
Bias: Bearish (after retracement)
Resistance Zone: 3370 – 3380
Sell Confirmation Area: Upon rejection from the 3370–3380 resistance zone
Target 1 (TP1): 3300
Target 2 (TP2): 3280
📈 Technical Structure:
Recent Trend:
The price has dropped sharply from its recent peak.
Now it's attempting a pullback to previous support, which has turned into a resistance zone (3370–3380).
Price Action Expectation:
A retracement is expected toward 3370–3380.
If the price gets rejected from this resistance block, the chart suggests the formation of a lower high.
After rejection, a bearish continuation is expected.
Projected Move:
Short entry around the resistance zone.
Targets:
TP1: 3300 (intermediate support)
TP2: 3280 (major support)
🧠 Trade Idea Logic:
The chart follows a classic bearish price action setup: impulse → retracement → continuation.
The consolidation and break area has flipped from support to resistance.
The retracement zone is clearly defined, making it a high-probability area for reversal if bearish signals (e.g., rejection candles) form.
⚠️ Key Considerations:
Wait for confirmation: Do not enter blindly at 3370–3380. Look for rejection patterns (like a bearish engulfing or pin bar).
Volume and fundamentals: Watch for economic data or geopolitical news that might invalidate the technical setup.
SL Suggestion: Above 3385 or 3390 to allow some room for wick spikes.
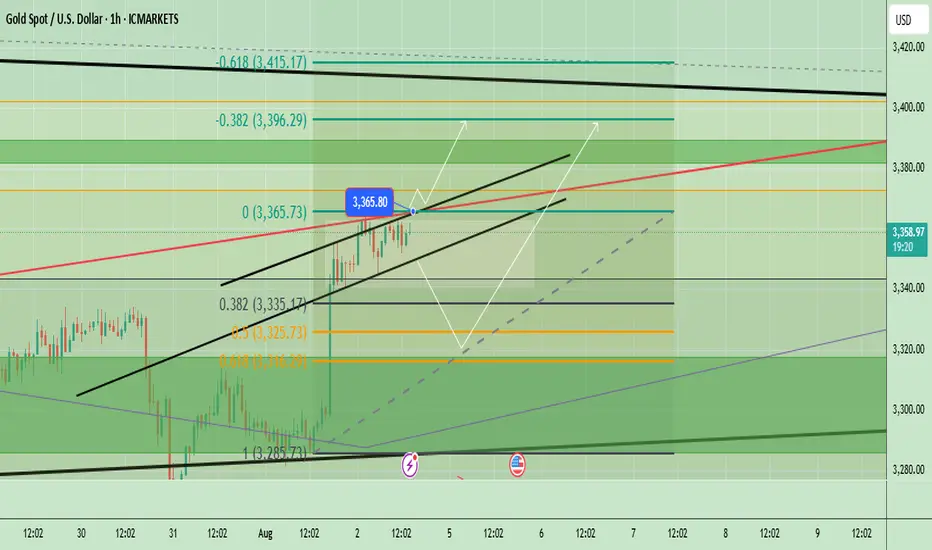
Gold Technical Analysis - Testing Key ResistanceGold has been showing a short-term bullish momentum after bouncing from the 3285 support zone, forming an ascending channel visible on the chart. The price is currently trading near 3361, close to the upper boundary of the channel and a key horizontal resistance level at 3365–3370. If the bullish momentum continues and price breaks above 3365–3370, we could see further upside toward 3396 and potentially 3400+. However, a failure to hold above this level could trigger a short-term retracement toward 3335–3325 support.
📈 Potential Scenarios:
- Bullish: If price sustains above $3,365, we could see an upside push toward $3,396 and possibly higher to $3,410 resistance.
- Bearish: A rejection near the channel top or $3,365 may lead to a pullback toward $3,325 (Fib 0.5) and then $3,285 support.
🔑 Key levels to watch:
- Upside: $3,365 → $3,396 → $3,410
- Downside: $3,335 → $3,325 → $3,285
- Trend Bias: Short-term bullish as long as price stays above 3325
Note
Please risk management in trading is a Key so use your money accordingly. If you like the idea then please like and boost. Thank you and Good Luck!
Weekly Trend Radar1. Macro Market Overview
Last week, the Federal Reserve kept interest rates unchanged, as widely expected. The decision was fully priced in, and the press conference offered no surprises: future rate cuts will depend on incoming economic data.
Markets initially reacted with a decline, but I do not see a structural break in the uptrend for commodities. It looks more like a healthy cooldown before the next leg higher .
However, the equity market is showing signs of deeper weakness . Historically, August tends to be a challenging month for stocks, and what we may be witnessing now is not a short-term correction but the early stages of a major downtrend.
Cryptocurrencies followed equities lower due to their high-beta, risk-on nature, but similar to metals, I believe the correction is temporary and the broader uptrend remains intact.
In energy markets, oil remains volatile — no clear setup for a long position yet. Natural gas has reached support and may offer a cautious long opportunity, though the medium-term trend is still bearish.
Overall, global markets are holding key levels, except for equities, which now look the weakest.
2. Metals
Buy the Dip!
🥇Gold
Gold ended the week slightly higher — a strong performance considering the broader market weakness. Its resilience highlights its role as a safe-haven asset. The bullish trend remains intact, and institutional support appears to be holding.
Trend: Bullish
Key Levels: Support at 3245, resistance at 3450
Position: Looking for a long entry next week
🥈Silver
A more volatile asset compared to gold, silver has pulled back but remains within its bullish trend. Friday’s daily candle showed promise, bouncing from the 50-day moving average. Despite not closing above Thursday’s high, the setup is constructive.
Trend: Bullish
Key Levels: Support at 36.30, resistance at 38.00
Position: Long, stop below Friday’s low at 36.30. New entries still valid.
⚪️Platinum
Similar structure to silver. Friday’s reversal candle signals potential continuation of the bullish move.
Trend: Bullish
Key Levels: Support at 1280, resistance at 1480
Position: Long, with stop below Friday’s low. Valid setup for new positions.
🔘Palladium
Strong technical picture even without a test of the 50-day MA. Remember — these MAs are not entry signals, but trend indicators. Entry is based on confluence, not location alone. And it would be nice to finally see parity with platinum.
Trend: Bullish
Key Levels: Support at 1185, resistance at 1260, 1310, 1340, 1370
Position: Planning to enter long at Monday’s open if the market is supportive. No entry if risk-off sentiment dominates.
🟠Copper
Copper is one of the most compelling setups this week. After a sharp 25% decline, it remains in an overall uptrend. Friday’s bullish candle on the daily chart is promising. A potential new rally may start from here.
Trend: Bullish
Key Levels: Support at 4.35, resistance at 5.15
Position: Planning to enter at Monday’s open, stop below Friday’s low.
3. Energy Markets
🛢️Crude Oil
I'm leaning toward a long setup, but Friday’s red candle on the daily chart signals the need for caution. Waiting for a clear reversal candle before entry.
Trend: Bullish
Key Levels: Support at 68.30, resistance at 72.68, 75.00, 77.70
Position: Waiting for lower volatility and confirmation from daily chart structure.
🔥Natural Gas
The asset has reached a strong support zone. Daily candles are starting to form a potential bottoming pattern, but we need to break through resistance at 3.20 to gain confidence.
Trend: Bearish (medium-term)
Key Levels: Support at 3.00, resistance at 3.20, 3.35, 3.65
Position: Cautious long, small size. Stop-loss is wide, so risk management is key.
4. S&P 500
📉I believe we are entering a major downtrend in the stock market. This is not just a correction — it's likely the beginning of a more sustained decline. I’m shifting my bias to short.
Trend: Bearish
Key Levels: Support at 6150; resistance at 6430
Position: Waiting for short opportunity.
5. Bitcoin
₿Bitcoin followed the equity market lower. The trend is still technically bullish, but the recent risk-off tone in equities warrants caution. Crypto is not a defensive asset and tends to experience sharper drawdowns.
That said, I do not expect another prolonged "crypto winter." Institutional involvement has improved market depth and liquidity, reducing the severity of future crashes — though volatility will remain elevated.
Trend: Bullish
Key Levels: Support at 112.000; resistance at 117.000, 121.000, 123.300
Position: Long, stop below Friday’s low. Act with caution.

Gold Crashes $100 After Hitting Monthly High | What’s Next?In this video, I break down everything that moved the price of gold last week, from the early-week rally toward $3,430 to the sharp midweek drop toward $3,325. We go beyond the surface, diving into what caused the reversal, and how I'm approaching next week’s market using a simple ascending channel on the 4-hour chart.
With major events like the FOMC rate decision, U.S. GDP, PCE inflation, NFP and the August 1 tariff deadline all on the radar, this analysis will help you stay grounded and prepare for volatility.
👉 If you find this content valuable, don’t forget to Boost, Comment, and Subscribe for weekly market breakdowns.
Disclaimer:
Based on experience and what I see on the charts, this is my take. It’s not financial advice—always do your research and consult a licensed advisor before trading.
#goldanalysis, #goldforecast, #xauusd, #goldpriceprediction, #technicalanalysis, #fundamentalanalysis, #tradingstrategy, #forextrader, #priceaction, #fomc, #usgdp, #pceinflation, #goldtrading, #forexeducation, #dollarvsgold, #tariffnews, #chartanalysis, #forexmentorship, #rebuildingthetraderwithin

Golden View 20250729How should we view the current market conditions?
High-level shock, large triangle convergence and breakout, has been confirmed
Bearish expectations
Next, you can try to adopt a short strategy.
The question is, where to enter the short position?

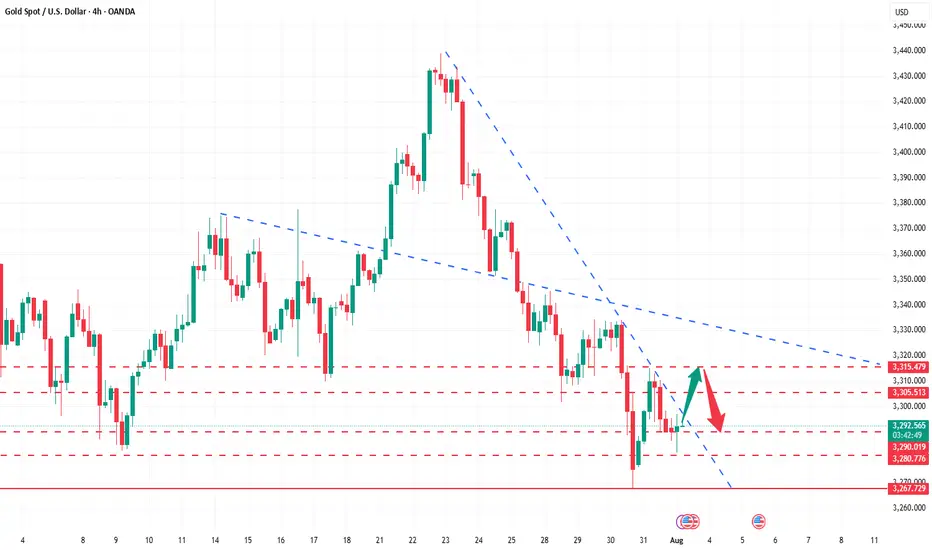
How to correctly grasp the gold trading opportunities?Yesterday, gold prices saw a technical rally amidst volatile trading, followed by a downward trend under pressure. Bulls strongly supported a rebound at 3280 in the Asian session. The European session saw an accelerated upward move, breaking through 3314 before retreating under pressure. We also precisely positioned short positions below 3315, achieving a perfect target of 3290-3295. During the US session, the market again faced pressure at 3311, weakening in a volatile trend before breaking through 3300. The daily chart ultimately closed with a medium-sized bullish candlestick pattern, followed by a pullback and then a decline.
Overall, after yesterday's rebound, gold prices remain under pressure at the key resistance level of 3314. The short-term bearish weakness line has moved down to this level. If pressure continues in this area in the short term, gold will maintain a weak and volatile structure, with intraday trading remaining focused on rebounds and upward moves. If you are currently experiencing confusion or unsatisfactory trading strategies, please feel free to discuss your options and help avoid investment pitfalls.
From a 4-hour analysis perspective, focus on resistance at 3305-3315 on the upside. A rebound to this level is a good opportunity to short against resistance. Focus on support at 3280-3270 on the downside. Unless the price stabilizes strongly, consider not entering long positions below this level. The overall strategy remains to short on rebounds, with the same rhythm. I will provide timely notifications of specific levels from the bottom, so keep an eye on them.
Gold Trading Strategy: Short on rebounds near 3305-3315, with targets at 3290-3280-3270.
XAUUSD ShortElite analysis - NEWS TRADE
Executed of a 3m OB
Targeting lower LPs
Price is reacting at New Event of this OB.
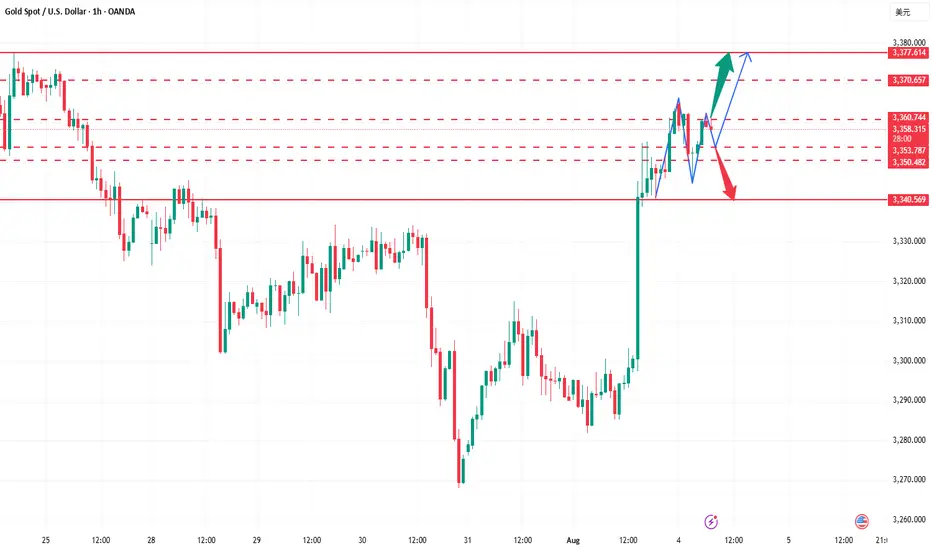
As the bull market continues, is gold poised to hit new highs?Judging from the current gold trend, the technical side opened high and closed low, releasing the demand for short-term adjustments. The intraday low hit 3344 and then rebounded, which is enough to reflect the resilience of the bulls. The hourly doji continued to rise, and the 3353 line was pulled up again. It is expected that it will be difficult to give an entry opportunity near 3340-3345 again. Since the new high has been refreshed again, the technical short-term adjustment may have ended. With the current strong bull structure, further testing the 3370-3380 area is a high probability event. If it unexpectedly falls below 3340 in the future, the bulls will no longer defend strongly, and the market may turn to volatility. Breaking below 3340 is also expected to open up short-term short space, but this is a later story. The current market structure is clear, and we continue to see a strong upward trend for the bulls. At least at the beginning of the week, I do not think the bull market is nearing its end.
Gold operation suggestion: go long around 3360-3355, target 3370-3380.Strictly set stop loss and control your position.
XAUUSD bullish reversal from a demand zoneThe setup also aligns with a liquidity sweep below previous lows, which could trigger a reversal. Price is now breaking minor resistance levels, creating early confirmation for bullish momentum.
