Summary of gold market this week and analysis of next week's mar
Gold closed with an inverted hammer candlestick with a relatively long upper lead this week. Technically, the market is still bearish next week, and the pressure from above is still relatively large. After reaching the highest point of 3438.7 this week, it started a unilateral decline mode, which caught the bulls off guard perfectly. This week, I also emphasized that the 3400 line is not a high point. Gold rose strongly at the beginning of this week, and the market had high expectations for bulls. In the second half of the week, gold fell unilaterally, hitting the bulls hard. This week, it closed at 3336.7, which is another distance from 3400. Next week, we will continue to give the operation ideas of rebound shorting according to the technical analysis. Following the trend is the way to invest. If your current operations are not ideal, I hope I can help you avoid detours in your investment. You are welcome to communicate with me!
From the 4-hour analysis chart, we focus on the short-term suppression of 3370-75 on the top, and focus on the suppression of 3397-3400 on the top. After all, gold fell and broke through here this week, and then fell southward. We focus on the support of 3312-18 on the bottom. On Friday midnight, we gave a long position at 3318-25. Gold rebounded at 3324.9 at midnight. In operation, gold will still be treated as rebound short next week. I will remind you of the specific operation strategy during the trading session, so please pay attention to it in time.
Gold operation strategy:
Short gold rebounds at 3370-75, stop loss at 3387, target 3327-3330, and continue to hold if it breaks;
XAUUSDK trade ideas

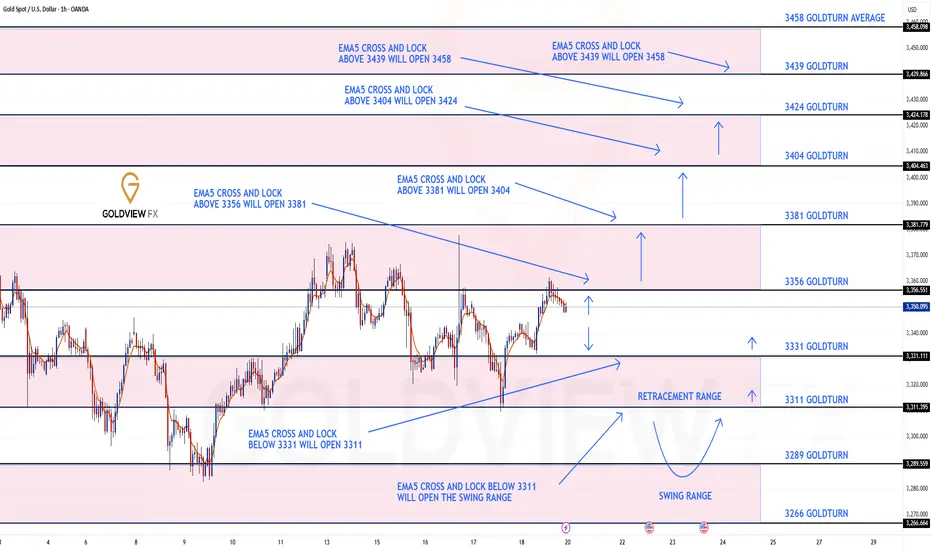
GOLD 1H CHART ROUTE MAP UPDATE & TRADING PLAN FOR THE WEEKHey Everyone,
Please see our updated 1h chart levels and targets for the coming week.
We are seeing price play between two weighted levels with a gap above at 3356 and a gap below at 3331. We will need to see ema5 cross and lock on either weighted level to determine the next range.
We will see levels tested side by side until one of the weighted levels break and lock to confirm direction for the next range.
We will keep the above in mind when taking buys from dips. Our updated levels and weighted levels will allow us to track the movement down and then catch bounces up.
We will continue to buy dips using our support levels taking 20 to 40 pips. As stated before each of our level structures give 20 to 40 pip bounces, which is enough for a nice entry and exit. If you back test the levels we shared every week for the past 24 months, you can see how effectively they were used to trade with or against short/mid term swings and trends.
The swing range give bigger bounces then our weighted levels that's the difference between weighted levels and swing ranges.
BULLISH TARGET
3356
EMA5 CROSS AND LOCK ABOVE 3356 WILL OPEN THE FOLLOWING BULLISH TARGETS
3381
EMA5 CROSS AND LOCK ABOVE 3381 WILL OPEN THE FOLLOWING BULLISH TARGET
3404
EMA5 CROSS AND LOCK ABOVE 3404 WILL OPEN THE FOLLOWING BULLISH TARGET
3424
EMA5 CROSS AND LOCK ABOVE 3424 WILL OPEN THE FOLLOWING BULLISH TARGET
3458
BEARISH TARGETS
3331
EMA5 CROSS AND LOCK BELOW 3331 WILL OPEN THE FOLLOWING BEARISH TARGET
3311
EMA5 CROSS AND LOCK BELOW 3311 WILL OPEN THE SWING RANGE
3289
3266
As always, we will keep you all updated with regular updates throughout the week and how we manage the active ideas and setups. Thank you all for your likes, comments and follows, we really appreciate it!
Mr Gold
GoldViewFX
XAUUSD Smart Money Technical Analysis – Bullish Potential XAUUSD Smart Money Technical Analysis – Bullish Potential from Strong Support
Gold (XAUUSD) is currently trading around $3,291.780, showing a potential bullish reversal setup from the strong support zone after a clear liquidity sweep and market structure shifts.
🔍 Key Technical Highlights:
✅ Strong Support Zone (Demand)
Price is reacting from a major demand zone (Strong Low) between $3,275 – $3,225, a level that previously triggered bullish rallies.
Multiple Breaks of Structure (BOS) and CHoCH indicate previous bullish control and a possible re-accumulation phase.
✅ CHoCH Near Support
A recent Change of Character (CHoCH) around the support area shows the first signs of smart money accumulation.
Liquidity below recent lows has been swept, triggering possible bullish intent.
✅ Bullish FVG (Fair Value Gap)
A clear Bullish FVG remains unmitigated around the mid-range, offering target confluence at $3,349.560.
Price may aim to rebalance inefficiency and fill the FVG as part of the bullish move.
✅ Resistance Zone Above
The resistance area near $3,325 – $3,350 acts as a short-term target for long positions.
Further resistance lies at the Buy-Side Liquidity & Weak High zone around $3,450 if momentum sustains.
🧠 Smart Money Concept Interpretation:
Liquidity Grab: Price dipped into strong demand to collect sell-side liquidity before potential reversal.
CHoCH + BOS Alignment: Indicates the market may now transition into a bullish phase.
FVG as Magnet: Price is drawn toward unfilled value zones—ideal for bullish target projection.
🎯 Trade Idea (Educational Purposes Only):
Bias: Bullish
Entry: Around current zone ($3,290)
Target: $3,349.560 (FVG zone)
Invalidation/SL: Below strong low (~$3,225)

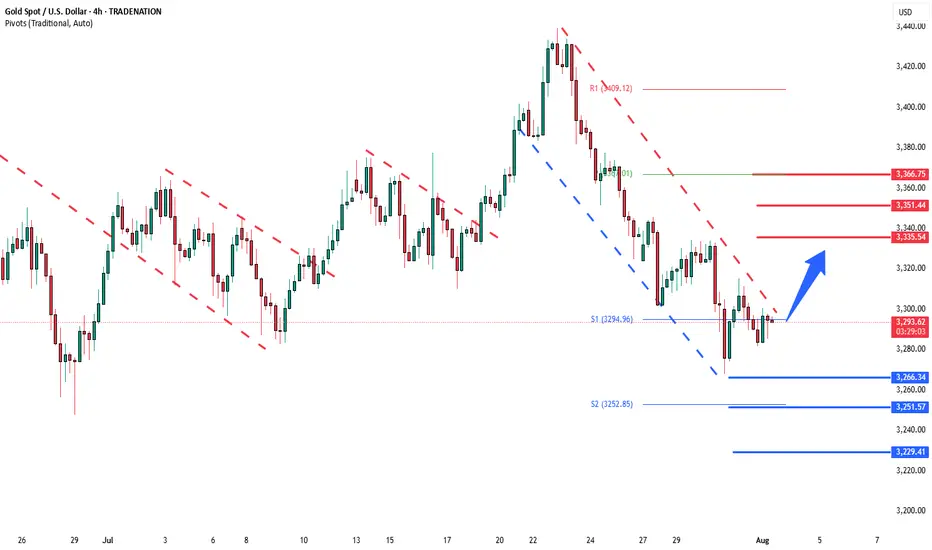
Gold deeper consolidation supported at 3266The Gold remains in a bullish trend, with recent price action showing signs of a continuation breakout within the broader uptrend.
Support Zone: 3266 – a key level from previous consolidation. Price is currently testing or approaching this level.
A bullish rebound from 3266 would confirm ongoing upside momentum, with potential targets at:
3335 – initial resistance
3351 – psychological and structural level
3366 – extended resistance on the longer-term chart
Bearish Scenario:
A confirmed break and daily close below 3308 would weaken the bullish outlook and suggest deeper downside risk toward:
3250 – minor support
3230 – stronger support and potential demand zone
Outlook:
Bullish bias remains intact while the Gold holds above 3266. A sustained break below this level could shift momentum to the downside in the short term.
This communication is for informational purposes only and should not be viewed as any form of recommendation as to a particular course of action or as investment advice. It is not intended as an offer or solicitation for the purchase or sale of any financial instrument or as an official confirmation of any transaction. Opinions, estimates and assumptions expressed herein are made as of the date of this communication and are subject to change without notice. This communication has been prepared based upon information, including market prices, data and other information, believed to be reliable; however, Trade Nation does not warrant its completeness or accuracy. All market prices and market data contained in or attached to this communication are indicative and subject to change without notice.
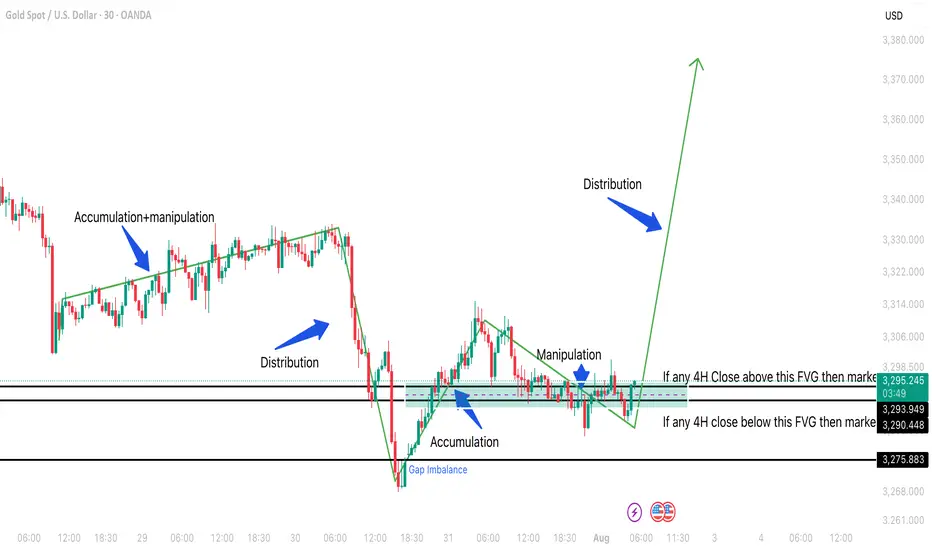
XAUMO XAUUSD (Gold Spot) ANALYSIS | AUG 01, 2025 | CAIRO TIME GMThis is a stealth bullish accumulation day. Market maker completed a fake drop and now prepping breakout. Play long bias from control zone with stop-hunt fade backup. Schabacker would call this a false breakdown spring + congestion base rally.
XAUUSD (Gold Spot) ANALYSIS | AUG 01, 2025 | CAIRO TIME GMT+3
🔍 Multi-Timeframe Technical Breakdown (Daily → 5m)
1️⃣ Price Action & Patterns
Daily: Bullish rejection tail forming (pin bar) off VAL (3,288). Strong buyer defense.
4H: Classic bullish engulfing off VAL support. High rejection wick to downside. Micro-structure shows market maker trap.
1H: V-shape recovery seen. Absorption bar confirmed via footprint delta spike.
15m: Buyers stepping in at POC (3,289.35), stealthy buying—confirmed by divergence between delta & price.
5m: Accumulation in box range between 3,289–3,292. High absorption on bid side, low offer lifting—sign of stealth long build.
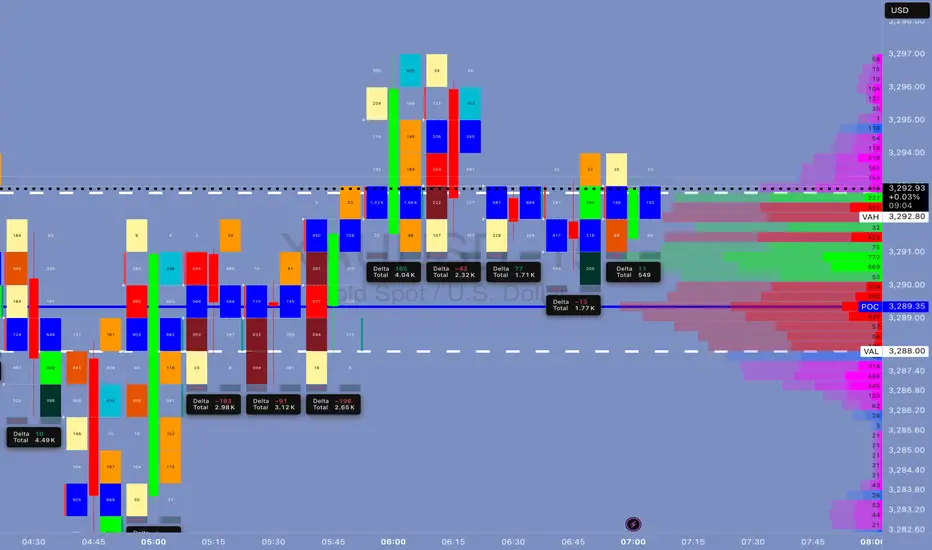
2️⃣ Volume & Delta Footprint
POC Cluster across all TFs: 3,289.00–3,291.50 is the control zone.
Volume Node Rejection at 3,288 = confirmed buyer base.
Delta: Absorption → sellers hitting bids but no follow-through = market maker trap → bullish implication.
Volume Spike at 3,288 = fakeout move likely manipulated to hunt stops.
3️⃣ Support/Resistance
VAL: 3,288 🔥 Strong Demand Zone
POC: 3,289.35–3,291.75 🧠 Smart Money Zone
VAH: 3,292.80 🎯 Break above confirms momentum
Res. Extension: 3,296.20, 3,300
Fibonacci Confluence: 3,288 = 61.8% golden retracement from recent rally
5️⃣Volatility
Compression near VAH = Volatility Expansion imminent.
Expect Breakout in next 1–2 hours (likely post 09:00 Cairo Time – Kill Zone)
6️⃣ Market Maker Philosophy
Last 3 days show liquidity vacuum trap below 3,288.
MM has triggered stop hunts to shake weak longs.
Building long inventory stealthily under POC.
Expecting rally trap to suck in breakout buyers → then retrace → final breakout continuation.
🧨 JEWEL TRADE ENTRY (Highest Probability)
📈 Order: Buy Stop
🎯 Entry: 3,293.10
🛑 Stop Loss: 3,287.70
💰 Take Profit: 3,302.40
📊 Confidence: 87%
🧠 Justification: Breakout of VAH/Golden Zone + High Volume Node = Trend Shift Confirmed
This is for EDUCATIONAL PURPOSE ONLY, and not financial advise.
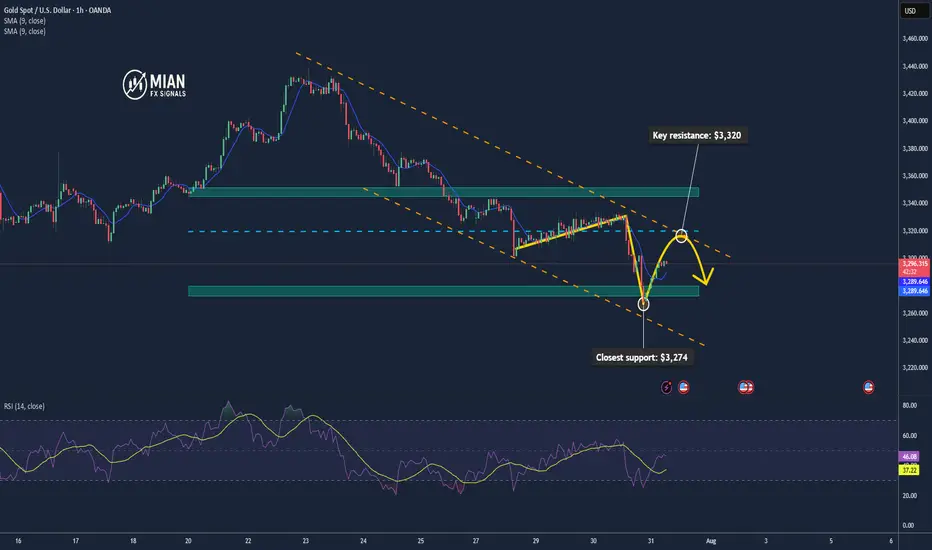
Gold May Rise Technically after Testing the $3,300 Zone📊 Market Overview:
Spot gold is trading around $3,295–$3,301/oz, influenced by slightly lower U.S. Treasury yields and a softer dollar tone. Analyst consensus from Reuters projects gold likely to stay above $3,220/oz through 2025 and possibly hit $3,400 in 2026 amid continued safe-haven demand
📉 Technical Analysis:
• Key resistance: $3,320 / $3,345
• Closest support: $3,274 – $3,280
• EMA09: Price is currently below the 9 period EMA on H1, indicating a short-term bearish bias.
• Candlestick / volume / momentum: There was a minor bounce from the support zone around $3,274, but volume remains low. RSI isn't oversold, suggesting room for technical pullback.
📌 Outlook:
Gold may experience a technical rebound if it holds above $3,280. A breakout above $3,320 would likely require clear catalyst—such as weak U.S. data or a dovish Fed tone.
💡 Suggested Trading Strategy:
SELL XAU/USD: $3,320 – $3,323
🎯 TP: 40/80/200 pips
❌ SL: $3,326
BUY XAU/USD: $3,279 – $3,282
🎯 TP: 40/80/200 pips
❌ SL: $3376
XAUUSD long day trade idea hello
day trading idea long up to 3372-3383 price zone
fibonaci levels , maybe 3390

XAUUSD Outlook – July 29, 2025
Gold enters a high-risk environment starting today.
All eyes are on Jerome Powell's speech, which will signal whether the Fed remains firm on its hawkish stance or adopts a more dovish tone.
📈 That said, a broader look at the chart suggests the market has already aligned itself with the dominant trend.
🗓️ In addition to today’s speech, tariff-related news expected on Friday doesn’t seem likely to disrupt the ongoing bullish momentum in gold — or in crypto markets, for that matter.
🧠 That’s the general market read I'm sensing right now, but we’ll have to see how it unfolds.
🎯 Personally, I still view the $3290 level as a solid buy zone, with the potential to become one of gold’s historical bottoms.

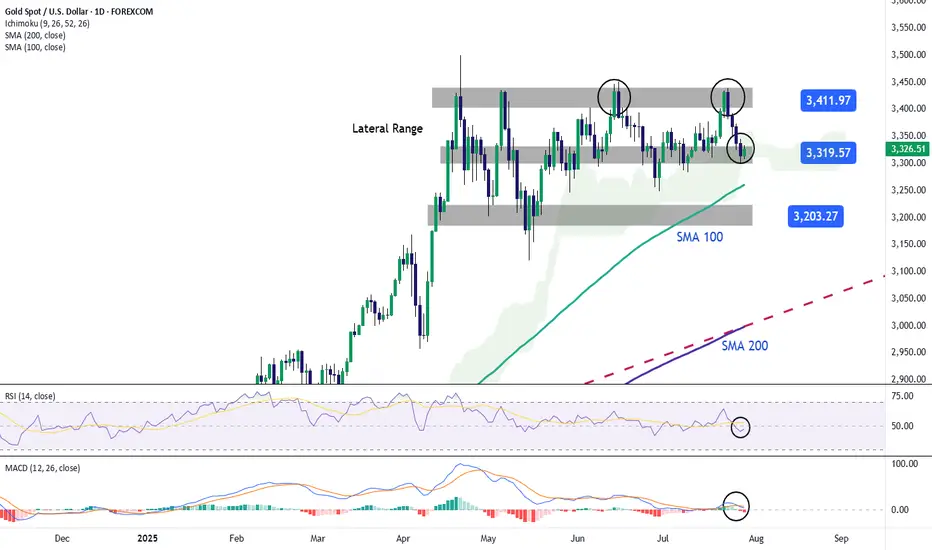
GOLD Falls Back Toward the $3,300 ZoneOver the past four trading sessions, gold has depreciated more than 3.5%, showing a renewed and steady bearish bias around this major safe-haven asset in the short term. Selling pressure has remained strong recently, as confidence in financial markets has gradually improved. Investors have responded positively to the latest trade agreement developments, which have temporarily reduced concerns surrounding the trade war. As a result, demand for safe-haven assets has declined, directly impacting gold, one of the most important hedging instruments currently in the market.
Sideways Range Remains Active
Since late April, gold has been unable to establish a clear directional bias, and has remained trapped within a sideways range, with resistance around $3,400 per ounce and support at $3,300 per ounce. So far, price action has not been strong enough to break out of this structure. However, gold is now testing important support levels, where sellers could begin to face stronger barriers as the price attempts to break through the bottom of the established range.
RSI: The RSI line has consistently crossed below the neutral 50 level, indicating that selling momentum is becoming more dominant. If this trend continues in the short term, it could reinforce the presence of bearish pressure in upcoming sessions.
MACD: The MACD histogram has started to move below the zero line, suggesting that the momentum of the moving averages has shifted firmly to the downside. This reflects a strong bearish tone, and if this continues, selling pressure could become more relevant in the short term.
Key Levels:
$3,400 per ounce – Major Resistance: This level marks the recent all-time high for gold. If buying momentum pushes the price back above this zone, it could trigger a renewed bullish bias and set the stage for a sustained upward trend in the sessions ahead.
$3,300 – Current Barrier: This level defines the lower bound of the short-term channel. A break below this support could confirm a dominant bearish bias, potentially lasting for several trading sessions.
$3,200 – Final Support: This marks the lowest price level reached by gold in recent months and lies below the 100-period simple moving average. If the price drops to this zone, it could trigger the start of a new short-term downtrend on the chart.
Written by Julian Pineda, CFA – Market Analyst
Xausd techinical analysis.Xausd techinical analysis next move posibale at h1 time frame not finchinal advice.

XAUUSD on Bearish values and volume Gold is currently below rising channel and holding the Range of 3320-3335,although yesterday implusive drop is incompleted without testing 3290-3280
Eyes on DXY
What's possible scanarios we have?
▪️I will wait next for my sell trades at 3338-3345 area but what we have to watch during that time H4 candle closing.if H4 & H1 candle close above I will not hold or renter sell also below 3320 we have implusive drop.
▪️Secondly if H4 candle closing above 3345 this down move will be invalid and Price-action will reached 3370.
#XAUUSD

XAUUSD
XAUUSD Updated in 15M :
The gold signal is marked on the chart based on the latest price changes and the supply and demand in the market. These points include the entry point, stop loss, and take profit

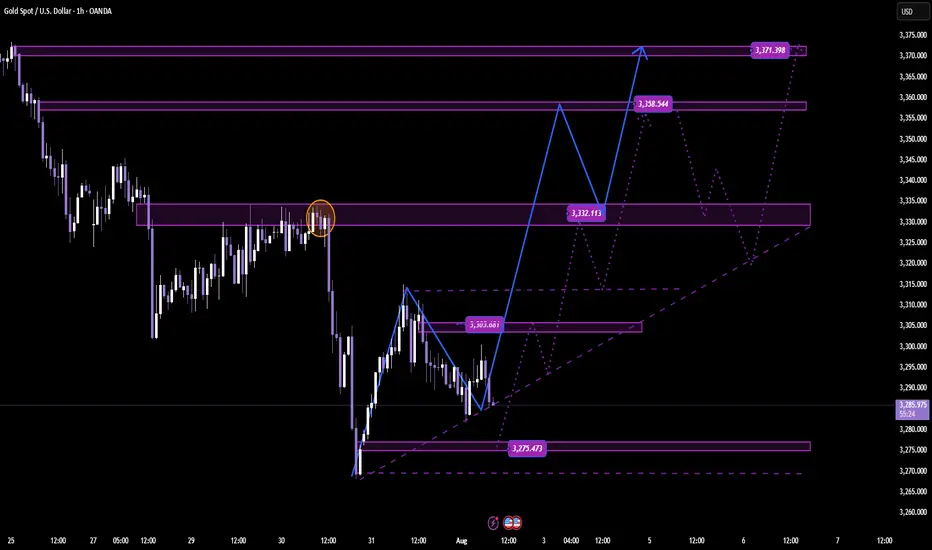
Gold Continues Mild Uptrend – Watching for Reaction at $3351📊 Market Overview:
Gold maintained its bullish momentum during the Asian–European session, rising from $3330 to $3344. A slightly weaker USD and safe-haven demand supported prices. However, price is now approaching a key resistance zone, where technical rejection may occur in the U.S. session.
________________________________________
📉 Technical Analysis:
• Key near-term resistance: $3345 – $3351
• Stronger resistance (higher zone): $3360 – $3366 and $3374
• Nearest support: $3335 – $3332
• Stronger support (lower zone): $3322 – $3315
• EMA 09 (H1): Price is above EMA09 → confirms short-term uptrend
• Candlestick / Volume / Momentum:
• Price is consolidating in an ascending triangle
• A breakout above $3345 may target $3360+
• RSI remains below overbought; volume is stable → room for continuation
________________________________________
📌 Outlook:
If gold holds above $3335 and breaks above $3351, the uptrend could extend toward the $3366–$3374 zone. However, failure to break $3351 followed by a drop below $3332 could lead to a deeper pullback toward $3315.
💡 Recommended Trading Strategies:
BUY XAU/USD: $3318 – $3315
🎯 TP: 40/80/200 PIPS
❌ SL: $3321
SELL XAU/USD: $3360 – $3363
🎯 TP: 40/80/200 PIPS
❌ SL: $3357

XAUUSD Outlook – From Bias to Execution Previous day closed bearish on XAUUSD, leading to a sell bias, On the 45M, I am looking out for possible entry and exit after a valid breakout of the bearish pennant, in line with my sell bias.

Gold Market Opens the Week with Bullish Hedge Toward 3370'sGold market opens the week by hedging into fresh demand at 3320's, building a bullish sentiment.
The price action now aims to mitigate 3370's, aligning with the continuation of the upward trajectory if structure holds. follow for more insights , comment and boost idea

XAU/USD(20250728) Today's AnalysisMarket news:
Trump announced that the US and Europe reached a trade agreement: 15% tariffs on the EU, $600 billion in investment in the US, zero tariffs on the US by EU countries, the EU will purchase US military equipment, and will purchase US energy products worth $750 billion. However, the US and Europe have different statements on whether the 15% tariff agreement covers medicines and steel and aluminum. Von der Leyen: The 15% tariff rate is the best result that the European Commission can achieve.
US Secretary of Commerce: The deadline for tariff increases on August 1 will not be extended. The United States will determine the tariff policy on chips within two weeks.
Technical analysis:
Today's buying and selling boundaries:
3345
Support and resistance levels:
3393
3375
3363
3326
3315
3297
Trading strategy:
If the price breaks through 3345, consider buying in, the first target price is 3363
If the price breaks through 3326, consider selling in, the first target price is 3315

GOLD (XAU/USD) SHORT TRADE PLAN
July 25, 2025
Trade Overview (My setup)
- Direction: Short (SELL)
- Entry Price: $3,330
- Take-Profit: $3,270
- Stop-Loss: $3,370
- Lot Size: 0.18 lots (18 oz)
- Risk: $720
- Reward: $1,080
- Risk/Reward Ratio: 1.5 : 1
Technical Analysis Supporting the Bearish Bias
1. Price Structure & Trend
- Descending channel observed on the 4H chart - strong short-term bearish signal.
- Series of lower highs and lower lows confirms bearish trend.
- Price is testing $3,325-$3,300 support - breakdown opens downside to $3,270-$3,250.
2. Key Support/Resistance Zones
- Key support: $3,300 being tested.
- Resistance: $3,360-$3,370 zone - logical stop-loss location.
3. Indicator Confirmations
RSI (4H): ~35-40, bearish territory, no bullish divergence.
Moving Averages: Price below 50 EMA and 200 EMA - bearish crossover.
MACD: Bearish crossover, histogram confirms selling momentum.

GOLD CONTINUATION PATTERNHello folks, here we go again, This idea stuck in my head only today and its friday. rather shared it or none, but see the charts for stops and target. this might be your lucky day on my page.
Here is my idea, take it if you love to swing or watch it fade. Congrats were on 800 community or I got more followers because of this. and Previous idea we made a lot thats 1200 pips good for a month trade. lets see this August. my target is labeled this chart first at 3500 zone. next target will be posted on my notes or updated the idea. no charts until it breaks that labeled on chart. until it goes higher again.
You will never see this kind of idea for a month again. So follow on my page, I have some for you if you have small accounts.d m here
My goal is to target the highest TP will be above this new highs.

DAILY SCALPING PLAN | CLINTON SMC STYLE✅ XAU/USD - DAILY SCALPING PLAN | CLINTON SMC STYLE
📆 Date: August 1st, 2025
📍 Strategy: Smart Money Concepts (SMC)
🔑 Focus: Liquidity Sweep | Order Block | BOS | Premium/Discount Model
🔍 Market Overview
Gold (XAU/USD) is currently in a manipulation phase after a strong move down from a premium supply zone. The market has swept key liquidity and is preparing for a high-probability move in both directions based on Smart Money footprints.
Current structure suggests:
Bullish intent forming from a discount demand zone.
Liquidity resting above recent highs – perfect for short-term scalps and intraday swings.
🟢 BUY SETUP – DISCOUNT DEMAND REACTION
🎯 Entry: 3275
🛡️ Stop Loss: 3268
🎯 Take Profits:
TP1: 3285
TP2: 3295
TP3: 3305
TP4: 3315
TP5: 3325
TP6: 3335
Reasoning:
This is a clean bullish OB resting beneath a CHoCH and BOS zone. Price may wick into this area as Smart Money reloads after sweeping early long positions. If held, expect sharp upside expansion toward previous liquidity highs.
🔴 SELL SETUP – PREMIUM SUPPLY REJECTION
🎯 Entry: 3356
🛡️ Stop Loss: 3362
🎯 Take Profits:
TP1: 3350
TP2: 3345
TP3: 3340
TP4: 3330
TP5: 3320
Reasoning:
This level is a key supply block where price previously distributed. If price expands into this zone, it’s likely to act as a liquidity magnet for Smart Money to offload longs and enter short-term shorts. Expect reaction.
🧠 SMC Insights
Internal BOS & CHoCH signal early signs of accumulation.
Price respects the premium vs. discount framework with clear liquidity targets.
SMC traders understand that price doesn’t move randomly – it targets liquidity, mitigates OBs, and respects structure.
🔔 Note:
Always wait for clear confirmation (rejection wick, engulfing pattern, or M15 structure shift) before execution. Entries without confirmation are riskier in current volatility.
📌 Follow @ClintonScalper for daily SMC scalping plans & deep institutional insight.
🔁 Like, comment & share if you find this helpful!
XAUUSD – Smart Money Sell Setup during New York Session | ICT St
Gold (XAUUSD) has just completed a classic liquidity grab above the London session highs, forming a potential Judas Swing as New York begins.
On the 4H timeframe, we clearly have a bearish BOS (Break of Structure), and price has returned to a Premium zone within a bearish FVG and OB (Order Block).
Today is NFP Friday, and after the Fed kept rates steady mid-week, we’re expecting high volatility.
Current price action has swept the overnight liquidity and is now reacting inside a Repricing Block, aligning perfectly with the NY Midnight Open level.
🎯 My Sell Plan (Live Execution):
Sell Limit: 3306.50
SL: 3317.50 (Above OB high)
TP1: 3281.20
TP2: 3268.50
TP3: 3253.90
🧠 Bias: Bearish
🕒 Session: New York
🧮 ADR: 43 pts
📉 Market Structure: Bearish
This setup follows the ICT methodology using time, liquidity, structure, and displacement.
If we break above 3317.50 with strong displacement, the idea becomes invalid.
Let's see if Smart Money takes it down into Friday’s close.

xauusdGold enters support by reaching daily trend line
If gold continues to hold support
Gold is expected to reach its previous high again

gold 4ooo projectionHello, me thinks gold is ready for a midterm correction, which in turn can propel it to 4ooo. This is just an idea, not financial advice. Cheers

GOLD NON FARM ANALYSISAs you can see market is moving round and round inside bullish FVG from thursday night 31 july and making sell side liquidity which is till 3382 so possible move can be an expansion which will be bullish.4H bullish FVG indicates that market does not wants to go down.