Gold (XAU/USD) Analysis:Gold remains in a downward trend and is currently moving sideways in a consolidation phase in the short term. The bearish outlook still dominates, with a potential move toward levels like $3,245.
1️⃣ A break and close below $3,276 may trigger a drop toward the strong support zone at $3,245.
2️⃣ However, if bullish momentum pushes the price above $3,310, this opens the path toward $3,330, a key level where a bearish rejection might occur.
📈 If the price holds above $3,330, a continuation toward $3,350 becomes likely.
⚠️ Disclaimer:
This analysis is not financial advice. It is recommended to monitor the markets and carefully analyze the data before making any investment decisions.
XAUUSDK trade ideas

gold 4ooo projectionHello, me thinks gold is ready for a midterm correction, which in turn can propel it to 4ooo. This is just an idea, not financial advice. Cheers

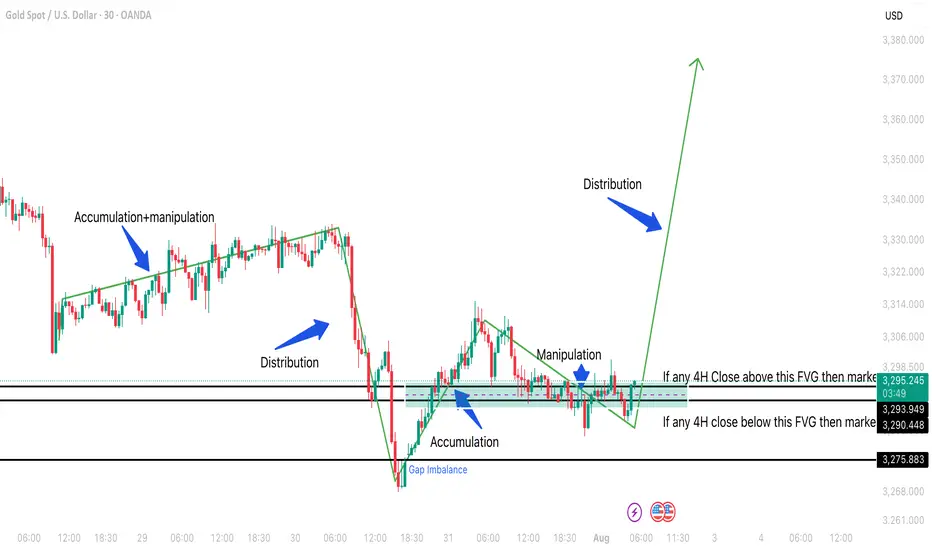
GOLD NON FARM ANALYSISAs you can see market is moving round and round inside bullish FVG from thursday night 31 july and making sell side liquidity which is till 3382 so possible move can be an expansion which will be bullish.4H bullish FVG indicates that market does not wants to go down.
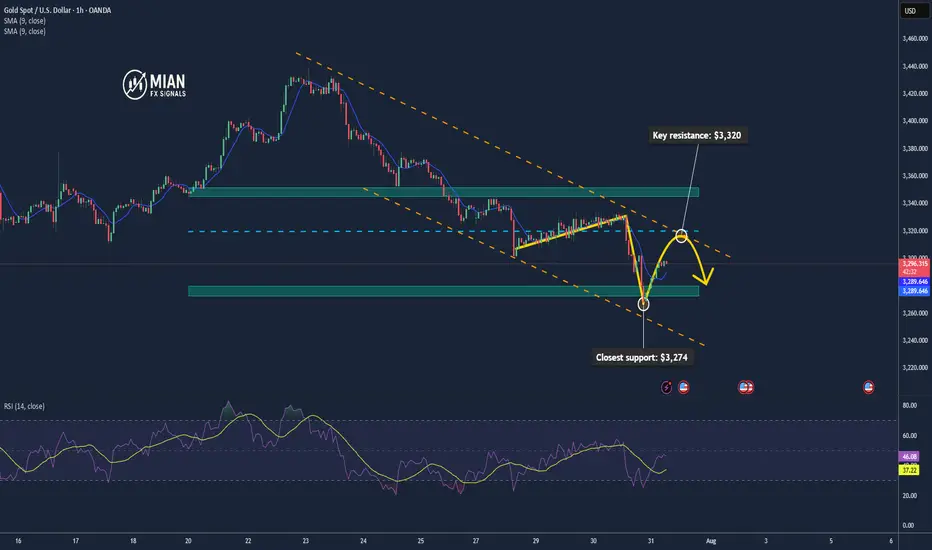
Gold May Rise Technically after Testing the $3,300 Zone📊 Market Overview:
Spot gold is trading around $3,295–$3,301/oz, influenced by slightly lower U.S. Treasury yields and a softer dollar tone. Analyst consensus from Reuters projects gold likely to stay above $3,220/oz through 2025 and possibly hit $3,400 in 2026 amid continued safe-haven demand
📉 Technical Analysis:
• Key resistance: $3,320 / $3,345
• Closest support: $3,274 – $3,280
• EMA09: Price is currently below the 9 period EMA on H1, indicating a short-term bearish bias.
• Candlestick / volume / momentum: There was a minor bounce from the support zone around $3,274, but volume remains low. RSI isn't oversold, suggesting room for technical pullback.
📌 Outlook:
Gold may experience a technical rebound if it holds above $3,280. A breakout above $3,320 would likely require clear catalyst—such as weak U.S. data or a dovish Fed tone.
💡 Suggested Trading Strategy:
SELL XAU/USD: $3,320 – $3,323
🎯 TP: 40/80/200 pips
❌ SL: $3,326
BUY XAU/USD: $3,279 – $3,282
🎯 TP: 40/80/200 pips
❌ SL: $3376
Gold (XAU/USD) Analysis:Following yesterday's Fed statements regarding the economic impact of tariffs and the decision to keep interest rates unchanged, gold prices dropped to $3,268, before rebounding today to retest the $3,310 zone. The short-term trend remains bearish.
1️⃣ A break and hold below $3,300 may push the price toward $3,280, and potentially $3,260.
🔻 A confirmed break below $3,260 could lead to a deeper decline toward a strong support zone near $3,245.
2️⃣ On the other hand, if bullish momentum appears and the price breaks above $3,310, it may open the path to $3,330 — a key level that could trigger a bearish rejection.
📈 However, if the price holds above $3,330, the next target would be $3,350.
⚠️ Disclaimer:
This analysis is not financial advice. It is recommended to monitor the markets and carefully analyze the data before making any investment decisions.

GOLD for short timeCaption important🛑🛑🛑
Hello to all traders. 😎😎
I hope all your deals will hit their targets. 🎉🎉
Gold has broken a key trendline on the 4H chart, and I believe the bearish move could continue today, potentially down to at least $3300.
My expectation is that price will first reach the $3335–$3340 zone. From there, you can look for a good short opportunity, with a suggested stop-loss at $3355.
If you’re willing to take on more risk, you could consider opening a short position from the current level around $3325, using a reasonable position size.
Personally, I prefer to wait for price to reach the orange zone ($3335) and enter a solid short position from there.
What Do You Think?
Which scenario do you think is more likely to happen? **Share your thoughts!** ⬇️
Don't forget that this is just an analysis to give you an idea and trade with your own strategy. And don't forget the stop loss🛑🛑🛑
❤️❤️❤️The only friend you have in financial markets is your stop loss❤️❤️❤️
Please support me with your ✅' like'✅ and comments to motivate me to share more analysis with you and share your opinion about the possible trend of this chart with me 🙏😊
Be Happy , Ali Jamali
Will Gold Break Higher or Resume the Downtrend?Gold has been trading within a defined rising channel pattern, forming a short-term consolidation phase after a significant bearish leg. The current setup presents a critical inflection zone where Gold (XAUUSD) could either break out above the resistance trendline and major resistance zones or retrace and resume the prior downtrend.
Traders and investors should pay close attention to the price behavior around these key levels for possible high-probability trading opportunities.
📊 Technical Breakdown
1. Rising Channel Pattern
Gold has been bouncing between a support trend line and a resistance trend line, forming a rising channel. This indicates a controlled upward movement or short-term relief within a broader downtrend.
Support Trendline: Has been respected multiple times and offers a key reference point for bullish continuation.
Resistance Trendline: Acting as a cap on the short-term rallies.
This pattern represents a state of consolidation and indecision, often preceding a strong breakout in either direction.
2. Major Resistance Zone Ahead
The region around $3,345–$3,355 is stacked with:
Previous supply zones.
Confluence of the channel resistance and historical price rejection.
Psychological level near $3,350.
This zone is the make-or-break point for bulls. A successful breakout above this resistance could open the doors for a strong bullish continuation targeting levels such as:
$3,370
$3,390
$3,400+
But without a convincing close above this zone, bullish attempts may get rejected, resulting in a pullback or even breakdown.
3. Immediate Support Zone
On the downside, $3,320–$3,325 is a key short-term support level:
Aligned with the lower boundary of the channel.
Previous breakout retest zone.
Demand area observed in past bounces.
If this zone fails to hold, Gold could witness a strong decline, with potential targets at:
$3,310
$3,290
$3,275
🧠 Two Scenarios for Traders
✅ Bullish Breakout Scenario:
Trigger: Price breaks above $3,355 and sustains.
Retest Opportunity: If price comes back to test the breakout zone with a bullish engulfing candle or pin bar, it can serve as confirmation.
Target Zones: $3,370 / $3,390 / $3,400+
Stop Loss: Below the breakout point or recent higher low inside the channel (~$3,320)
❌ Bearish Breakdown Scenario:
Trigger: Breakdown of the support trendline and close below $3,320.
Confirmation: A bearish retest or continuation candle adds strength to the setup.
Target Zones: $3,310 / $3,290 / $3,275
Stop Loss: Above $3,335 (recent high)
📝 Final Thoughts
The XAUUSD 1H chart is setting up for a volatile move as price action coils between strong support and resistance. The rising channel within the larger downtrend makes this an ideal setup for both breakout traders and trend followers.
For bullish traders, the best entry lies above the resistance trendline, ideally after a retest. For bearish traders, a breakdown below the support line confirms downside momentum continuation.
In either direction, a clear break from this consolidation channel is likely to deliver a fast, directional move. Patience is key—wait for a clean breakout or breakdown before entering large positions.
=================================================================
Disclosure: I am part of Trade Nation's Influencer program and receive a monthly fee for using their TradingView charts in my analysis.
=================================================================

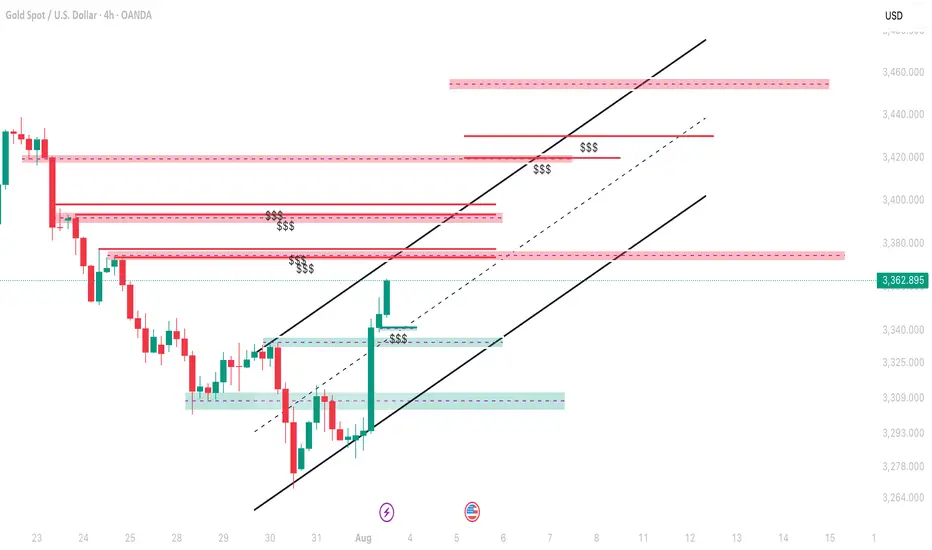
Gold Trade plan 30/07/2025Dear Traders,
This chart represents the XAU/USD (Gold / U.S. Dollar) pair on a 4-hour timeframe. The market is showing a series of Fibonacci retracements and key levels, with potential price action zones marked for future movements.
Key Levels:
Resistance Zones: At 3,422.105 (near the green line), followed by the 3,386.171 level (Fibonacci 0.618).
Support Zones: Major support is visible near 3,282.131 (bottom of the chart), with additional minor support levels at 3,305.000 and 3,293.000.
Mid-range Support: Around 3,369.987.
Potential Price Action:
The price recently dropped from higher levels, breaking below the previous support levels. The market seems to be testing lower support zones.
A potential move down towards 3,284.116 or 3,282.131 is likely if the current support levels do not hold.
Conversely, if price action holds the current support zone (3,329.040), a retest of the higher resistance at 3,350.163 could occur.
Fibonacci Levels:
Retracement Levels: The Fibonacci retracement is drawn with key levels, particularly around 3,372-3,378 and 3,349-3,357, acting as strong support or resistance.
Extensions: There is potential for the price to move towards the 3,420 region if resistance levels break.
Strategy Suggestion:
Short Position: Targeting lower levels near 3,282.131 or 3,284.116.
Long Position: If price holds above 3,329.040, target resistance at 3,350.163 and beyond.
Regards,
Alireza!

XAUUSD INTRADAY ANALYSIS – AUGUST 6, 2025Gold OANDA:XAUUSD is currently consolidating around the 3,371 zone after breaking above a descending trendline formed from late July highs. A strong bullish impulse on August 2nd with significant volume suggests renewed buying pressure. Price is now retesting the breakout area — a critical moment to determine if the bullish continuation is sustainable.
- Technical Breakdown:
1. Price Structure & Trendline:
The former resistance at Peak 1 (3,376) is now acting as new support.
A new ascending channel has formed following the breakout.
Price structure is showing higher highs and higher lows, indicating short-term bullish momentum.
2. Fibonacci & EMA:
The Fibonacci retracement of the recent bullish wave (Aug 1–5) aligns the 0.382 and 0.5 zones with strong support around 3,365 – 3,352.
Price is hovering near the EMA20, and a close above this level will further confirm upside potential.
3. RSI Indicator:
RSI is stabilizing around 50–55, reflecting neutral momentum with room for bullish continuation.
- Key Price Levels:
3,352 – 3,365: Major Support (Fib + EMA + previous lows)
3,376 – 3,380: Immediate Support (breakout retest area)
3,390: Minor Resistance
3,438: Bullish Target (Peak 2)
- Suggested Trading Strategy:
Primary Bias: BUY if price holds above 3,365
Entry Zone: Around 3,369–3,372 (retest + trendline confluence)
Stop Loss: Below 3,352
Take Profit: 3,438 (previous peak)
Risk/Reward: ~1:9 (very favorable setup)
- Look for bullish confirmation (e.g., bullish engulfing or pin bar around 3,365–3,370) for a high-probability entry.
- Alternate Scenario:
If price breaks below 3,352 with strong volume, the bullish thesis may be invalidated. In that case, consider short-term short positions targeting 3,320 area.
This chart setup presents a promising trend-continuation opportunity, with technical confluences supporting further upside. As always, wait for clear price action signals before entry and manage risk accordingly.

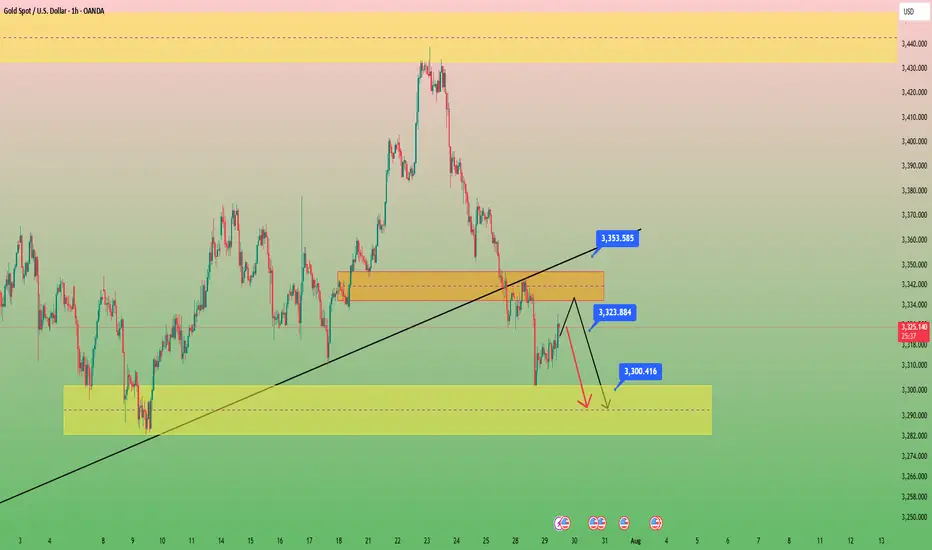
Gold (XAU/USD) Technical Analysis:Gold began a corrective move with today’s market open and is currently testing the $3,350 support zone, with further downside potential toward $3,310.
🔹 Bearish Scenario:
If the price breaks below $3,350 and holds, a continued correction toward $3,310 is likely.
🔹 Bullish Scenario:
If the price breaks above $3,365 and sustains momentum, it could open the way toward $3,390, and with further bullish pressure, extend to $3,430.
⚠️ Disclaimer:
This analysis is not financial advice. It is recommended to monitor the markets and carefully analyze the data before making any investment decisions.

XAU / USD 4 Hour ChartHello traders. I just figured while I am at the computer to post the 4 hour chart now. We can see that we are coming into an area where we will either reject if support forms, or keep pushing down a bit more. We have ISM news here in the US at 10am est. I will update / post any scalp trade set ups on a lower time frame in a bit. Be well and trade the trend. Shout out to Big G. Happy Tuesday

uptrend for GOLD ?According to the chart, we have an ascending channel and the RSI indicator is also in the ascending channel.
Considering the data on the tension between China and Taiwan and the tariff and oil wars between the United States and China, Russia, India, etc., the possibility of gold growth is not far from imagination.

XAUUSD (Gold) Intraday/Swing Trading Plan – Tuesday, 5th August Timeframe: M30 (30-Minute)
Strategy Type: Structured Buy-the-Dip with Staggered Take Profits
Market Bias: Bullish
Risk Profile: Moderate Risk, Medium Holding Duration
Trade Style: Intraday Momentum + Short Swing
🧠 Market Structure & Context
Gold continues to show a strong upward momentum in early August, with the M30 chart printing higher highs and higher lows consistently. Monday’s session closed with bullish strength above key psychological zones, suggesting the uptrend remains intact. Price is currently retracing after an impulsive move, providing a prime opportunity for a clean entry.
The M30 structure also shows a tight bullish channel, and pullbacks into confluence zones have proven to be reliable buy areas. The plan will focus on timing re-entries after each impulse leg to ride multiple profit waves toward higher targets.
🔍 M30 Trading Plan Breakdown
✅ Phase 1: Buy on Retracement to 3379 (Primary Entry Zone)
Entry Zone: 3379
Why:
Key support zone from previous structure breakout
Near 50% Fibonacci retracement of prior impulse
Price-action pivot zone where buyers stepped in Monday
Confirmation to Enter:
Bullish engulfing or hammer on M30
RSI bounce above 40–45
Price closes back above dynamic support (50 EMA)
Stop Loss:
Below 3369 (10 pips buffer beneath structure)
🎯 Target 1: 3395
Reasoning:
Short-term resistance from Monday NY session wick high
Completion of first impulse move (~1.5R target)
Action:
Take 30–40% profit
Move SL to breakeven or trail slightly below new support at 3385
Wait for pullback to enter Phase 2
✅ Phase 2: Re-Entry After Pullback (Post-3395)
Retracement Zone: 3388–3390 (bullish flag / higher low expected)
Re-Entry Trigger:
Tight consolidation followed by bullish breakout on M30
RSI remains above midline; MACD crossover confirmation optional
🎯 Target 2: 3418
Why:
Next resistance zone based on price rejection in late July
Also aligns with intraday Fibonacci extension (1.272 of the first wave)
Strong psychological + structural zone
Action:
Take 30–40% more profit
Adjust trailing SL to 3398 or dynamic support based on EMA
Monitor for pullback to hold or fade
✅ Phase 3: Final Position Hold or Re-Add on Pullback
Retracement Zone: 3405–3408 (previous resistance turned support)
Entry/Scaling Condition:
Price respects the new support zone and prints continuation candle
M30 volume and momentum remain positive
🎯 Target 3: 3443
Why:
Key psychological level near 3440–3450 resistance
Top of projected trend channel and potential supply zone
Excellent exit zone before possible reversal or profit-taking by institutions
Action:
Close remaining 20–30% of position
Optional: Watch for breakout >3443 for longer swing continuation if fundamentals align
⚠️ Risk Management Notes
Max risk per full plan: 1.5–2% of account
SLs strictly enforced at each entry
No entry during high-impact news spikes (check economic calendar)
Never chase — only execute on confirmed candle setups and risk-reward compliance
🔁 Summary Table
Phase Buy Level Target SL Action
Phase 1 3379 3395 3369 Take 30–40%, trail SL
Phase 2 3388–3390 3418 3379 Take 30–40%, trail SL
Phase 3 3405–3408 3443 3395 Take final 20–30%, full exit
📊 Indicators Used
50 EMA / 200 EMA: Confirm trend and support
RSI (14): Trend strength and bounce signal
MACD: Confirmation of momentum continuation
Volume: Increased buy-side volume confirms valid breakout after retracement
🕒 Session Timing Considerations
Asian Session: Wait for price to dip to 3379 — ideal entry zone
London Open (3pm SG time): Look for breakout toward 3395
New York Open (8:30pm SG time): Strong move possible to 3418 or 3443 depending on momentum and news catalysts

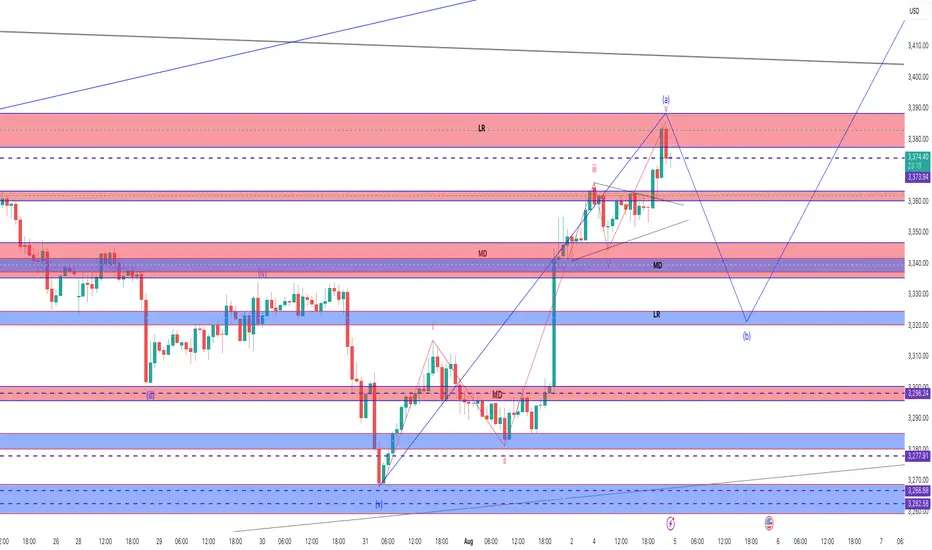
Letting the Pullback Happen – Lining Up for the Next BuyPrice just hit that tough resistance at 3,373–3,380 and started to drop—pretty much what I expected for wave (a) top. Now waiting for a wave (b) pullback. Not chasing here, just being patient.
Game plan:
Waiting for price to drop into the 3,330–3,325 support zone.
If I see a nice bounce or bullish candle in that area, I’ll look to go long.
First target: Back to the 3,373–3,380 resistance. If price smashes through, will hold a small portion for a bigger run.
Stop loss: Just below 3,320 or the latest swing low—keeping it tight.
If price goes lower, next buy zone is 3,298, then 3,278. I’ll repeat the same idea.
If price dumps below 3,262, I’m out. No interest in holding longs if support fails.
XAUUSD 30M Range Trap Holding, But Will Bulls Break Above $3366Gold is currently trading within a well defined intraday range, with clear resistance around $3,366.36 and support near $3,339.78. After a strong initial move, price action has stalled, reflecting indecision and balanced order flow between buyers and sellers.
The market now approaches a key inflection point:
→ A confirmed 30 minute candle close above $3,366.36 would signal potential bullish continuation, with immediate targets at $3,368.99 and $3,371.11
→ Conversely, a close below $3,339.78 may trigger a downside move toward $3,331.66, followed by $3,328.21
Momentum remains neutral within the range, and any premature entries carry increased risk of whipsaw. Patience is essential, a clean breakout with structure and volume confirmation will offer higher probability trade setups.
This remains a rangebound environment until proven otherwise. Breakout traders should stay alert, but disciplined.
#XAUUSD #Gold #TechnicalAnalysis #PriceAction #SupportResistance #BreakoutWatch #MarketStructure #30mChart

Gold (XAU/USD) Technical Analysis – NeoWave Perspective📅 August 2025 | 📈 4H Chart
📍Posted by: @ CryptoPilot
Gold completed a corrective Wave A near $3160 at the bottom of the descending channel. It then rallied to $3440, followed by a decline toward the channel’s midline at $3227, beginning a potential Wave C.
Attempts to break and hold above the channel failed. Price has since broken below the trendline and is now pulling back to retest it from below.
⸻
🔍 Key Insights:
• 📉 No long entries recommended at current levels
• ✅ Bullish confirmation requires a clear breakout and close above the channel top
• 🛒 Safer long setup may emerge near $3120 at the channel bottom and possible Wave C completion zone.
⸻
🔑 Key Levels:
• Resistance: $3380–$3440
• Support: $3120
• Invalidation / Stop-loss: Below $3110
⸻
📌 Follow @ CryptoPilot for more wave structure insights, SMC confluence, and multi-timeframe strategies.
💬 Drop your thoughts and alternate counts in the comments below!

04/08/25 Gold Swing LevelsBack to Gold but with daily swing levels.
Monday 04/08/25 levels are marked; depending on if market opens with a gap, price should continue upwards.
Trade parameters
Entry on 5 min chart
Sl: 30-50pips
TP: 2-4x SL

XAUUSDXAUUSD breakout falling channle and resistance zone.
Buy above 3295
Stop Loss: 3291
1st TP: 3308
2nd TP: 3313
3rd TP: 3322
4th TP: 3333

Elliott Wave Perspective: Triangle Completion in Sightrom the Elliott Wave viewpoint, the current pattern suggests a potential completion of the triangle formation.
To confirm this scenario, a breakout above the bd trendline is required.


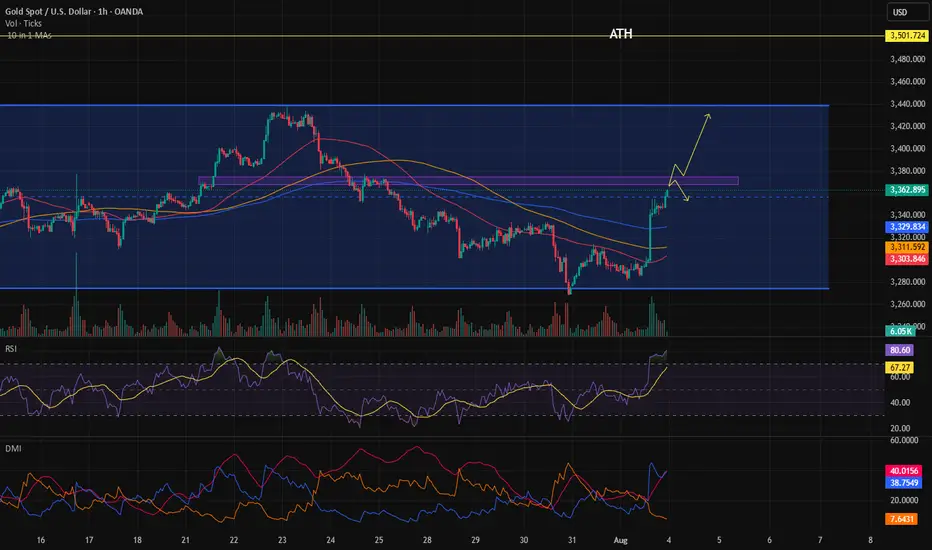
Gold (XAU/USD): Supply Zone Rejection & Bearish Breakdown Chart Breakdown:
Supply zone rejection: Gold revisited the “supply zone” (light green/grey area) and failed to break above — a classic signal of seller dominance.
Uptrend invalidated: A sharp rise (steep black trendline) ended with a peak marked by the green arrow, followed by a decisive breakdown.
Ichimoku Cloud test: Prices slipped through the Ichimoku components, reinforcing the shift to bearish sentiment.
Potential targets: The red/green risk‑reward box highlights a short position, targeting ~3,347 then ~3,318 levels (blue labels) as initial support zones.
Strong supply base: The extensive grey zone below marks a "stronger supply zone" — this could cap any modest bounce and keep the downtrend intact.
🔍 Interpretation:
Bias: Bearish — sellers have taken control after a failed breakout.
Strategy: Short on rallies toward the mid‑green/red box (~3,373–3,380), targeting ~3,347 first and then ~3,319. Watch for support at the strong supply region (~3,292) for potential reversal or consolidation.
Risk management: Keep stop above the red zone—above recent highs (~3,380+) to limit risk.
🚀 In a nutshell: After failing to break supply and losing its short‑term uptrend, gold appears poised for a pullback. The next key levels to watch are ~3,347 and ~3,319—where buyers might step back in, or the downtrend continues toward the deeper supply base.

Trend continuation or reversal?Gold bounced strongly from the bottom of the higher time frame channel, and we should also consider that this bounce was triggered by news that was negative for the dollar on Friday. Now we need to wait and see whether this move is truly strong or if it's going to turn out to be a fake and head back down toward the bottom of the channel.
Final Plan with liquidities for Aug 4 onwardsAs after marking liquidities we can assume that Plan B will be more better for AUG 4 onwards trading.