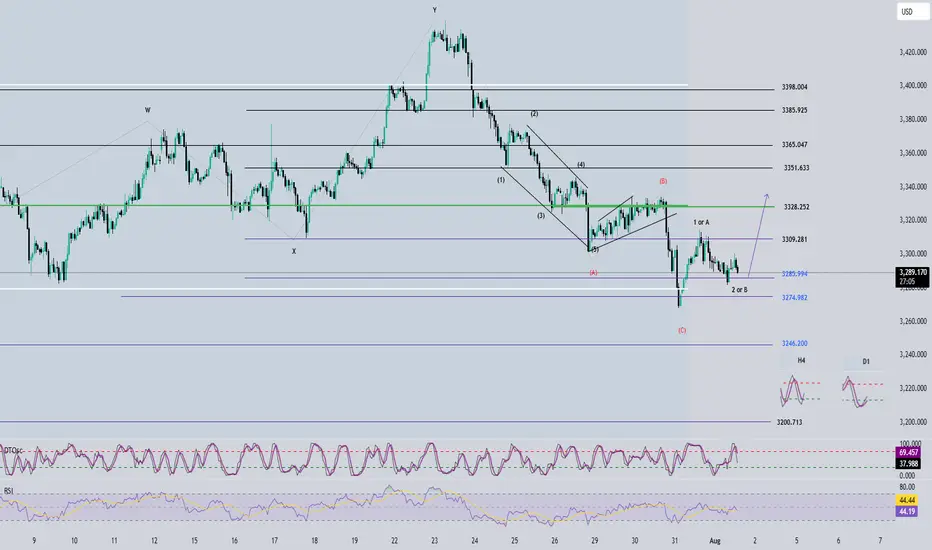
Elliott Wave Analysis – XAUUSD August 1, 2025📊
________________________________________
🔍 Momentum Analysis:
• D1 Timeframe:
Momentum has reversed to the upside. Based on this signal, we expect a bullish trend to continue for the next 5 daily candles — likely until mid-next week.
• H4 Timeframe:
Momentum has also turned upward → This suggests that from now until the U.S. session, the price will likely continue to rise or consolidate with an upward bias.
• H1 Timeframe:
Momentum is currently turning down → We anticipate a short-term corrective move. We should wait for H1 to enter the oversold zone and give a bullish reversal signal before looking for long entries.
________________________________________
🌀 Wave Structure Analysis:
The current wave structure remains complex and lacks clear confirmation. Thus, the current wave labeling should be considered provisional. However, the wave count has not been invalidated, and D1 momentum supports a bullish outlook — so we continue to maintain our wave structure bias.
Important Note:
Wave (C) in red appears relatively short. This leaves open the possibility that the price may continue lower, targeting:
• ⚠️ 3246
• ⚠️ 3200
→ This scenario will be triggered if price breaks below 3268, especially given today's Nonfarm Payroll (NFP) report.
________________________________________
📌 Two Possible Wave Scenarios:
1. Scenario 1: Black Waves 1 – 2 – 3
o Wave 1 (black) is complete.
o We are now in Wave 2 (black) → Preparing for Wave 3.
o Wave 3 tends to be strong, impulsive, and sharp with large candle bodies.
o Target: 3351
2. Scenario 2: Black ABC Correction
o The market is currently in Wave B (black).
o Potential target for Wave C: 3328
________________________________________
🛡 Support Zones & Trade Strategy:
• Support Zone 1: 3290 → A good area for potential buying, but we must wait for H1 to enter the oversold region and show a bullish reversal.
• Support Zone 2: 3275 → Deeper buy zone if the price corrects further.
________________________________________
💡 Trade Plan:
📍 Option 1 – Buy Limit:
• Buy Zone: 3290 – 3289
• Stop Loss: 3280
• Take Profit 1: 3309
• Take Profit 2: 3328
• Take Profit 3: 3351
📍 Option 2 – Buy Limit:
• Buy Zone: 3275 – 3273
• Stop Loss: 3265
• Take Profit 1: 3309
• Take Profit 2: 3328
• Take Profit 3: 3351
________________________________________
📎 Notes:
• Experienced traders should wait for clear confirmation signals on H1 before entering trades.
• New traders may consider using limit orders in the proposed buy zones.
XAUUSDK trade ideas
Gold Market Rejected at 3310 as Bearish Channel HoldsGold market faced rejection at 3310, failing to break above the bearish channel, as DXY strength continues to weigh on price action. The inability to sustain above key levels reflects ongoing bearish pressure, unless a clear break occurs.
🔍 Key Insight:
3310 acts as a short-term ceiling
DXY strength supports the bearish stance, follow for more insights coment and boost idea .

XAUUSDXAUUSD breakout falling channle and resistance zone.
Buy above 3295
Stop Loss: 3291
1st TP: 3308
2nd TP: 3313
3rd TP: 3322
4th TP: 3333

GOLD: Short Trading Opportunity
GOLD
- Classic bearish formation
- Our team expects fall
SUGGESTED TRADE:
Swing Trade
Sell GOLD
Entry Level - 3299.9
Sl - 3304.2
Tp - 3291.3
Our Risk - 1%
Start protection of your profits from lower levels
Disclosure: I am part of Trade Nation's Influencer program and receive a monthly fee for using their TradingView charts in my analysis.
❤️ Please, support our work with like & comment! ❤️

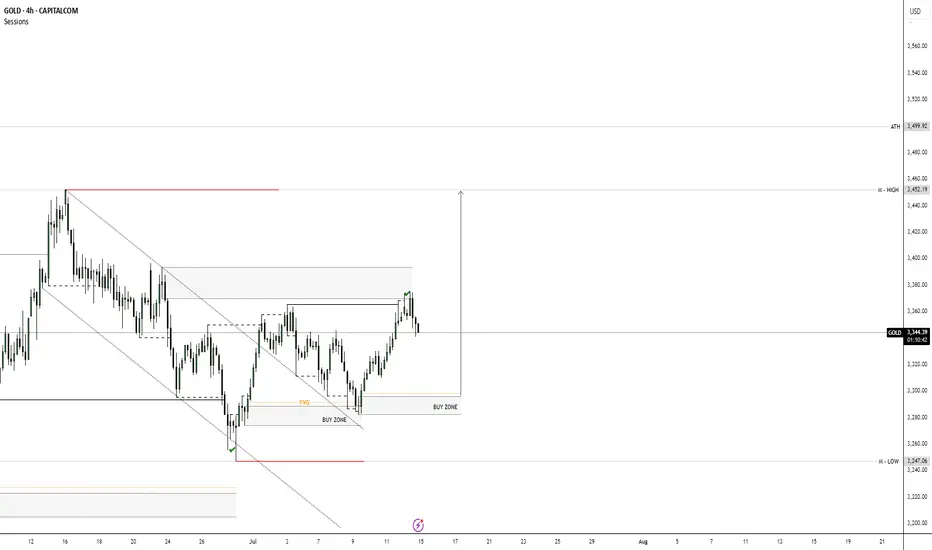
XAUUSD ANALYSYS 💸GOLD💸
Market Outlook: Bullish
• Price broke out of a downtrend channel and is now forming higher highs and higher lows — clear sign of a trend reversal.
• Current move is a pullback after a strong push up.
⸻
📍 Key Zones:
• Buy Zones and Fair Value Gaps (FVGs) are marked.
• These are areas where buyers may step in again.
• Price is pulling back into these zones — potential long entry area.
⸻
🎯 Target:
• The top red line marks a liquidity zone or resistance.
• Price is likely aiming to reach this area next.
⸻
📈 Trade Setup Idea:
• Buy on pullback to the FVG / Buy Zone.
• Stop Loss: Below the Buy Zone.
• Take Profit: At the previous high (resistance zone).
⸻
⚠️ Risk to Watch:
• If price breaks below the Buy Zone, bullish setup is invalidated — wait for new structure.
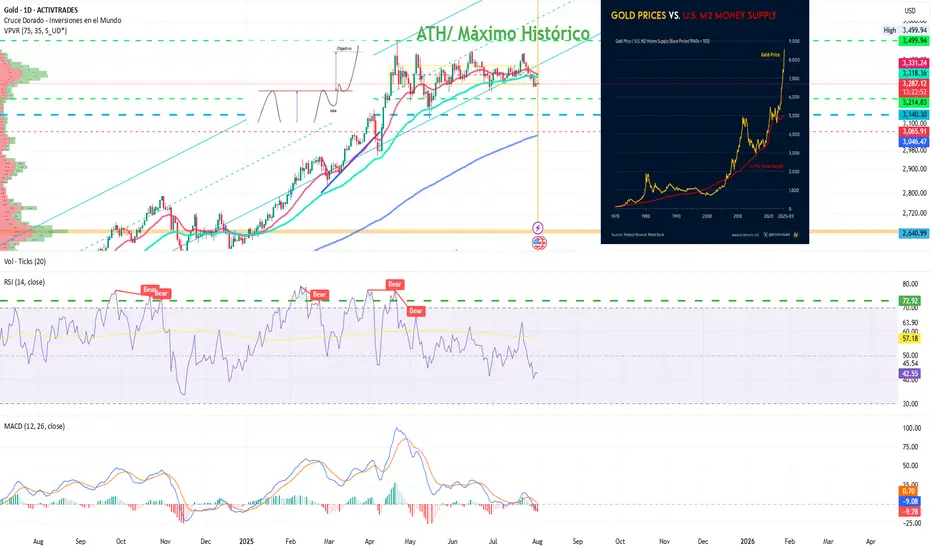
Gold: Are the Bulls Still Behind It?Ion Jauregui – Analyst at ActivTrades
Fundamental Analysis
In 2025, gold has appreciated around 27% year-to-date, reaching a peak of 33.37% at the end of April, driven by structural factors. Its strength is based on global de-dollarization, central bank purchases, persistent inflation, and expectations of real rate cuts in the U.S. Since real interest rates peaked in July 2023, gold has risen 74%, reinforcing its role as a hedge against monetary policy.
In addition, countries like China and Russia continue to accumulate gold as protection against the dollar and potential sanctions, supporting long-term structural demand. Diversifying with physical and financial gold (ETFs, mining stocks) is an increasingly common strategy in an environment of high debt, geopolitical tensions, and doubts about traditional safe-haven assets. A suggested allocation in a classic model portfolio could range between 10% and 25%, depending on the risk profile, in a typical equity-focused investment portfolio.
Technical Analysis
From a technical standpoint, gold has completed a long-term “cup with handle” formation that began in 2012, with an upside projection toward the $4,000 per ounce area. This pattern supports the continuation of its long-term upward structure.
In the short term, however, the price is in a consolidation phase after reaching all-time highs of $3,499.94 at the end of April. Since then, the lateral movement suggests a pause within the primary trend.
Technical indicators are showing mixed signals: RSI and MACD are pointing toward a possible oversold condition, suggesting a risk of short-term correction. Additionally, a bearish crossover between the 50-day and 100-day moving averages may reinforce selling pressure.
If this corrective scenario unfolds, gold could retrace toward a key support zone around $3,140, a level that has served as the base of the current range and where renewed buying interest could emerge.
Despite a possible pullback, the broader technical outlook remains constructive. Any correction would likely present tactical opportunities to re-enter the market—especially if expectations of real rate cuts or global geopolitical tensions persist.
Gold Consolidates After Highs
All in all, despite potential short-term pullbacks, gold continues to offer value as a tool for diversification, wealth protection, and a hedge against systemic risks. Its inclusion in portfolios remains relevant, even at current levels.
*******************************************************************************************
The information provided does not constitute investment research. The material has not been prepared in accordance with the legal requirements designed to promote the independence of investment research and such should be considered a marketing communication.
All information has been prepared by ActivTrades ("AT"). The information does not contain a record of AT's prices, or an offer of or solicitation for a transaction in any financial instrument. No representation or warranty is given as to the accuracy or completeness of this information.
Any material provided does not have regard to the specific investment objective and financial situation of any person who may receive it. Past performance and forecasting are not a synonym of a reliable indicator of future performance. AT provides an execution-only service. Consequently, any person acting on the information provided does so at their own risk. Political risk is unpredictable. Central bank actions can vary. Platform tools do not guarantee success.
GoldGold Giving pulllback and then again go sell this time target is 3247..if this level breaks and any close below h4 it will further downside


Gold (XAU/USD) Analysis:Following yesterday's Fed statements regarding the economic impact of tariffs and the decision to keep interest rates unchanged, gold prices dropped to $3,268, before rebounding today to retest the $3,310 zone. The short-term trend remains bearish.
1️⃣ A break and hold below $3,300 may push the price toward $3,280, and potentially $3,260.
🔻 A confirmed break below $3,260 could lead to a deeper decline toward a strong support zone near $3,245.
2️⃣ On the other hand, if bullish momentum appears and the price breaks above $3,310, it may open the path to $3,330 — a key level that could trigger a bearish rejection.
📈 However, if the price holds above $3,330, the next target would be $3,350.
⚠️ Disclaimer:
This analysis is not financial advice. It is recommended to monitor the markets and carefully analyze the data before making any investment decisions.

GOLD USDHI GUYS.
H4 CHART here we see on going buys for sculppers and scul [ping sells around the coner.
forcus on the big pictucture more distance more pips as soon as h4 ,h2,h1 forms a (DB)
DOUBLE BOTTOM then we make entries on long position buys to clear upper area(3400,3439).

GOLD Will Move Lower! Sell!
Here is our detailed technical review for GOLD.
Time Frame: 9h
Current Trend: Bearish
Sentiment: Overbought (based on 7-period RSI)
Forecast: Bearish
The market is testing a major horizontal structure 3,337.68.
Taking into consideration the structure & trend analysis, I believe that the market will reach 3,280.02 level soon.
P.S
The term oversold refers to a condition where an asset has traded lower in price and has the potential for a price bounce.
Overbought refers to market scenarios where the instrument is traded considerably higher than its fair value. Overvaluation is caused by market sentiments when there is positive news.
Disclosure: I am part of Trade Nation's Influencer program and receive a monthly fee for using their TradingView charts in my analysis.
Like and subscribe and comment my ideas if you enjoy them!

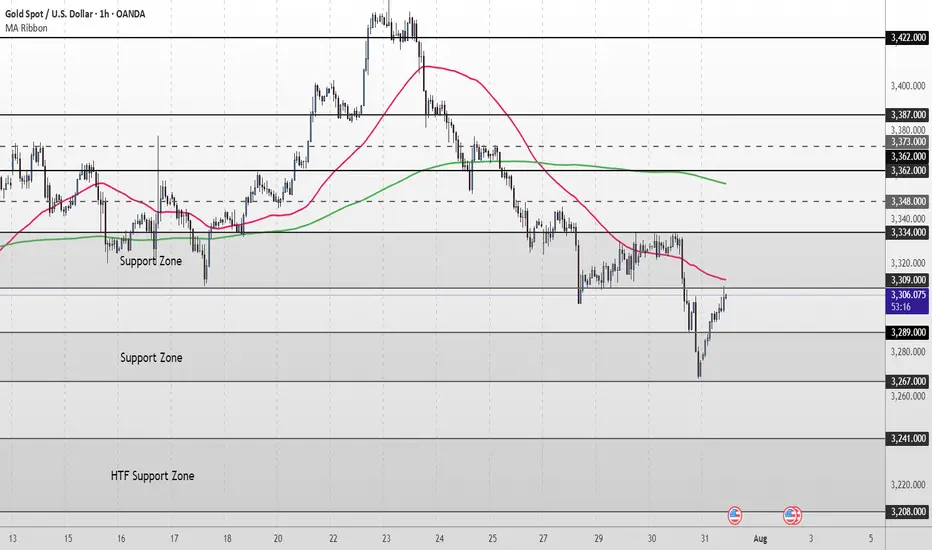
XAU/USD Intraday Plan | Support & Resistance to WatchGold staged a minor recovery overnight after bouncing from the 3,267 Support Zone, and is now trading around 3,305. Price remains below both the 50MA and 200MA, which continue to slope downward—confirming short-term bearish structure.
This current move is still corrective unless bulls manage to reclaim the 3,309–3,334 resistance zone. A clean break and hold above 3,334 would be the first sign of strength, opening up potential retests of 3,348 and 3,362.
Until then, any rallies into the 3,309–3,334 zone should be viewed with caution. If the bounce loses steam, watch for a retest of 3,289 - 3,267. A break below that would expose the 3,241 and 3,208 levels, with the HTF Support Zone (3,241–3,208) acting as a broader downside cushion.
📌 Key Levels to Watch
Resistance:
‣ 3,309
‣ 3,334
‣ 3,348
‣ 3,362
Support:
‣ 3,289
‣ 3,267
‣ 3,241
‣ 3,208
🔍 Fundamental Focus – Thursday, July 31
Big day for data.
🟥 Core PCE, Employment Cost Index, and Unemployment Claims — all critical for Fed outlook and could move gold sharply.
⚠️ Volatility expected around 2:30pm. Stay nimble and manage risk carefully.
GOLD (XAUUSD) Short IdeaGold is in consolidation right now. Possible break below and fall until 3285.
Good Luck!

MACRO CONTEXT & NEWS FLOW IMPACT — "WHY THE HELL IT MOVED"🔥 I. MACRO CONTEXT & NEWS FLOW IMPACT — "WHY THE HELL IT MOVED"
Yesterday’s move was a classic institutional fakeout followed by controlled accumulation. Today is retest day. Watch VWAP and order flow like a hawk. Don’t chase, wait for reversion and load at value.
📅 Date: July 30, 2025
📰 Event:
US Employment Cost Index: Lower than expected
Core PCE: Cooled off
Market Implication: Fed easing is now on the table.
DXY Weakens → Real yields drop → Gold gets bought like crazy.
👊 Institutional Logic:
Rate-sensitive assets (Gold, Bonds) exploded after the release.
Algorithmic reaction to macro signal: DXY down → XAU bid hard → MegaBar explosion.
BUT institutions needed liquidity to enter big → they faked a breakdown first.
That’s institutional deception 101.
📉 II. DAILY CHART ANALYSIS — THE BIG BOYS' GAMEBOARD
🗺️ Structure:
Price dropped from 3,355 to 3,258 in 3 days — a high-velocity markdown.
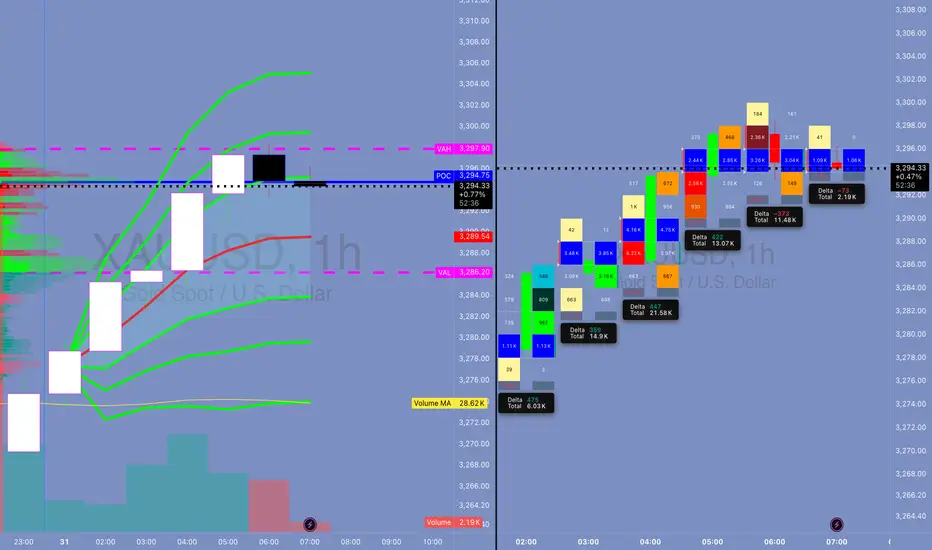
On July 30, Price printed a Megabar reversal (Massive range, delta-flush, volume spike).
VAH = 3,294.90 capped upside.
POC = 3,288.91, and VAL = 3,282.90 held beautifully.
🔍 Institutional Pattern:
This is a classic “Flush > Absorb > Mark-up” sequence.
Textbook from “Technical Analysis and Stock Market Profits”:
“Volume confirms intention, range confirms commitment. A wide bar with climax volume at low implies the exhaustion of sellers and transfer of ownership.”
🔑 Key Daily Stats:
📉 Delta Flush: -584K
🔁 Reversal Delta: +70K
🔊 Volume spike: >450K (Well above 30-day volume MA)
💡 Inference:
This bar did not print because of retail buying. It’s smart money rebuying from panic sellers.
⏱️ III. 4H / 1H TIMEFRAME: ORDERFLOW & REACCUMULATION
📌 4H Chart:
📍 Megabar with -191K delta near 3,258 (Volume: 191.14K)
Immediate absorption by dark blue and green delta bars — this was not retail reversal.
VWAP reversion in play — price gravitates toward 3,294 (VWAP anchor zone)
🔁 1H Chart:
Rapid stair-stepping: Each hourly candle had higher lows and strong deltas.
Volume built from super-POC 3,289 to super-VWAP 3,295.25.
Final hour: exhaustion wick → distribution into resistance.
🧠 Institutional Tactic:
They used Volume by Price congestion to hold price between FVRP bounds:
Low Volume Nodes (LVNs) = acceleration zones
High Volume Nodes (HVNs) = consolidation + absorption zones
🔍 IV. 15M / MICROSTRUCTURE — WHERE THE GAME WAS REALLY PLAYED
🔬 VWAP Stack Analysis:
VWAP: 3,294.61
D-VWAP: 3,289.30
Super-VWAP Cluster held price in check — real institutional price magnet.
🔄 Delta Flow (15m):
Delta climbed from -3.15K → +3.21K in 1.5 hours.
Imbalance flipped bullish near POC.
🎯 FPVR Mapping (Volume Profile Right Side):
Thickest distribution volume occurred at 3,287 – 3,295
Value tightly packed = fair price.
Institutions are loading in value, not chasing.
⚙️ V. INDICATOR & MOMENTUM SIGNALS — INSTITUTIONAL CONFLUENCE ZONES
Tool Signal
VWAP Anchored VWAP tagged and respected — classic institution level
SMA50 Capped daily move (3,342) — still a long-term bearish lid
HMA5/9 Bullish crossover on 15m/1H – signals momentum alignment
Volume MA Volume climax confirms effort at lows, signaling phase change
🔩 VI. TECHNICAL SEQUENCING OF EVENTS (STEP BY STEP)
Asia Session: Tight range, price floats around VAL (3,282)
London Session: Fake breakdown to 3,258 – traps late shorts
NY Pre-News: Choppy price action within FRVP range
Macro News Drop: Megabar → -191K delta flush
Next Candle: Delta flips +21.2K → Absorption confirmed
Price Walks Up: Controlled bid to VWAP
End of Day: Distribution at VAH → price capped by VWAP band
💣 Final move = algorithmic mean reversion + VWAP auction completion
🧬 VII. ADVANCED ORDERFLOW INTERPRETATION
⚔️ MEGABAR (The Trap Setup):
Volume = 191K+
Delta = -191K (yep, full-on flush)
What happened?
→ Late shorts + stop runs + SL hunters got rekt.
→ Institutions absorbed, switched algo, and reversed.
🧱 FVRP (Fair Value Range Profile):
Defined by VAL (3,282.90) and VAH (3,294.90)
Institutions play inside this range for risk efficiency
They accumulate low and distribute high within it
🔄 Delta Rotation:
Delta Rotation = Shift from Negative Accumulation → Positive Distribution
Classic rotation confirms phase transition
🧠 VIII. INSTITUTIONAL OBJECTIVE (WHAT THEY WANTED)
Primary Goal: Create liquidity void below → Enter large long positions
Secondary Goal: Return to VWAP zone and unload
Tertiary Goal: Signal to market: "We're in control, stay out or get punished"
This is textbook Volume Profile Auction Theory in motion.
🎯 IX. HYPOTHETICAL TRADE SETUP (EDUCATIONAL PURPOSE ONLY)
🧾 Trade Plan: Institutional VWAP Reversion Play
Order Type: Buy Limit
Entry: 3,287.00
Stop Loss: 3,279.00 (below VAL & invalidation)
Take Profit: 3,300.00 (Super-VAH zone)
Confidence: 85%
R/R: 1:1.6
💡 Justification:
Entry at POC + SMA50 cluster
Stop below structural invalidation zone
Target near major supply
This is the exact playbooks funds run during reaccumulation rotations
🧠 X. EDUCATIONAL TAKEAWAY — WHAT YOU SHOULD LEARN
Volume is truth. If volume spikes at lows, it’s not weak hands — it’s smart money flipping.
VWAP is magnet. Everything mean-reverts back to VWAP in controlled auctions.
Delta tracks aggression. Sharp delta reversals = algorithm switch.
Megabar = signal. Huge candle + volume + delta = possible phase shift.
FRVP = roadmap. Price doesn’t move randomly — it moves to balance imbalances.
🔚 CONCLUSION — YESTERDAY’S LESSON
July 30, 2025 wasn’t just a bullish day — it was a textbook institutional deception-reversion cycle. If you understand:
How the news was used
How the megabar printed
How the volume clustered
How the VWAP held
… then you’re not trading blindly.
You’re trading with the damn architects of the market.
gold has reach daily supportMomentum is still bearish however selling low is not advisable.
so there are certain point of interest that we want to look for as gold currently is at the support level. a strong one

Gold (XAUUSD) Breaks Trendline – Potential Downside Ahead?Gold (XAU/USD) has officially broken below a long-term ascending trendline on the 4H chart, indicating a potential shift in market structure. The recent breakout from a bear flag pattern confirms bearish momentum, and price is now approaching a key horizontal support zone around $3,249 and $3,242.
🔹 Trendline support (now resistance) broken
🔹 Bear flag breakdown – strong bearish candle
🔹 Eyes on support levels: $3,249, $3,165, and possibly lower
🔹 Watch for a potential retest of the broken trendline for short opportunities
A clean break and close below $3,249 could open the door for further downside in the coming sessions. Trade cautiously and manage your risk!

XAUUSD BUY AND SELL LEVELSGold (XAUUSD) is currently showing key movement potential as it reacts to major levels. We are watching closely for price action near important support and resistance zones to identify the next trade setup.
📌 Stay alert for possible retracements or breakouts. Both buying and selling opportunities may arise depending on market reaction.
Trade with confirmation and always manage risk wisely.

Gold--sellWell, gold is having an interesting moment. It is currently correcting in a downtrend and is holding steady. I don't feel any strength in its trend. How far will it correct to the specified area?


GOLD: Bearish Continuation & Short Trade
GOLD
- Classic bearish pattern
- Our team expects retracement
SUGGESTED TRADE:
Swing Trade
Sell GOLD
Entry - 3331.7
Stop - 3334.0
Take - 3327.0
Our Risk - 1%
Start protection of your profits from lower levels
Disclosure: I am part of Trade Nation's Influencer program and receive a monthly fee for using their TradingView charts in my analysis.
❤️ Please, support our work with like & comment! ❤️

Gold Market Builds Momentum Toward 3358 Supply ZoneGold market continues to build momentum gradually, with price action targeting supply mitigation at 3358.
The duration of this stance depends on whether price can clear this zone decisively; failure may lead to short-term consolidation before the next stance.comment ,boost idea and follow for more informed decisions on gold market

Gold recently experienced a typical "suppression and release"Capital dynamics and sentiment modeling, found that the gold market has recently experienced a typical "suppression and release" type of reaction. After a period of sustained pressure on the emotional background, the dominant force of the short side began to weaken, and both long and short sentiment tends to be balanced, and the logic of gold as a safe-haven asset has been re-explored and recognized.
This type of trend is often non-explosive, but through the emotional layers of repair and structural slow reversal of the gradual unfolding. The current signal strength has reached the bearish threshold set by the system, with a certain operational feasibility.
It is recommended that traders try to follow up with a low percentage of positions, but still need to retain enough position space to cope with the possible continuation of fluctuations. The whole layout is mainly defensive and offensive, and it is appropriate to seek progress in a stable manner.

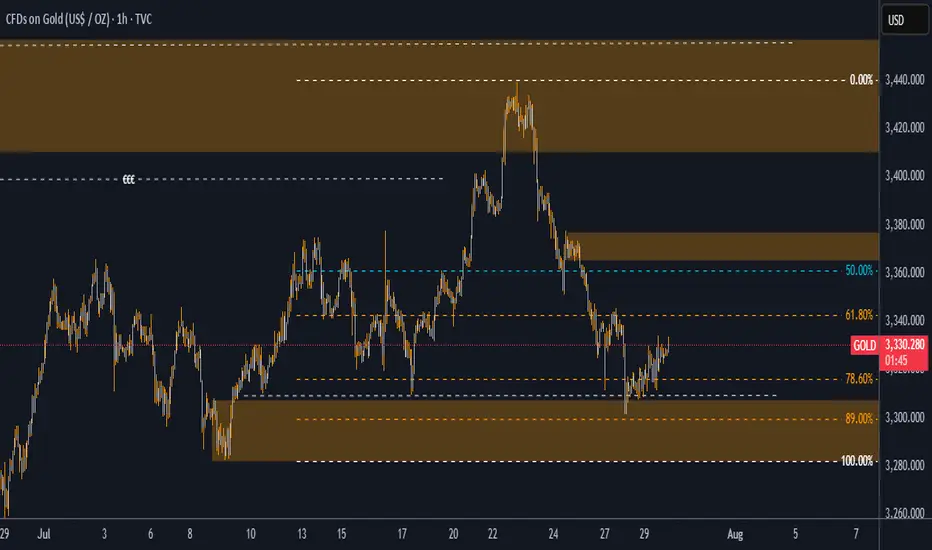
Gold (XAU/USD) – Technical UpdateDate: July 30, 2025
✅ Market Reaction Confirms the Forecast
In our previous analysis, we highlighted the $3,308–$3,315 region as a high-probability demand zone, reinforced by a deep retracement into the 89% Fibonacci level. We also pointed to a liquidity grab beneath $3,308 and projected a potential bullish reversal toward $3,345 and $3,398.
Today, price action has validated this view with precision.
✅ Price swept liquidity below $3,308 as expected, triggering a sharp rejection from our zone.
✅ A clear bounce followed, pushing price upward and confirming that large buyers stepped in—exactly where we anticipated.
✅ The structure is now shifting bullish, with price currently trading above $3,331, heading confidently toward our first target at $3,345.
📊 Why This Matters
This reaction was not random—it followed the logic laid out in the prior analysis:
-The demand zone was respected.
-The discounted pricing at 89% retracement offered maximum risk-reward.
-The internal imbalance between $3,345–$3,398 continues to act as a magnet, just as we outlined.
This is a textbook move where price hunted stops, tapped into demand, and began its upward drive—exactly as described in advance.
🎯 Targets Remain Valid
Target 1: $3,345 → Currently in progress. Price is gravitating toward this level, which also aligns with the 50% Fib retracement and minor supply.
Target 2: $3,398 → The final destination of this bullish move, completing the fill of the inefficiency left behind by the last drop.
🧠 Final Word
This is a strong confirmation of the original idea. The technical story has unfolded step by step as predicted, proving the reliability of the analysis. For traders following along, this not only reinforces confidence in the setup—but also showcases the power of disciplined, structure-based trading.
🔥 The move is unfolding exactly as projected. Patience, precision, and planning are now paying off.
consider like and follow so you don't miss any next analysis or update of the chart
you can ask me in the comment section