XAUUSD Intraday Signal Analysis – Gold Price Momentum & RSI SetuIn today’s 1-hour chart of XAUUSD (Gold vs USD), we observe a strong upward momentum supported by technical indicators, suggesting a well-defined bullish trend in the short term. Traders looking to capture short-term profits may find this chart setup especially favorable. Here's a breakdown of the price action and what it could mean for intraday traders.
Price Action Overview
The price of gold has surged past the $3,320 mark, showing a clear bullish breakout with a series of higher highs and higher lows. Currently, the market is trading near the $3,378 level, consolidating slightly after a strong upward movement.
The SMA 9 (Simple Moving Average) is providing dynamic support, curving upward and closely hugging the candlesticks. This is typically a sign that buyers are actively pushing the price higher and dips are being bought up quickly.
Additionally, the spread between the Buy ($3,378.78) and Sell ($3,378.51) prices is extremely narrow, suggesting tight liquidity and fast execution potential — ideal conditions for scalpers and short-term traders.
RSI Analysis
The RSI (Relative Strength Index) 14 is hovering around the 68–70 level, which traditionally indicates the asset is approaching overbought territory. However, it hasn’t crossed into the 70+ danger zone yet, which implies there could still be room for further upside.
One key observation is the RSI divergence forming on the right-hand side. While price has been climbing steadily, RSI has started to curve down slightly — this could hint at a minor pullback or consolidation phase before the next big move. Smart traders may consider watching for bullish RSI bounces or hidden divergences before re-entering long trades.
Trade Idea
Trend: Bullish
Support: $3,360 / $3,340
Resistance: $3,400 / $3,420
Signal: Wait for a minor pullback toward the SMA, and look for bullish candlestick confirmation near $3,360 before entering long.
Conclusion
This XAUUSD 1H chart presents a strong case for continued bullish momentum with cautious optimism due to RSI nearing overbought levels. A pullback could offer fresh entry opportunities before a push toward the next resistance zone. Intraday traders and swing traders alike can benefit from closely monitoring price action around the SMA 9 line.
XAUUSDK trade ideas

XAU/USD(20250805) Today's AnalysisMarket News:
Goldman Sachs: We expect the Federal Reserve to cut interest rates by 25 basis points three times starting in September; if the unemployment rate rises further, a 50 basis point cut is possible.
Technical Analysis:
Today's Buy/Sell Levels:
3367
Support and Resistance Levels:
3407
3392
3383
3352
3342
3328
Trading Strategy:
If the stock breaks above 3383, consider buying, with the first target price at 3392. If the stock breaks below 3367, consider selling, with the first target price at 3352.

GOLD Buyers In Panic! SELL!
My dear friends,
Please, find my technical outlook for GOLD below:
The instrument tests an important psychological level 3309.2
Technical Indicators: Supper Trend gives a precise Bearish signal, while Pivot Point HL predicts price changes and potential reversals in the market.
Target - 3296.9
Recommended Stop Loss - 3316.4
About Used Indicators:
Super-trend indicator is more useful in trending markets where there are clear uptrends and downtrends in price.
Disclosure: I am part of Trade Nation's Influencer program and receive a monthly fee for using their TradingView charts in my analysis.
———————————
WISH YOU ALL LUCK

XAUUSD (Gold) Intraday Trading Plan – Tuesday, 5th August 2025Timeframe: M15 (15-Minute)
Strategy Type: Intraday Buy-the-Dip (Scalp-to-Swing)
Market Bias: Bullish
Risk Profile: Short-Term Scalping with Staggered Exits
Execution Style: Multi-phase, Wait-and-Trigger Confirmation Strategy
🧠 Technical Market Overview
Gold remains firmly in a short-term uptrend structure with consistent higher lows and strong buyer momentum since the start of the month. The Asian session on Tuesday is expected to be quieter, creating room for controlled retracements before London and New York bring in volume.
Price is currently trading above key moving averages on the M15 chart (50 EMA and 200 EMA), showing bullish continuation. With market structure respecting rising channel patterns and Fibonacci retracement levels holding well, the day presents a clear opportunity to execute a ladder-style buying plan.
🔍 M15 Intraday Execution Plan
✅ Phase 1: Buy on Retracement to 3366 (Entry Zone)
Entry Zone: Around 3366
Reasoning:
3366 aligns with the 38.2% Fibonacci retracement of the prior M15 leg
A well-established support zone from previous breakout base
Strong volume and wick rejection in this zone from prior session
Confirmation:
Bullish engulfing, pin bar, or strong momentum candle on M15
RSI (14) bouncing above 40
Price rejection from 3365–3367 zone
Stop Loss:
Below 3359 (well below intraday structure)
🎯 Target 1: 3377
Why:
Local resistance from earlier M15 swing highs
Also represents a round number + intraday liquidity zone
High probability zone for first exit or reaction
Action:
Take partial profits (~40%)
Move SL to breakeven or trail below 3369
Wait for market to pull back for re-entry
✅ Phase 2: Wait for Pullback (After 3377 is Hit)
Retracement Zone: 3371–3373 (new higher low formation)
Entry Trigger:
Price consolidates or forms a small flag pattern
Clear bullish momentum on candle breakout
🎯 Target 2: 3387
Why:
Next resistance level based on Monday’s NY session high
Also coincides with extended fib target (1.272 level of 3366–3377 move)
Action:
Secure additional 30% profit
Move SL to 3376
Wait for next consolidation for final trade setup
✅ Phase 3: Final Entry After Consolidation Near 3380–3383
Reasoning:
Micro-pullback to a newly established support before last wave
Continuation pattern or breakout flag expected to form
🎯 Target 3: 3397
Why:
Psychological zone near 3400, commonly tested by algo-driven spikes
Key intraday liquidity magnet where large exits usually occur
Also aligns with the upper edge of projected intraday trend channel
Action:
Close all remaining positions
Watch for reversal signal or potential breakout to plan next session
⚠️ Risk Management Plan
Max exposure: 1–1.5% of capital, split across multiple entries
Each entry must have independent SL and TP
Never average down; add only after successful TP1
Close full position if price breaks below 3359 and closes below 50 EMA on M15
🔁 Summary Table
Phase Buy Level Target SL Action
Phase 1 3366 3377 3359 Take 40%, trail SL
Phase 2 3371–3373 3387 3366 Take 30%, trail SL
Phase 3 3380–3383 3397 3376 Take 30%, full close
📊 Technical Indicators to Support Plan
EMA 50 & EMA 200: Trend direction and pullback support
RSI (14): Momentum confirmation (ideal entry RSI: 40–50 bounce)
Volume Profile: Entry zones should align with HVN (High Volume Nodes)
🧭 Intraday Session Awareness
Asian Session: Look for slow grind or pullback toward 3366
London Open (3pm SG time): Likely volatility spike toward 3377
New York Open (8:30pm SG time): Possible momentum to 3387 or 3397
Avoid Entry During News Spikes: Especially US economic data

In-depth Analysis of the Gold Bull-Bear Game on August 4th:
I. Gold's Current Core Contradiction
Bull Support Factors
Weak non-farm payroll data reinforces expectations of a Fed rate cut, with the market betting on an over 80% probability of a September rate cut.
Risk Aversion: Although the tariff extension has not yet been finalized, the market remains concerned about escalating trade frictions, and gold is in high demand as a safe-haven asset.
Technical Breakout: Friday saw a strong breakout above the 3340-3350 resistance zone, with the daily chart showing a positive enveloping negative trend. Short-term bullish momentum prevails.
Potential Short-Term Opportunities
Monthly Top Signal: Consecutive high-level doji candlesticks with long upper shadows suggest medium-term selling pressure.
Fundamental Bearish Hidden Dangers:
The Fed's independence remains, and Powell may not cut interest rates prematurely due to pressure from Trump.
II. Key Technical Signals
1. Weekly Level: Range Unbroken
The 3268-3438 range persists, currently nearing its upper limit, so be wary of a pullback.
Bollinger Bands are converging, with the MA5/MA10 convergence signaling an approaching market reversal window.
2. Daily and short-term cycles: Overbought correction needs
After Friday's surge: 4-hour/1-hour RSI is overbought, the Bollinger Band opening is unsustainable, and a technical retracement is needed.
Key positions:
Resistance: 3376 (previous high) + 3385 (Fibonacci expansion level);
Support: 3340 (top and bottom conversion) + 3315 (bull defense line).
3. Triangle convergence pattern:
If it opens high and breaks through 3376 on Monday, August 4, it may test 3400; if it opens low and falls below 3340, it will look down to 3315-3280.
III. Operation strategy for next week on August 4
(1) Response to three opening scenarios
Scenario 1: Opening high (above 3370)
Strategy: Short in batches in the 3376-3385 area, stop loss at 3400, target 3340→3315.
Logic: Positive overdraft + technical overbought, betting on a pullback.
Scenario 2: Flat opening (around 3360)
Strategy: If the price rises from 3366 but does not break through, go short with a light position, stop loss at 3376, target 3340; if it falls below 3340, go short and look at 3315.
Alternative: If the support at 3340 is effective, go long, stop loss at 3330, target 3360.
Scenario 3: Low opening (below 3340)
Strategy: Go long in the 3338-3340 area, stop loss at 3325, target 3360; if it breaks through 3315, go short.
(2) Mid-term layout
Short opportunity: Go short in the 3385-3400 area, stop loss at 3420, target 3245 (monthly support).
Buy opportunity: If the price falls back to 3315-3280 at the beginning of the week and stabilizes, go long in the mid-term, stop loss at 3260, target 3400.
IV. Risks and Warnings
Beware of institutional manipulation: Friday's late-day surge may be a trap for buying; beware of a flash crash at Monday's opening.
Data disturbance: Pay close attention to the speeches of Fed officials. If inflation rebounds or hawkish remarks are made, it will be bearish for gold.
Undetermined trend: The market is still volatile and unilateral trends need to wait for confirmation of a breakthrough in the range.
Conclusion
Short-term: Prioritize shorting in the 3370-3385 area, and enter long positions in the 3340-3315 area when appropriate, maintaining strict stop-loss orders.
Mid-term: The monthly bearish pattern has not changed, and above 3385 is the ideal entry point for short positions.
Key Strategies: "Don't chase long positions during strong resistance; don't sell short during deep declines; follow the trend after a breakout; exercise caution in controlling the market."
XAUUSD:BUYThere is no need to worry about holding long orders mentioned last Friday. Gold prices continued to rise this week after a pullback. The price has risen to 3372. According to the research team of our swing trading analysis team, the bullish trend will continue.
Earlier I informed members that some buy orders were closed at high levels. At that time, the short-term high was around 3370. After closing the long orders, the price subsequently fell. This is the advantage of swing trading. You can use accurate trading signals to trade in batches in the short term, thereby creating opportunities for quick profits.
After the pullback, there is still good room for buying and opportunities.

Gold bullish breakout supported at 3308The Gold remains in a bullish trend, with recent price action showing signs of a continuation breakout within the broader uptrend.
Support Zone: 3308 – a key level from previous consolidation. Price is currently testing or approaching this level.
A bullish rebound from 3308 would confirm ongoing upside momentum, with potential targets at:
3387 – initial resistance
3400 – psychological and structural level
3435 – extended resistance on the longer-term chart
Bearish Scenario:
A confirmed break and daily close below 3308 would weaken the bullish outlook and suggest deeper downside risk toward:
3290 – minor support
3268 – stronger support and potential demand zone
Outlook:
Bullish bias remains intact while the Gold holds above 3308. A sustained break below this level could shift momentum to the downside in the short term.
This communication is for informational purposes only and should not be viewed as any form of recommendation as to a particular course of action or as investment advice. It is not intended as an offer or solicitation for the purchase or sale of any financial instrument or as an official confirmation of any transaction. Opinions, estimates and assumptions expressed herein are made as of the date of this communication and are subject to change without notice. This communication has been prepared based upon information, including market prices, data and other information, believed to be reliable; however, Trade Nation does not warrant its completeness or accuracy. All market prices and market data contained in or attached to this communication are indicative and subject to change without notice.
xau longnews on the tariff on swiss last friday, should still have a up ward movement.
wait for retest to enter this.
expecting bull flag strat, if triple top, exit the trade. or sl be
been very busy lately, also doing well with our copy trading, we also launched a smart plan copytrading service.
we have partnered with Blackbull markets to give the best spreads of roundtrip 5.5 usd.
see profile to get updated.

Gold: market is concerned, againThe previous week brought a bunch of important US macroeconomic data as well as the FOMC meeting, which all brought back some higher volatility on markets. The price of gold benefited from the uncertainties related to future economic developments under implemented trade tariffs, which have started to modestly reflect on the US economic data. The surprise came in jobs data on Friday, where non-farm payrolls added only 73K new jobs in July, which was significantly below expected 110K.
During the first half of the week, the price of gold was traded in a corrective way, reaching its lowest weekly level at $3.267. Still, Friday's surprising NFP data pushed the gold 2% higher, back to the level of $3.362, where the gold is closing the week. The RSI was pushed below the level of 50 during the first half of the week, however, the indicator ended the week at the level of 53. The MA50 slowed down its divergence from MA200, but the distance between the two lines is still high, in which sense, there is no indication of a potential cross.
In a week ahead there are no important US economic data scheduled for a release, in which sense, it could be expected that the market will use this time to fully reflect data from the previous week. Also, some short corrections in the price of gold are possible, which is usually after a strong shift toward one side. Some profit-takings could push the price of gold back toward the $3.320. The support line at $3,3K might also be shortly tested, but with lower probability. On the other hand, there is also probability for further push toward the upside, depending on investors’ perceptions of the future risks. It should not be overseen that currently the highest risks are coming from trade-tariff negotiations and settled deals. Any negative news regarding trade tariffs might easily push the price of gold higher from current levels.


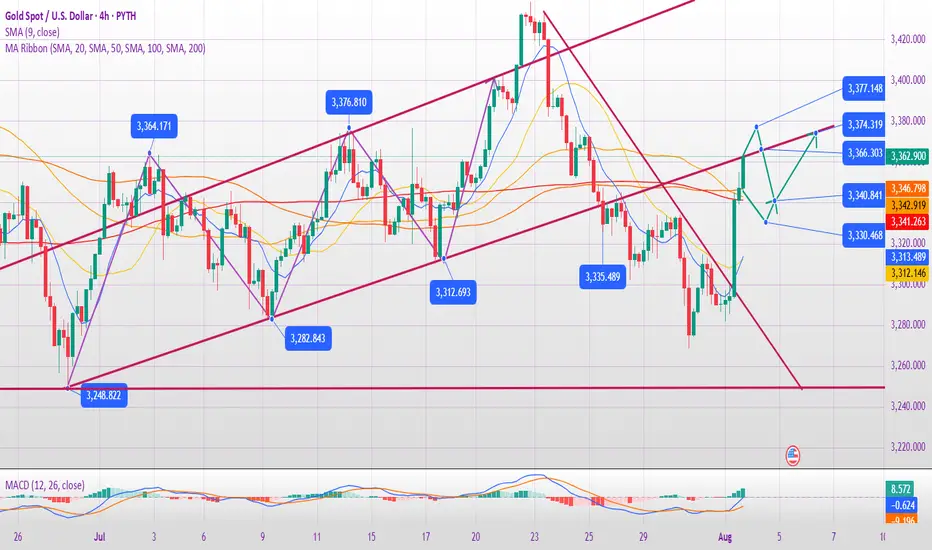
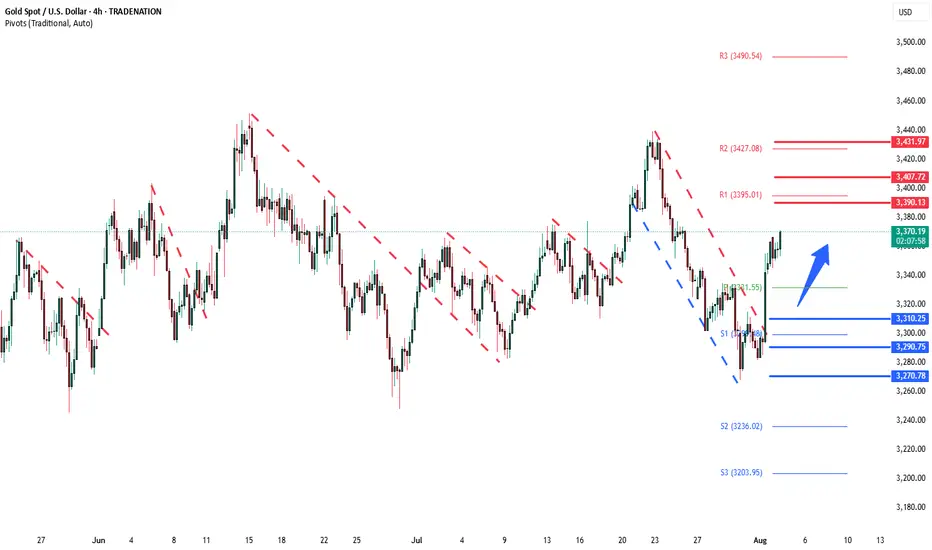
Gold Holds the Trendline - Eyes on the Range HighGold remains range-bound but is climbing off the range low with strong bullish momentum. Price is respecting the trendline and could stage a move toward the top of the range. A minor pullback may offer the best entry opportunity before momentum takes it higher. This setup favors buying the dip as long as the trendline holds.

Gold analysis and trading strategy for Monday✅ Fundamental Analysis
Friday’s Non-Farm Payrolls (NFP) data came in significantly below expectations, with new job additions falling far short of market forecasts. This sparked a sharp rise in expectations for a Fed rate cut later this year. As a result, the U.S. dollar index declined and gold prices surged violently, rallying from the 3281 level to a high of 3362 — a single-day gain of over $85, completely erasing the week's prior losses and reestablishing a strong bullish structure.
✅ Technical Analysis
📊 Weekly Chart
Gold posted a strong bullish weekly candlestick, reversing the previous consolidation trend and signaling a structural shift in market sentiment. Bulls have regained full control. The key resistance zone lies between 3380–3400; if price breaks and holds above this level, the next upside target will be around 3430.
📊 Daily Chart
Gold stabilized at the 3281 low and surged on Friday evening following the NFP surprise, closing near the day’s high — a sign of aggressive buying. The short-term trend has clearly reversed to the upside, and any pullback is now considered a buying opportunity. The key support has moved up to around 3335, serving as a critical pivot zone. Further support is seen near 3316, a previous swing low.
📊 Hourly Chart
Price is currently trading above short-term moving averages, indicating a strong bullish bias. The key level for a potential bullish continuation is around 3355, which represents a recent support-turned-resistance area. If price pulls back to this level and holds, or breaks above it directly, it will confirm bullish strength. If gold opens with a gap higher toward 3385, beware of potential short-term volatility due to a liquidity gap. Chasing highs in such scenarios requires caution.
🔴 Resistance Levels: 3375–3380 / 3400–3430
🟢 Support Levels: 3355–3340 / 3330–3335 / 3316
✅ Trading Strategy Reference
🔺 Primary Strategy – Buy on Dips:
🔰Consider long entries around 3340–3335, with a stop-loss below 3328.
🔰If the market remains strong, a direct long near 3355 is viable, targeting 3375 and above.
🔰A deeper pullback to 3330–3335 is a favorable entry zone for mid-term longs.
🔻 Secondary Strategy – Sell on Rebounds (Short-Term Only):
🔰If gold opens Monday with a sharp spike to around 3385 but fails to break higher, a light short position may be considered, targeting a quick $10–$15 pullback.
🔰If 3385 is broken and held, abandon short setups and revert to a bullish view.
✅ Overall Outlook
Gold has completed a technical reversal following the bullish fundamental catalyst from the NFP data. The trend has shifted from bearish to bullish, and the market has clearly moved into a higher price range. The core trading logic should remain “buy on dips”, and countertrend trades should be approached with caution. Look for long opportunities near key support levels, and consider short positions only at major resistance levels and for quick intraday trades. A confirmed breakout above 3375 will likely open the door to 3400–3430 in the near term

Gold looks like still having Bullish Momentum Based on current situation, XAUUSD looks like still having bullish momentum. looks at momentum candle, it like give early signal of next pole movement.
I just labelled two significant zone that I think, it is possible to create an edge. Even though, just wait for price action.

Gold Trade Plan 31/07/2025Dear Traders,
3304-3307 is very important area for Gold,
Pay close attention to the 3303-3307 zone. If you see a rejection in this area, you can enter a sell position.
if Fix above 3305------> 3351
IF Fix below 3305----->3267 (again)
Regards,
Alireza

Gold in the strong bullish momentum.WE will be expecting gold to con tinue its climb as NFP.
A sudden rejection is seen on 1st of Aug a good strong sign of bull coming in.
point is where to trade.
i personally expect for a pullback and point of interest for me for now nearest will be 3345 next 3330 lastly 3310-14.
where can we expect gold to climb up to.
first pitstop will be 3391-3403 and next 3465-87.
all the best traders.

Gold (XAU/USD) in Symmetrical Triangle – Short‑Term Squeeze,Price Structure & Technical Setup
Gold is consolidating within a symmetrical triangle, showing lower highs and higher lows—a classic precursor to breakout in either direction
Fxglory Ltd
+5
TradingView
+5
Babypips.com
+5
TradingView
+2
Babypips.com
+2
TradingView
+2
.
Trendlines converge tightly around $3,326–$3,334, hinting at imminent directional acceleration
Investopedia
+4
TradingView
+4
TradingView
+4
.
🎯 Key Levels & Targets
Scenario Trigger Confirm Area Targets Stop Loss
Bullish Breakout above $3,344–$3,350 $3,369 → $3,396 → $3,422–$3,550 ~$3,340
Bearish Breakdown below ~$3,326–$3,320 $3,320 → $3,300 → $3,297 → $3,255 ~$3,335–$3,340
A breakout above $3,344–$3,350 validated with volume may drive prices toward $3,400+, with extended targets up to $3,550 or higher in bullish conditions
Traders Union
Time Price Research
.
A drop below $3,326–$3,320 risks further decline, targeting $3,300, $3,297, and eventually $3,255 if breakdown momentum builds .
📉 Market Context & Drivers
U.S. dollar strength, easing safe-haven demand, and optimistic trade sentiment are constraining gold’s upside unless breakout forces emerge .
Key upcoming catalysts: FOMC guidance, U.S. macro data (GDP, inflation), and geopolitical developments—their tone could tip the bias direction .
⚙️ Trade Rules & Risk Management
Wait for a confirmed breakout or breakdown—do not trade mid-range.
Confirm break with at least one close outside the triangle and rising volume .
Position sizing: Risk 1–2% per trade, adjust stop-loss to price structure ($8–$15 depending on volatility).
Take profits in stages: scale out at minor milestones (first targets), trail stop for extended targets.
Avoid chasing price within the middle of the triangle—risk/reward is unfavorable.
🧠 Why This Plan?
Follows textbook symmetrical triangle trading methodology: entry on breakout, stop beyond pattern opposite side, projection based on triangle height .
Aligns with broader outlook: bearish unless convincing upside breakout appears, consistent with analyst consensus hedging current bull exhaustion and wait‑and‑see on policy signals .
✅ Summary
Gold is coiling inside a tight triangle range near $3,326–$3,334, with breakout potential identified to either side:
Bullish breakout over $3,344–$3,350 targets up to $3,550 or beyond.
Bearish breakdown under $3,326–$3,320 risks slide towards $3,300–$3,255.
Wait for confirmation, apply disciplined risk controls, and let volume validate the move.

NFP data is positive, the bullish trend remains unchanged#XAUUSD
The current market, influenced by data such as NFP, remains bullish, even briefly pushing towards the 4H upper limit of 3350, reaching a high near 3354.📈
In the short term, gold still has upward momentum and could even reach the previous high resistance level near 3375.🐂
Currently, gold is undergoing a technical correction and needs to begin a pullback to accumulate more bullish momentum, giving traders who previously missed the opportunity to get on board.🚀
As resistance continues to rise, support below will also rise. 📊If gold retreats below 3335-3315, consider going long.📈
🚀 SELL 3335-3315
🚀 TP 3350-3375

XAUUSD Gold Trading Strategy August 1, 2025
Yesterday's trading session, gold prices recovered to the 3315 area and then continued to decrease to the 3281 area. Currently, gold prices are fluctuating quite unpredictably due to the impact of tariff news and investor confidence.
Basic news: The Federal Reserve FED continues to maintain the federal funds benchmark interest rate in the range of 4.25% - 4.50%, in line with policy since 2025. Chairman Powell did not give any signal about the next interest rate cut on September 16 - 17.
Technical analysis: After falling sharply to the 3269 area, gold prices are showing signs of recovery. In the current downtrend channel, there has been a higher bottom than the bottom at H1. We can see that if the bullish pattern at H1 is confirmed, combined with the reversal candlestick appearing at H4, the possibility of gold bouncing back to reach the resistance area of 3330, even 3350 is completely possible. In the weekend trading session, we will wait at the support zones to trade.
Important price zones today: 3280 - 3285 and 3269 - 3274.
Today's trading trend: BUY.
Recommended orders:
Plan 1: BUY XAUUSD zone 3283 - 3285
SL 3280
TP 3288 - 3300 - 3310 - 3330.
Plan 2: BUY XAUSD zone 3269 - 3271
SL 3266
TP 3274 - 3284 - 3300 - 3320.
Wish you a safe, favorable and profitable trading day.🥰🥰🥰🥰🥰

Gold: Are the Bulls Still Behind It?Ion Jauregui – Analyst at ActivTrades
Fundamental Analysis
In 2025, gold has appreciated around 27% year-to-date, reaching a peak of 33.37% at the end of April, driven by structural factors. Its strength is based on global de-dollarization, central bank purchases, persistent inflation, and expectations of real rate cuts in the U.S. Since real interest rates peaked in July 2023, gold has risen 74%, reinforcing its role as a hedge against monetary policy.
In addition, countries like China and Russia continue to accumulate gold as protection against the dollar and potential sanctions, supporting long-term structural demand. Diversifying with physical and financial gold (ETFs, mining stocks) is an increasingly common strategy in an environment of high debt, geopolitical tensions, and doubts about traditional safe-haven assets. A suggested allocation in a classic model portfolio could range between 10% and 25%, depending on the risk profile, in a typical equity-focused investment portfolio.
Technical Analysis
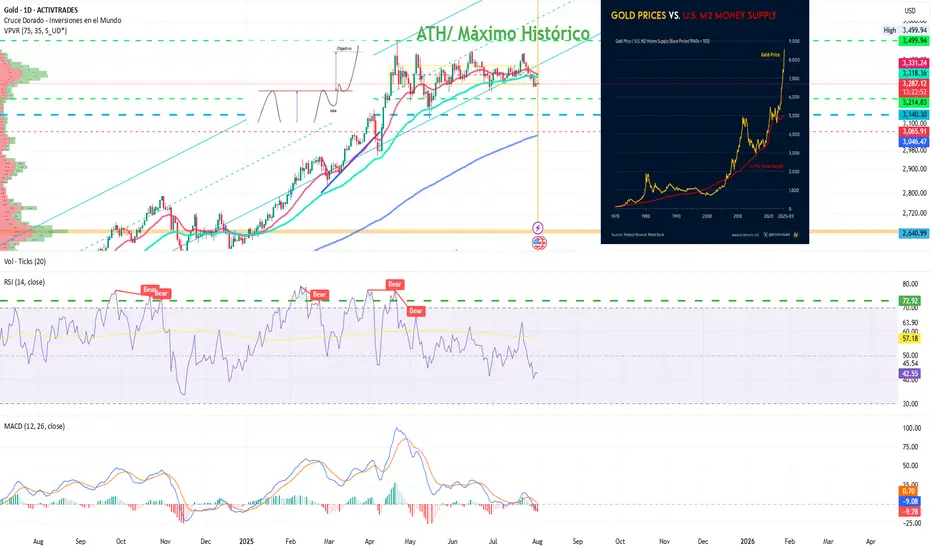
From a technical standpoint, gold has completed a long-term “cup with handle” formation that began in 2012, with an upside projection toward the $4,000 per ounce area. This pattern supports the continuation of its long-term upward structure.
In the short term, however, the price is in a consolidation phase after reaching all-time highs of $3,499.94 at the end of April. Since then, the lateral movement suggests a pause within the primary trend.
Technical indicators are showing mixed signals: RSI and MACD are pointing toward a possible oversold condition, suggesting a risk of short-term correction. Additionally, a bearish crossover between the 50-day and 100-day moving averages may reinforce selling pressure.
If this corrective scenario unfolds, gold could retrace toward a key support zone around $3,140, a level that has served as the base of the current range and where renewed buying interest could emerge.
Despite a possible pullback, the broader technical outlook remains constructive. Any correction would likely present tactical opportunities to re-enter the market—especially if expectations of real rate cuts or global geopolitical tensions persist.
Gold Consolidates After Highs
All in all, despite potential short-term pullbacks, gold continues to offer value as a tool for diversification, wealth protection, and a hedge against systemic risks. Its inclusion in portfolios remains relevant, even at current levels.
*******************************************************************************************
The information provided does not constitute investment research. The material has not been prepared in accordance with the legal requirements designed to promote the independence of investment research and such should be considered a marketing communication.
All information has been prepared by ActivTrades ("AT"). The information does not contain a record of AT's prices, or an offer of or solicitation for a transaction in any financial instrument. No representation or warranty is given as to the accuracy or completeness of this information.
Any material provided does not have regard to the specific investment objective and financial situation of any person who may receive it. Past performance and forecasting are not a synonym of a reliable indicator of future performance. AT provides an execution-only service. Consequently, any person acting on the information provided does so at their own risk. Political risk is unpredictable. Central bank actions can vary. Platform tools do not guarantee success.
Gold's Strong Moves: Will the Bears Take Over?Hello everyone, Kevinn here!
Today, gold continues to experience significant fluctuations in the new week, with XAU/USD currently hovering around 3,325 USD. Amid the strong rise of the USD, the gold market has seen a sharp adjustment. However, the medium-term trend still seems to favor the bears.
The main reason for the turbulence in gold prices is the strengthening of the U.S. dollar, following strong economic news from the U.S. that points to a clear recovery. The stronger USD has made gold more expensive for international investors. Additionally, the market is awaiting further moves from the Fed regarding interest rate policies, which is limiting the flow of capital into gold.
Looking at the technical chart, we can see that although gold has shown a slight uptick, bearish pressures are still lurking. Indicators and patterns suggest that gold may break its rising price channel, with a high likelihood of further declines. The next support level could be around 3,310 USD, and if broken, gold may continue to fall toward 3,300 USD or lower.
Based on the signals from the chart, ENTRY 1 strategy would be to sell when the price breaks the upward channel. Additionally, if the price pulls back to the upper limit zone, ENTRY 2 could present another potential selling point.
For today's strategy, I expect gold to decrease. What do you think? Share your thoughts in the comments!

XAUUSD GOLD BUYS Gold hit all take profits and now will be taking more trades into the correct direction for the rest of the trend , keep the trading simple and straightforward

GOLD (XAUUSD): Road to 3430
Quick update for my yesterday's analysis for Gold.
The price broke through the trend line with a local Break of Structre BoS,
updating an intraday-high.
The road to 3430 is now empty, and the market will most likely
continue rising steadily to that.
❤️Please, support my work with like, thank you!❤️
I am part of Trade Nation's Influencer program and receive a monthly fee for using their TradingView charts in my analysis.

GOLD | Consolidation Gold is moving between a range and most probably will give a upside breakout.Once a breakout is given the then the next target is its last top.
