XAU/USD 29 July 2025 Intraday AnalysisH4 Analysis:
-> Swing: Bullish.
-> Internal: Bullish.
You will note that price has targeted weak internal high on three separate occasions which has now formed a triple top, this is a bearish reversal pattern and proving this zone is a strong supply level. This is in-line with HTF bearish pullback phase.
Remainder of analysis and bias remains the same as analysis dated 23 April 2025.
Price has now printed a bearish CHoCH according to my analysis yesterday.
Price is now trading within an established internal range.
Intraday Expectation:
Price to trade down to either discount of internal 50% EQ, or H4 demand zone before targeting weak internal high priced at 3,500.200.
Note:
The Federal Reserve’s sustained dovish stance, coupled with ongoing geopolitical uncertainties, is likely to prolong heightened volatility in the gold market. Given this elevated risk environment, traders should exercise caution and recalibrate risk management strategies to navigate potential price fluctuations effectively.
Additionally, gold pricing remains sensitive to broader macroeconomic developments, including policy decisions under President Trump. Shifts in geopolitical strategy and economic directives could further amplify uncertainty, contributing to market repricing dynamics.
H4 Chart:
M15 Analysis:
-> Swing: Bullish.
-> Internal: Bullish.
H4 Timeframe - Price has failed to target weak internal high, therefore, it would not be unrealistic if price printed a bearish iBOS.
The remainder of my analysis shall remain the same as analysis dated 13 June 2025, apart from target price.
As per my analysis dated 22 May 2025 whereby I mentioned price can be seen to be reacting at discount of 50% EQ on H4 timeframe, therefore, it is a viable alternative that price could potentially print a bullish iBOS on M15 timeframe despite internal structure being bearish.
Price has printed a bullish iBOS followed by a bearish CHoCH, which indicates, but does not confirm, bearish pullback phase initiation. I will however continue to monitor, with respect to depth of pullback.
Intraday Expectation:
Price to continue bearish, react at either M15 supply zone, or discount of 50% internal EQ before targeting weak internal high priced at 3,451.375.
Note:
Gold remains highly volatile amid the Federal Reserve's continued dovish stance, persistent and escalating geopolitical uncertainties. Traders should implement robust risk management strategies and remain vigilant, as price swings may become more pronounced in this elevated volatility environment.
Additionally, President Trump’s recent tariff announcements are expected to further amplify market turbulence, potentially triggering sharp price fluctuations and whipsaws.
M15 Chart:
XAUUSDK trade ideas


BOS into Downtrend I think price is going down to the higher level support to sweep liquidity and go back to continue into the uptrend

3300 may fall below, possibly setting a new low#XAUUSD
From the daily chart perspective, gold has a tendency to form a converging triangle, and observing the technical indicators of the daily chart, the downward trend may have just begun📉.
So, how should we plan for the evening?📊 Now there are certainly many outside buyers who will continue to increase their positions and try to recover their losses💰. So, should we continue to be long?📈 My opinion is to wait and see.👀 If the daily chart does not fall below 3300 points, it will consolidate between 3300 and 3350 points in the future. If it falls below 3300 points, we will next focus on the support level of 3295-3285 points, and then consider whether to go long🤔.
If you are more aggressive, you can consider going long near 3305 points and exit after earning $10-20. All opinions have been informed and everyone can choose to adopt them according to their own circumstances.😄

Gold price final game: 3300Gold price final game: 3300
Today's gold price is on the verge of collapse, but the direction divergence still exists, with long and short intertwined.
Pay attention to the 3300 support.
The entire triangle convergence and oscillation pattern has been broken, and the important support platform before 3330 points has been broken.
Regardless of how the policy is announced,
shorting is inevitable.
Next, the bulls will enter the final bottom-picking stage:
Buy: 3300-3310
Stop loss: 3290
Target: 3330-3340+
Technical analysis:
Short-term support level: 3300
Short-term resistance level: 3330-3345
Market sentiment: The gold market sentiment presents a pattern of long and short intertwined and weak volatility.
In the short term, pay attention to the $3300 support level and the Fed's interest rate cut policy signal.
If the Fed turns to interest rate cuts or geopolitical conflicts escalate, gold may resume its upward trend.
Daily operation suggestions:
Long-term thinking: Bottom-picking thinking: Bottom-picking range: 3300-3310
Stop loss: 3290
Target: 3330-3345+
Short-term thinking: Trend-following thinking: High-altitude range: 3320-3330
Stop loss: 3345
Target: 3300-3280-3250
Final game of gold price: 3300
Today's gold price is on the verge of collapse, but the direction divergence still exists, and long and short positions are intertwined.
Pay attention to the 3300 support.
The entire triangle convergence and oscillation pattern has been broken, and the important support platform before 3330 points has been broken.
Regardless of how the policy is announced,
shorting is inevitable.
Next, the bulls will enter the final bottom-picking stage:
Buy: 3300-3310
Stop loss: 3290
Target: 3330-3340+
Technical analysis:
Short-term support: 3300
Short-term resistance: 3330-3345
Market sentiment: The gold market sentiment shows a pattern of mixed long and short positions and weak volatility.
In the short term, pay attention to the $3,300 support level and the Fed's interest rate cut policy signal.
If the Fed turns to interest rate cuts or geopolitical conflicts escalate, gold may resume its upward trend.
Daily operation suggestions:
Long-term thinking: bottom-picking thinking: bottom-picking range: 3300-3310
Stop loss: 3290
Target: 3330-3345+
Short-term thinking: trend-following thinking: high-altitude range: 3320-3330
Stop loss: 3345
Target: 3300-3280-3250
Report - 28 jully, 2025Executive Summary
In a historic move to defuse transatlantic trade tensions, the United States and the European Union have struck a landmark agreement imposing a 15% blanket tariff on EU goods. The deal, brokered between President Trump and EC President Ursula von der Leyen, includes sweeping European commitments to increase purchases of American energy and military equipment—amounting to more than $1.35 trillion. This not only averts a trade war but realigns fiscal, defense, and industrial policy across the Atlantic. Meanwhile, Germany will escape EU sanction for deficit overruns due to elevated defense spending, and China has intensified its diplomatic push to lead AI governance, openly challenging U.S. technological hegemony.
These developments unfold amid a broader recalibration of global capital flows, with Chinese investors pouring record funds into Hong Kong equities, Brazil doubling down on BRICS despite tariff threats, and private equity investors increasingly opting for liquidity over continuation vehicles. All these signals point to a shifting world order, where economic fragmentation, tech rivalry, and military investment dominate the strategic calculus.
Market Reactions
Markets have reacted with cautious optimism. The resolution of the US-EU dispute has removed one of the most immediate risks to global trade, stabilizing risk sentiment. Equities across developed markets are firmer, while defense, energy, and industrial stocks in the U.S. have caught a fresh bid. European auto and export sectors remain under scrutiny given the tariff imposition, despite the broader stability.
The dollar softened slightly on expectations that the trade deal will reduce the likelihood of retaliatory disruptions, even as tensions over chip tariffs and Brazil’s alignment with BRICS persist. Gold briefly rallied but then settled as inflation expectations were tempered by diplomatic de-escalation. Oil prices remain subdued as demand signals remain weak despite energy reordering.
Fiscal and Political Implications
The US-EU agreement marks a major geopolitical win for Trump. The EU's commitment to spend $750 billion on U.S. energy and $600 billion on military procurement illustrates a fundamental pivot in the bloc’s external policy alignment. Politically, this underscores Washington’s ability to extract economic concessions under threat of tariffs—further validating Trump’s unilateralist negotiation style.
Germany’s exemption from EU deficit procedures further highlights Brussels’ strategic flexibility in an era where defense is taking precedence over fiscal austerity. Berlin will be allowed to run a deficit of 3.3% of GDP in 2025, thanks to a “national escape clause” invoked to cover expanded defense spending. This sets a precedent for other member states to follow suit, potentially unleashing a wave of fiscally supported rearmament across the EU.
Meanwhile, China's unveiling of a 13-point AI governance plan signals an emerging regulatory bifurcation in global technology. The push for a UN-backed AI governance body—and the positioning of its open-source models for Global South collaboration—challenges U.S. regulatory primacy and may spark a new front in the AI cold war.
Strategic Forecasts
The medium-term outlook is increasingly defined by strategic spending, tech sovereignty, and the weaponization of trade. The U.S. will likely continue to deploy tariffs not just for balance-of-trade concerns, but also to enforce strategic compliance. This tactic will carry mixed implications for global markets: inflationary near-term, but ultimately supportive of U.S. industrial and defense equities.
Europe’s gradual pivot toward U.S. alignment will create internal friction, especially among member states hesitant to cede strategic autonomy. At the same time, China’s AI diplomacy and Brazil’s defiance of U.S. tariffs will continue to fragment global consensus, creating an increasingly multipolar and protectionist macro environment.
Continued uncertainty around the Federal Reserve’s independence—as Trump ramps up pressure on Powell—will contribute to short-term volatility in bond and currency markets. The likelihood of delayed rate cuts or a politically forced pivot is increasing.
Risks and Opportunities
Risks include renewed tariff escalations, especially targeting tech, chips, and Brazil. Europe’s fiscal leniency could spook bond markets if perceived as unsustainable. In private equity, continuation vehicle fatigue risks forcing markdowns across illiquid portfolios.
Opportunities emerge in defense, energy, and AI-linked equities. The U.S. stands to benefit from a surge in industrial demand, while Chinese tech firms could capitalize on regulatory arbitrage in emerging markets. Open-source AI adoption will favor hardware and semiconductor exporters, particularly in Asia.
Asset Impact Analysis
Gold (XAUUSD):
Gold showed initial strength on trade fears but retraced as the deal lowered immediate inflation risk. With Powell’s position under political threat and long-term fiscal expansion in play, the bullish bias remains intact. Expect gold to test $3,400 in Q3 if Fed guidance shifts dovishly. Near-term support lies at $3,300.
S&P 500 (SPX):
Markets welcomed the trade clarity and defense spending surge. Industrials, defense, and energy are clear beneficiaries, while tech gains from relaxed macro pressure. Continued pressure on Powell could add volatility.
Dow Jones (DJIA):
Dividend-heavy Dow components in defense and manufacturing are poised to outperform. Trade normalization and fiscal leniency in Europe favor global cyclicals.
USDJPY:
With Japanese inflation slightly below forecast and the BoJ still cautious, yen strength is capped. U.S. political drama may induce mild USD weakness but not enough to break 145 convincingly.
DXY (US Dollar Index):
The dollar may weaken modestly as tariff resolution reduces safe-haven demand and the Fed comes under pressure to cut. A break below 103.00 would confirm a bearish turn.
Crude Oil (WTI):
Oil remains stuck in a neutral range. Although the EU will buy more U.S. energy, weak demand signals and lackluster PMI data keep prices rangebound. A breakout above $72 requires more forceful geopolitical tension.

gold is in the range of 3440-3325gold is still in formation of penant in the higher time frame and currently has just given a sign of bullish after the 3 days bearish.
certain key levels to look out for.
3325, 3347, 3365, 3373,3393, 3402.
still sideways.

"GOLD Bandit Strategy: Loot Pips Like a Pro!🏆 GOLD HEIST ALERT! 🏆 XAU/USD Bandit Strategy (Swing/Day Trade)
Steal Pips Like a Pro! 💰🔓 Bull vs. Bear Raid Plan
🌟 Greetings, Market Pirates! 🌟
"The trend is your accomplice—time to loot!"
🔮 Thief’s Technical & Fundamental Intel:
XAU/USD (The Gold Vault) is flashing BEARISH signals, but we’re ready to raid both sides! Follow the heist blueprint below 👇
🎯 ENRY POINTS (Where to Strike!)
🏴☠️ LONG RAID (Bullish Thieves):
Break & Grab: Enter above 3450.00 (Pullback Zone)
"Wait for the breakout, then ambush!"
🐻 SHORT RAID (Bearish Bandits):
Sneak Attack 1: Sell below 3300.00
Sneak Attack 2: Sell below 3260.00 (Support Wall Cracked!)
🛑 STOP-LOSS (Escape Routes)
Bullish Trade: SL at 3230.00 (Guard your loot!)
Bearish Trade 1: SL at 3360.00 (Don’t get caught!)
Bearish Trade 2: SL at 3280.00 (Risk = Reward!)
(Adjust SL based on your risk appetite & lot size!)
💰 TAKE-PROFIT (Cash Out & Flee!)
Bullish Thieves: TP at 3270.00 (Or escape early!)
Bearish Bandits (1): TP at 3270.00
Bearish Bandits (2): TP at 3210.00 (Big score!)
⚠️ WARNING: Market Traps Ahead!
News = Danger Zone! 📢 Avoid new trades during high-impact news.
Trailing SL = Your Getaway Car! Lock profits & evade reversals.
📰 FUNDAMENTAL BACKUP (Why This Heist Works)
Bearish momentum fueled by macro trends, COT data, & sentiment.
Stay sharp—markets shift fast!
💥 BOOST THIS HEIST! 💥
Like & Share to strengthen our pirate crew! 🚀 More alerts = More profits!
🚨 Next Heist Coming Soon… Stay Tuned! 🚨

Gold at Key Support – Will Bulls Step In or Drop Continue?🌐 Market Overview
Gold has struggled to recover after yesterday's sharp drop, driven by macro-political concerns and profit-taking at recent highs.
🔻 On July 24, former President Trump made an unexpected visit to the US Federal Reserve, sparking speculation that he's pressuring the Fed to cut interest rates soon.
While the Fed has yet to make any dovish moves, short-term bond yields dipped slightly, showing growing market expectations for policy easing.
The US dollar remains strong, reflecting some skepticism around the Fed’s possible shift despite recent economic strength.
📉 Technical Outlook
On the H2 chart, gold still maintains an overall bullish structure. However, it's approaching a critical support level near 3338, which aligns with the VPOC and the ascending trendline.
📌 If this zone breaks, price may rapidly fall toward deeper liquidity zones in the 332x – 329x range.
🎯 Trade Setups
🔽 BUY SCALP (Quick Reaction Play)
Entry: 3338 – 3336
Stop Loss: 3332
Take Profit: 3342 – 3346 – 3350 – 3354 – 3360 – 3365 – 3370 – 3380
🟢 BUY ZONE (Deep Buy Area – Long-Term Potential)
Entry: 3312 – 3310
Stop Loss: 3305
Take Profit: 3316 – 3320 – 3325 – 3330 – 3340 – 3350 – 3360 – 3370 – 3380
🔻 SELL ZONE (if market retests)
Entry: 3374 – 3376
Stop Loss: 3380
Take Profit: 3370 – 3366 – 3360 – 3355 – 3350 – 3340 – 3330
🔍 Key Levels to Watch
Support: 3350 – 3338 – 3325 – 3310 – 3294
Resistance: 3374 – 3390 – 3400 – 3421
⚠️ Risk Note
As we head into the weekend, liquidity sweeps are common – especially on Fridays. Be cautious of sharp moves.
Focus mainly on scalp setups today. Avoid early long entries unless strong confirmation appears at lower liquidity zones.
Always follow your TP/SL strategy to protect your capital.

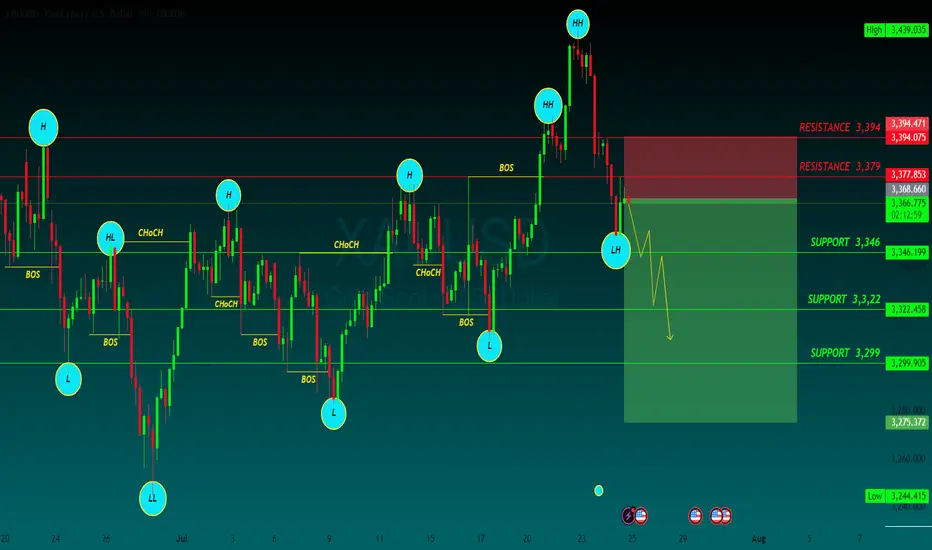
GOLD SELLGold price bears retain control amid fading safe-haven demand, rebounding USD
US President Donald Trump announced late Tuesday that his administration had reached a trade deal with Japan. Furthermore, reports that the US and the European Union are heading towards a 15% trade deal boost investors' confidence and weigh on the safe-haven Gold price for the second straight day on Thursday.
The markets do not expect an interest rate cut from the US Federal Reserve in July despite Trump's continuous push for lower borrowing costs. In fact, Trump has been attacking Fed Chair Jerome Powell personally over his stance on holding rates and repeatedly calling for the central bank chief's resignation.
Moreover, Fed Governor Chris Waller and Trump appointee Vice Chair for Supervision Michelle Bowman have advocated a rate reduction as soon as the next policy meeting on July 30. This keeps the US Dollar depressed near a two-and-a-half-week low and could offer some support to the non-yielding yellow metal.
Traders now look forward to the release of flash PMIs, which would provide a fresh insight into the global economic health and influence the safe-haven commodity. Apart from this, the crucial European Central Bank policy decision might infuse some volatility in the markets and drive the XAU/USD pair.
Meanwhile, the US economic docket features Weekly Initial Jobless Claims and New Home Sales data, which, in turn, would drive the USD and contribute to producing short-term trading opportunities around the commodity. Nevertheless, the fundamental backdrop warrants caution for aggressive traders.
SUPPORT 3,346
SUPPORT 3,322
SUPPORT 3,399
RESISTANCE 3,394
RESISTANCE 3,379
GOLD POSSIBLE SHORT (LT Buy Oriented)Things are starting to calm down. Gold might see a shift in demand and calm down.
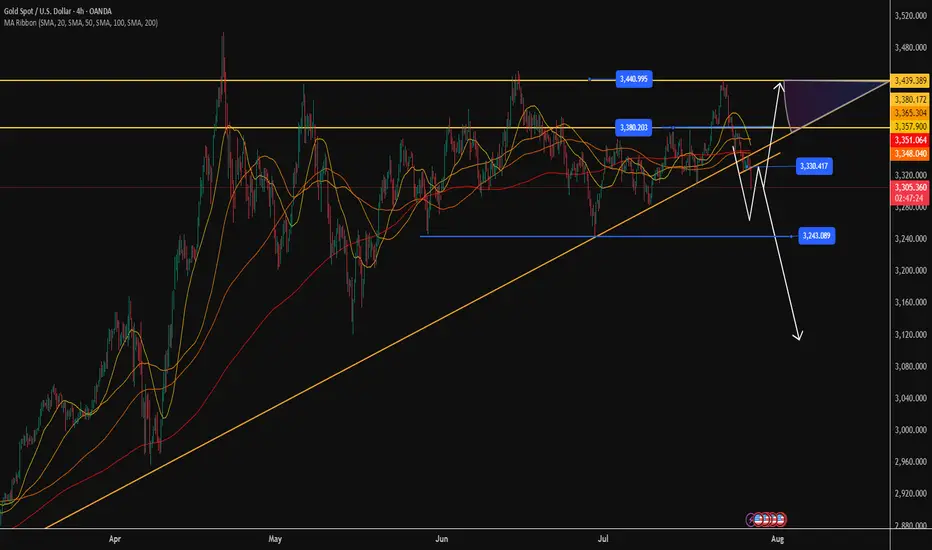
XAUUSD FORMING A CONTRACTING TRIANGLEXAUUSD is forming a contracting triangle which is much visual on the Daily T.F.
This is a continuation pattern.Since Wave 3 is completed,Wave 4 is forming a contracting triangle which is time consuming which can lead to permature trade entries or missed opportunities.
Best trade is to wait for the completion of Wave 4 at the 3055 level,which may push prices higher to the 3850 level a new high.

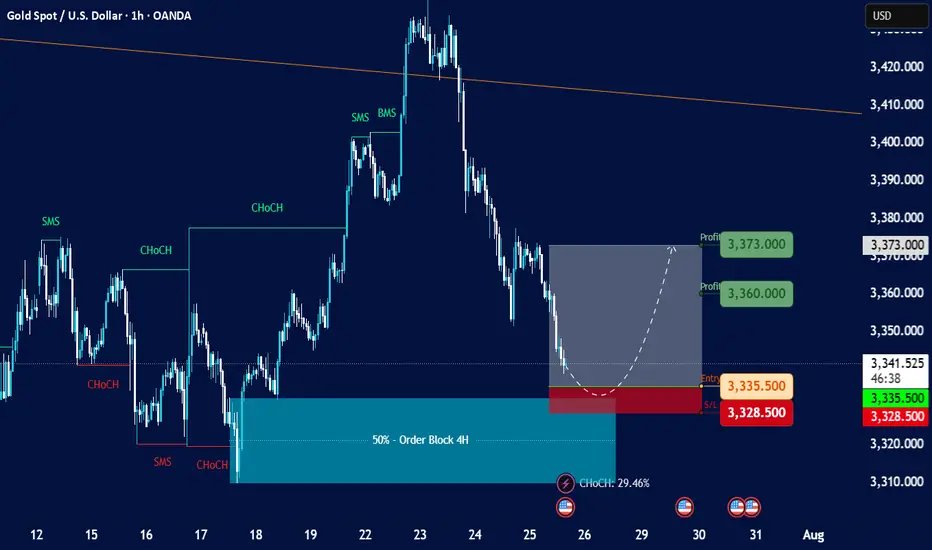
Gold Spot / U.S. Dollar (XAU/USD) with a 1-hour timeframeOverall Trend and Market Structure:
The chart displays a mix of bullish and bearish movements, but recent price action (from around July 23rd onwards) shows a significant downturn after a peak.
There are "SMS" (Structural Market Shift) and "ChoCH" (Change of Character) labels, indicating shifts in market structure. Initially, there were bullish shifts, but the recent price action suggests a potential bearish shift or at least a significant retracement.
A large "50% - Order Block 4H" is highlighted in blue, which acted as support and led to a strong upward move previously.
Current Price Action and Setup:
The current price is around 3,340.670.
There's a proposed short-term trading setup, indicated by:
Entry: 3,335.500 (red dashed line)
Stop Loss (SL): 3,328.500 (red shaded area)
Profit Targets (TP):
3,360.000 (green shaded area, "Profit 3,360.000")
3,373.000 (green shaded area, "Profit 3,373.000")
The setup is highlighted with a gray shaded area, indicating the potential path of price for this trade. It appears to be a long (buy) setup, anticipating a bounce from the current levels.
The "CHOCM: 29.46%" at the bottom suggests some kind of indicator or calculation related to market character.
Key Observations and Considerations:
Previous Bullish Momentum: The price rallied strongly after touching the "50% - Order Block 4H" around July 17-18, reaching a high near 3,430.
Recent Bearish Retracement: Since July 23rd, the price has pulled back significantly from its peak, almost revisiting the higher levels of the previous order block.
Potential Support: The proposed entry point for the long trade (3,335.500) is within a zone that previously acted as support or a level from which price bounced. It's also near the top of the "50% - Order Block 4H" area, suggesting this could be a retest or a bounce from a key support zone.
Risk-Reward: The setup shows a relatively tight stop loss compared to the potential profit targets, which is generally favorable for risk management.
Gold Market Shorts to 3370's, Eyes Pullback to 3400'sGold market initiates a short move down to 3370's, reacting to short-term resistance.
A pullback stance is now forming, targeting a potential retracement back through to the 3400's, follow for more insights , comment and boost idea

Gold 22 July 2025 updateGood afternoon, update to last week's post of 21 July on gold, which worked yesterday, new zone to buy, the chart shows everything in detail, so today with the message "brevity is the sister of talent"
#GOLD
BUY LIMIT ZONE 3365-3370
🎯 TP1: 3385
🎯 TP2: 3400
🎯 TP3: 3412
🎯 TP3: 3428
⛔️ Stop loss: 3355
Regards, Totoshka™

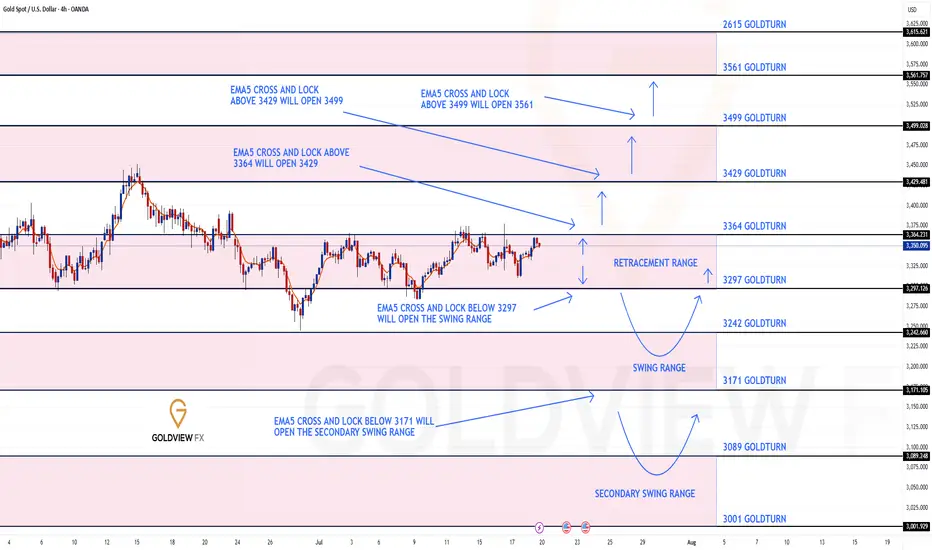
GOLD 4H CHART ROUTE MAP UPDATE & TRADING PLAN FOR THE WEEKHey Everyone,
Please see our updated 4h chart levels and targets for the coming week.
We are seeing price play between two weighted levels with a gap above at 3364 and a gap below at 3297. We will need to see ema5 cross and lock on either weighted level to determine the next range.
We will see levels tested side by side until one of the weighted levels break and lock to confirm direction for the next range.
We will keep the above in mind when taking buys from dips. Our updated levels and weighted levels will allow us to track the movement down and then catch bounces up.
We will continue to buy dips using our support levels taking 20 to 40 pips. As stated before each of our level structures give 20 to 40 pip bounces, which is enough for a nice entry and exit. If you back test the levels we shared every week for the past 24 months, you can see how effectively they were used to trade with or against short/mid term swings and trends.
The swing range give bigger bounces then our weighted levels that's the difference between weighted levels and swing ranges.
BULLISH TARGET
3364
EMA5 CROSS AND LOCK ABOVE 3364 WILL OPEN THE FOLLOWING BULLISH TARGETS
3429
EMA5 CROSS AND LOCK ABOVE 3429 WILL OPEN THE FOLLOWING BULLISH TARGET
3499
EMA5 CROSS AND LOCK ABOVE 3499 WILL OPEN THE FOLLOWING BULLISH TARGET
3561
BEARISH TARGETS
3297
EMA5 CROSS AND LOCK BELOW 3297 WILL OPEN THE SWING RANGE
3242
3171
EMA5 CROSS AND LOCK BELOW 3171 WILL OPEN THE SECONDARY SWING RANGE
3089
3001
As always, we will keep you all updated with regular updates throughout the week and how we manage the active ideas and setups. Thank you all for your likes, comments and follows, we really appreciate it!
Mr Gold
GoldViewFX
Welcome Back! Gold Trading Strategy & Key Zones to WatchIn this week’s welcome back video, I’m breaking down my updated approach to XAU/USD and how I plan to tackle the Gold markets in the coming days. After taking a short break, I’m back with fresh eyes and refined focus.
We’ll review current market structure, identify key liquidity zones, and outline the scenarios I’m watching for potential entries. Whether you’re day trading or swing trading gold, this breakdown will help you frame your week with clarity and confidence.
📌 Covered in this video:
My refreshed trading mindset after a break
Key support/resistance and liquidity zones
Market structure insights and setup conditions
What I’ll personally avoid this week
The “trap zones” that might catch retail traders off guard
🧠 Let’s focus on process over profits — welcome back, and let’s get to work.

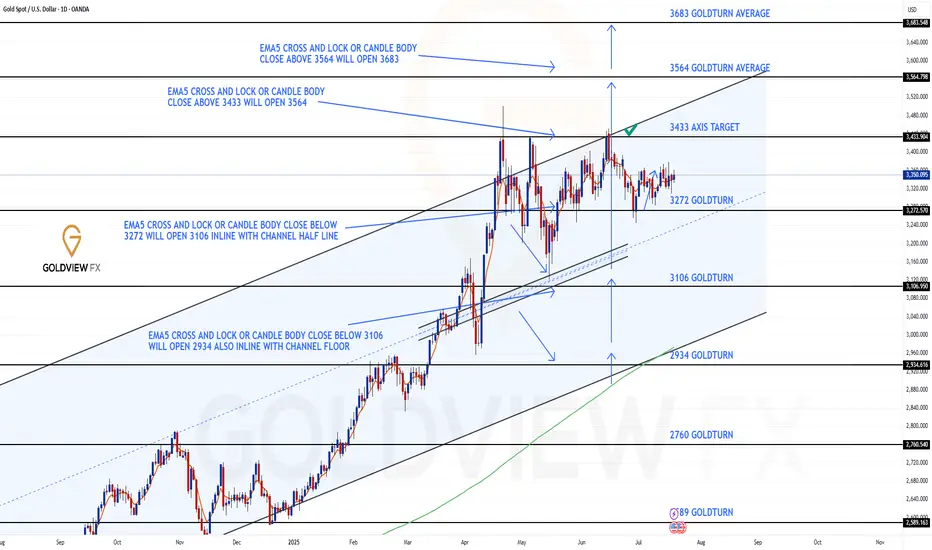
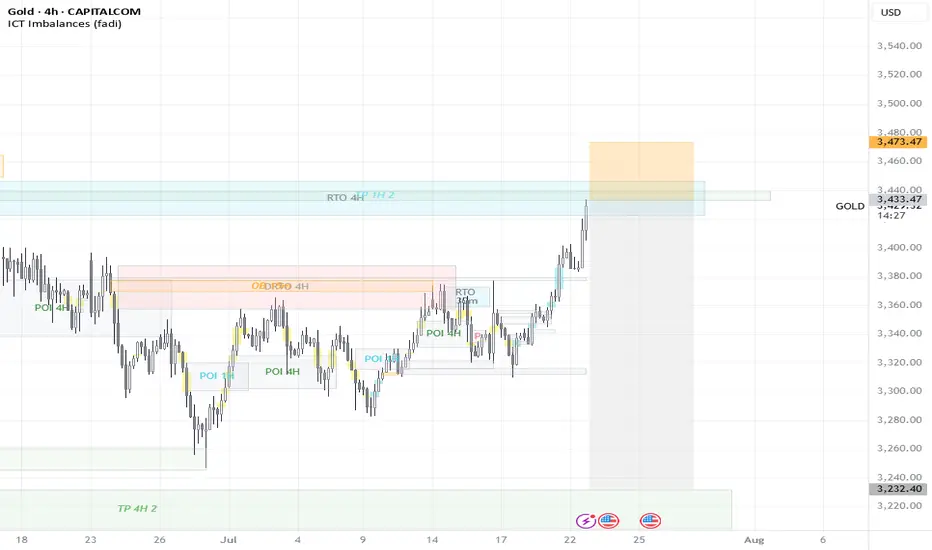
GOLD DAILY CHART ROUTE MAPHey Everyone,
Daily Chart Follow-Up – Structure Still in Full Control
Just a quick update on our daily structure roadmap. Price continues to respect our Goldturn levels with surgical precision.
After the previous bounce off 3272, we saw over 800 pips of upside follow through. That level once again proved its weight, holding beautifully as support and launching price firmly back toward the upper boundary.
Since last week’s update, nothing has changed structurally – the range remains intact and fully respected. Price is still trading between the well defined 3272 support and the untested 3433 resistance. We’ve yet to revisit 3433, which remains our key upside target and a potential inflection point.
Here’s what we’re focusing on next:
🔹 Range scenario active:
Until price breaks out cleanly, we anticipate continued swings between 3433 resistance and 3272 support. This remains the active range setup.
🔹 EMA5 cross and lock:
We’re still watching for a decisive EMA5 break and lock. Without that, we expect more range-bound action rather than a breakout.
🔹 Structure remains intact:
No EMA5 breakdown off 3272 during the recent retest means buyers are still in control. Dips into 3272 remain valid long entries within this structure.
Key Levels This Week
📉 Support – 3272
Proven bounce zone. Continues to hold structure. As long as this holds, the bias remains constructive.
📈 Resistance – 3433
Open gap + channel top confluence. Still untested. Watching for a reaction or breakout confirmation here.
Thanks again for all the continued support, your likes, comments, and follows mean the world.
Wishing you another focused and profitable week ahead!
Mr Gold
GoldViewFX
XAUUSD BUY LONG XAUUSD BUY LONG FROM BULLESH OBI
- In Daily TF Market will bullesh
- In H1 TF market is stell fully bullesh
- Market is in Daliy , H4 , H1 , M15 BISI
- In H1 & M15 MSS then our entry in OBI in LTF Valid MSS then our Entry target H1 Nearest Liquidity with Tight SL
tradE anD enjoY ......................................................
~~ KGB Priyabrat Behera ~~
~ ICT Trader & Advance Mapping SMC Trader ~

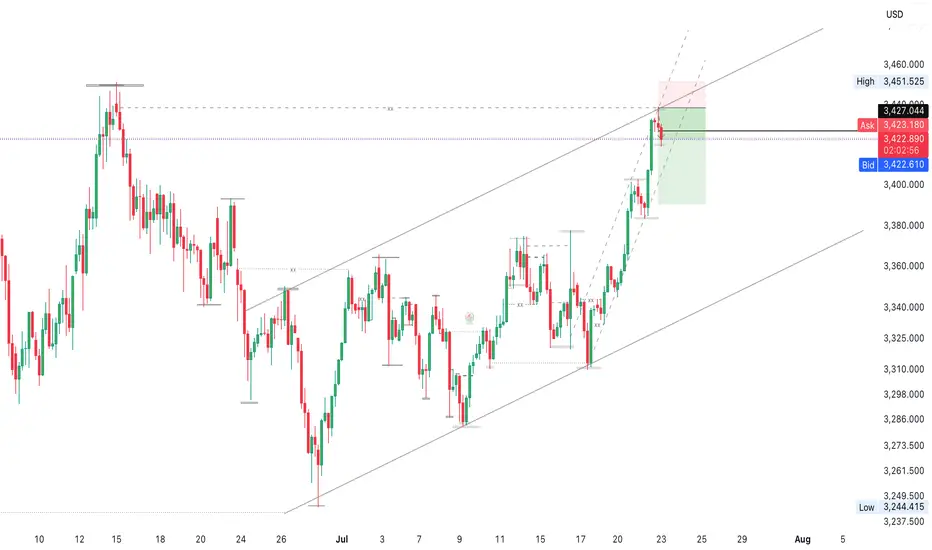
Gold Market Completes Bullish Wedge at 3439Gold market lures to 3439, completing the bullish wedge formation as anticipated.
A retracement is now setting in, with price action expected to sweep through 3391—a key zone that may determine the next leg of the trend.
Watch closely for confirmation at this level for a potential bullish continuation or deeper correction. follow for more insight , comment and boost idea
Correction in Play, Long-Term BUY Opportunity Ahead XAUUSD 24/07 – Correction in Play, Long-Term BUY Opportunity Ahead
🧭 Market Outlook
Gold has dropped sharply from the 343x region, exactly as outlined in yesterday’s plan. Price has broken below the ascending trendline on the H1 chart and is now tapping into lower liquidity zones (FVG + OBS), signaling continuation of the short-term bearish move.
Key context to watch:
Traders are awaiting final decisions on US global trade policy agreements.
Next week’s FOMC meeting may confirm expectations of an interest rate cut.
Later today, markets will react to US PMI data and Jobless Claims, which could trigger volatility.
📊 Technical View
While the higher timeframe trend (D1/H4) remains bullish, the short-term structure has broken, and the market is now exploring unfilled liquidity pools below. Once these are swept, we anticipate a strong long-term BUY opportunity.
🎯 Trading Plan for Today
📌 Short-Term Strategy:
Look for short-term SELL setups on retracements toward resistance zones. Wait for clear rejection signals before entering.
📌 Mid/Long-Term Strategy:
Prepare to BUY from major Key Levels once price taps into deep liquidity zones. Ensure confluence and good risk/reward before entering.
🔎 Key Levels to Watch
🔺 Upper Resistance Zones:
3393 – 3404 – 3414 – 3420 – 3428
🔻 Lower Support Zones:
3375 – 3366 – 3352 – 3345 – 3330
🔽 Trade Setups
✅ BUY ZONE: 3352 – 3350
SL: 3345
TP: 3356 → 3360 → 3364 → 3370 → 3375 → 3380 → 3390 → 3400
🔻 SELL ZONE: 3414 – 3416
SL: 3420
TP: 3410 → 3406 → 3400 → 3395 → 3390 → 3380
⚠️ Risk Reminder
No major economic news is scheduled for today, but unexpected political statements or geopolitical tensions could cause price spikes.
✔️ Always follow your SL/TP strictly.
✔️ Avoid entering without solid confirmation.
✔️ Watch how price reacts to the levels above.
📣 Follow MMF on TradingView
If this trading roadmap helps your strategy,
📌 Follow the MMF team on TradingView for daily actionable setups, real levels, and no-nonsense analysis based on real market conditions.
🎯 Real trades. Real zones. Real discipline.

Gold Sell 4hGold ready to sell ... See 4 Hour timeframe to get entry with your own confirmations..get partial entries with your confirmations.. check the fundamental analysis too
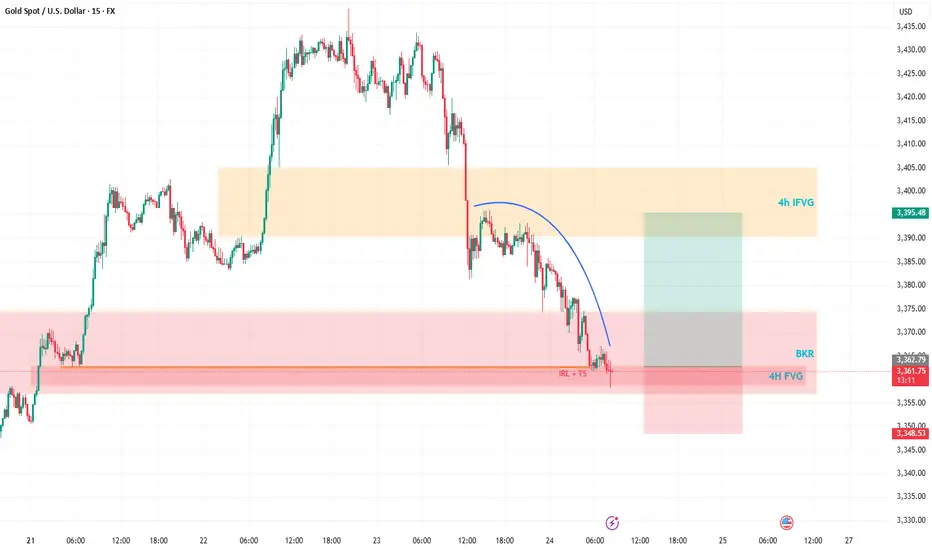
Gold’s Wild Ride: A Trader’s Take on What’s NextHey Fellow Traders! 👋
Gold’s been an absolute beast this week, smashing through both buyers and sellers like it’s playing a high-stakes game of market whack-a-mole! 😅 After Wednesday’s wild moves and today’s follow-up, Gold’s keeping us all guessing.
Right now, I’m not locking in a long-term bias—Gold’s too unpredictable for that. But here’s the exciting part: I’m eyeing a short-term long opportunity. Why? The price just dipped into a 4H Fair Value Gap (FVG) and tagged a Breaker, setting up a potential bounce. 📈
My plan? I’m expecting Gold to sweep up the highlighted liquidity and charge toward the 4H Inversion Fair Value Gap (IFVG). Once it hits that zone, I’ll be glued to the charts, watching for its reaction to decide the next move. 🧐
As always, trade smart! Set your stops, size your positions wisely, and don’t let Gold’s volatility catch you off guard. Protect your capital first—always! 💡
What’s your take on Gold right now? Are you jumping on this setup or waiting for more confirmation? Drop your thoughts in the comments below, give this post a like, and follow for more updates! 👇 Let’s keep the trading convo going! 🔥