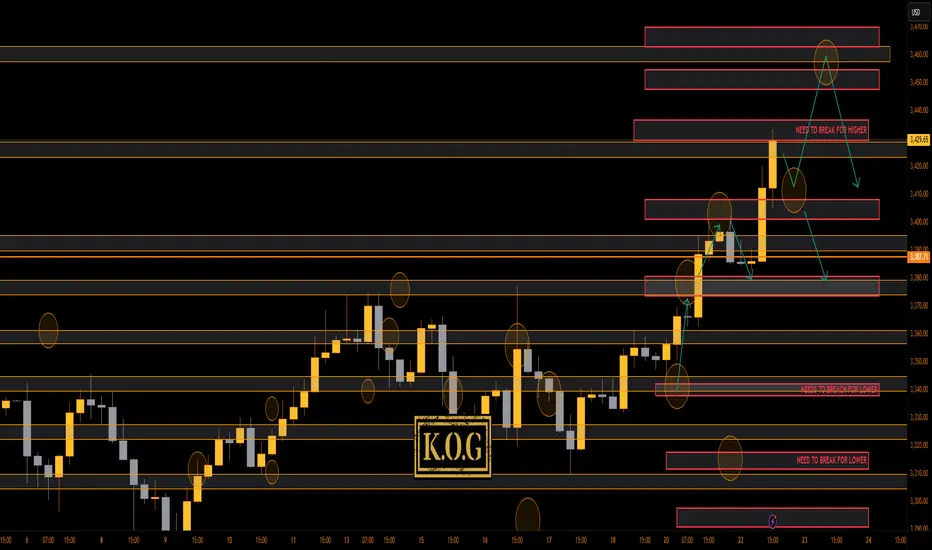
THE KOG REPORT - UpdateA rare day for us today even though we got the level for the short from above, we activated again, and due to everything lining up confirming the short into the lower order region where we wanted to bounce, we took it. Gold, had other plans, engulfing upside resulting in us having to SL the trade. It then went on to break above and complete our daily targets.
You win some, you lose some!
Now, we have support below at the 3410 region which will need to break to change short-term structure, while there is the order region above 3430-35 which could hold price and accumulate. All our bullish targets for the day are completed, we just wanted lower to then go higher.
If lower support can be targeted and held, we could see a move higher into the 3345-50 region before then a reaction in price. I'm still not happy with this move, something doesn't quite look right, so let's play it day by day.
RED BOXES:
Break above 3395 for 3404✅, 3410✅ and 3420✅ in extension of the move
Break below 3375 for 3368 and 3355 in extension of the move
As always, trade safe.
KOG
XAUUSDK trade ideas
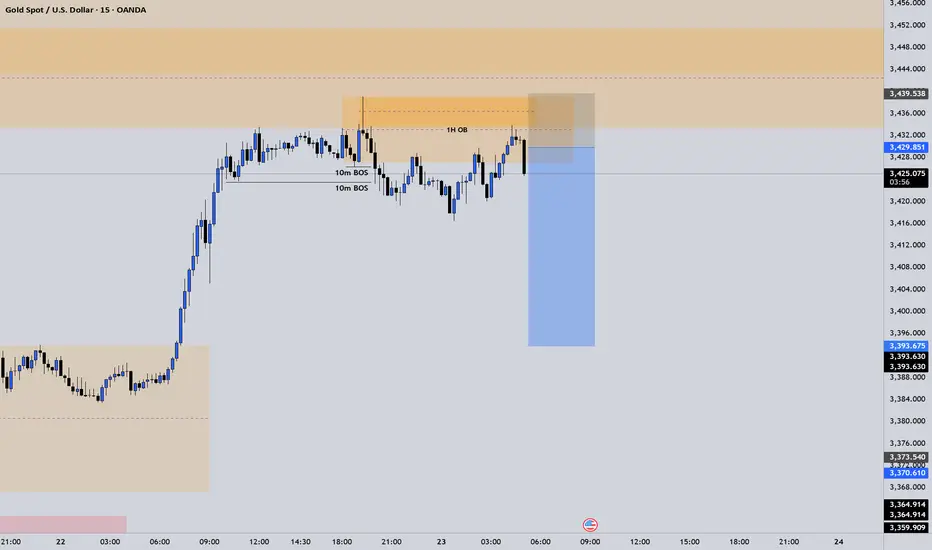
XAUUSD LIVE OUTLOOK – JULY 23, 2025Good evening, traders—let’s get this right, no mistakes. Gold hit 3,438, then pulled back and found support exactly in the 3,380–3,390 zone. Here’s your precise update:
🔸 HTF OVERVIEW (H4 → H1)
New High & Liquidity Sweep: A clean breakout to 3,438 invalidated every old supply.
Primary Demand: Price settled into the 3,380–3,390 H4 order block (untested FVG beneath). H1 confirms this blue zone as the critical buy area.
Invalidated Supply: No valid sell zones until we carve fresh structure above 3,438.
🔹 LTF PRECISION (M30 → M15)
M30 Flow: Spike to 3,438, then instant drop into 3,380–3,390. Volume spiked on the decline, then eased as price held.
M15 Structure: Inside 3,380–3,390, watch for a clean BOS above 3,395—that’s your bull‑bear pivot. Until then, this zone is the edge of the knife.
🎯 KEY ZONES & TRIGGERS
Buy Zone #1 (Live): 3,380–3,390
Confluence: H4 order block + unfilled FVG + H1 swing low
Trigger: M15 BOS above 3,395 and retest.
Buy Zone #2 (Backup): 3,350–3,360
For a deeper pullback—untested H4 demand.
Sell Zone: 3,420–3,438
Confluence: unfilled H4 FVG + premium supply
Fade only on clear M15 rejection (pin‑bar/engulf).
Decision Pivot: 3,395
Above = bullish continuation; below = stand aside.
➡️ ACTION PLAN
Longs: Enter on M15 close above 3,395 and retest; targets at 3,420 then 3,438.
Shorts: Only on rally into 3,420–3,438 with a decisive rejection candle.
Invalidation: A sustained break below 3,380 warns of a deeper flush toward 3,350–3,360.
🚀 CALL TO ACTION
If this nailed your edge, smash that Like, Follow @GoldFxMinds for daily sniper updates, and Boost this post so your fellow traders don’t miss these live levels! Drop a 🔥 if you’re ready to strike the next move.
Disclosure: I’m part of TradeNation’s Influencer program and receive a monthly fee for using their chart feed.
— GoldFxMinds


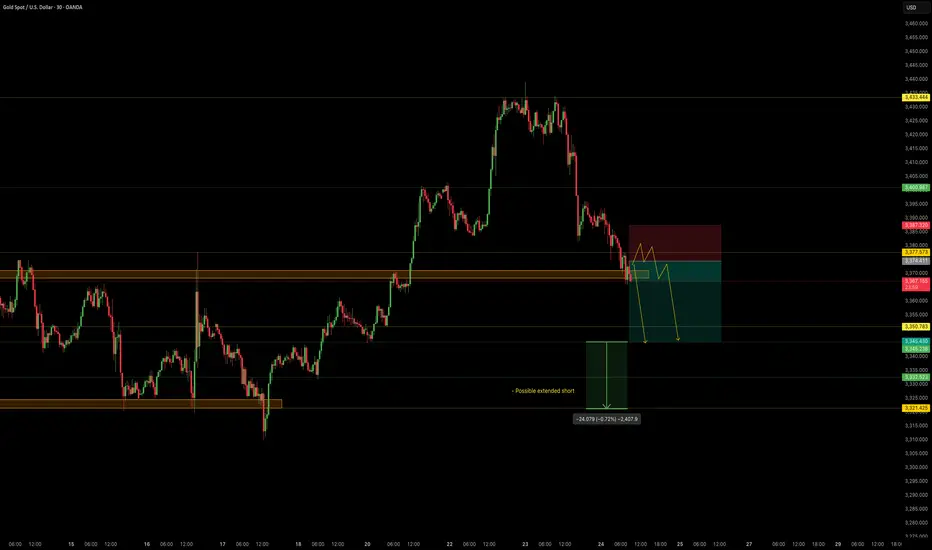
NordKern - XAUUSD InsightNordKern | Simplified Insight OANDA:XAUUSD – Short Opportunity Ahead
Gold is now near our important level at 3370, offering a shorting opportunity considering recent events and technical action.
Gold Price Decline – What's Behind It?
In the last two sessions (July 23–24), gold has retreated strongly owing to a set of global as well as market-specific circumstances:
1. Trade Deal Optimism
Advances in U.S.–Japan and U.S.–EU trade discussions lessened worldwide uncertainty, decreasing demand for gold as a safe-haven.
2. Higher U.S. Yields
Higher Treasury yields are rendering non-yielding assets such as gold less appealing, adding to downward pressure.
3. Technical & Profit-Taking
Following a recent rally, gold was exposed to selling. Stop-loss and profit-taking triggers hastened the fall.
Summary of Key Drivers
U.S. Trade Deals: Reduced geopolitical risk
Higher Treasury Yields: Decreased gold's relative attractiveness
Technical Selling: Enhanced the downward trend
Trade Setup – Bearish Bias
Entry : 3374.4
Stop Loss : 3387.3
Take Profit : 3345.4
Extended Target : 3322
Key Notes:
- Trade Deal Optimism: U.S.–Japan and U.S.–EU agreements eased global tensions, reducing demand for gold as a safe-haven asset.
- Yield Pressure: Rising U.S. Treasury yields made gold less attractive compared to interest-bearing alternatives.
- Technical Selling: Profit-taking and stop-loss triggers accelerated the decline after gold’s recent rally.
This setup remains tactically driven. Manage risk carefully and monitor for any renewed political shifts.
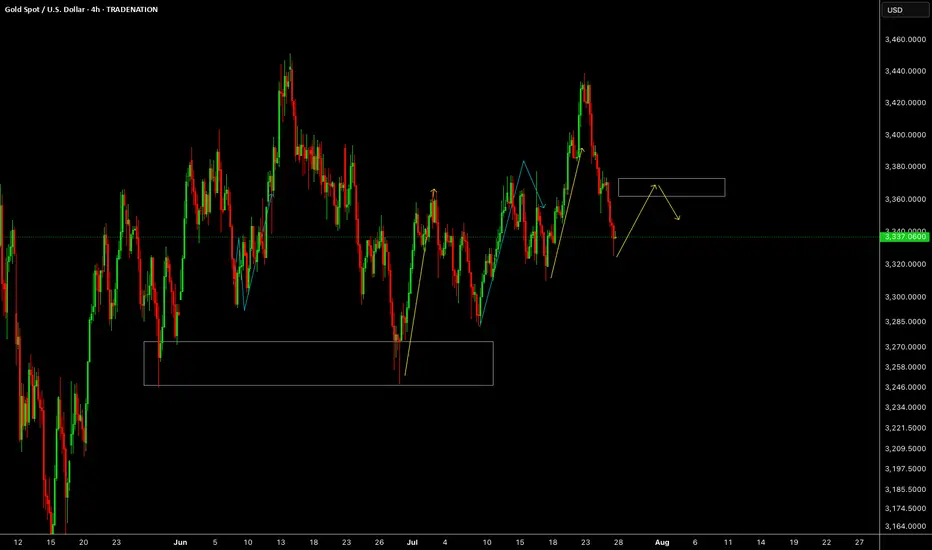
GOLDGOLD looks like it will be giving us correction or impulse up early part of this week. Reaction will be above 3360.
Disclosure: We are part of Trade Nation's Influencer program and receive a monthly fee for using their TradingView charts in our analysis.

Bullish or Bear trapHello Traders 👋
What are your thoughts on XAUUSD
Looking at the daily timeframe I anticipate manipulation by market players on gold.
Is likely that market players will stop Hunt Traders who have their stop losses at the different lows which is indicated with a red circle.
For every buyer there must be a seller and for every seller there must be a buyer.Where they are no sellers in the market the institutions will want to trigger stop losses in order to buy,which is known as stop hunting.That is to takeout previous buyers in the market and generate liquidity to buy.
And this stop hunting usually happens in a ranging market.
Looking at the structure of gold we can see that gold is ranging,
We can see a low or support of the range which was previously resistance and turned support for the ranging market.
I see the market using sell liquidity to liquidate buyers and react at the support or low of the range and move up to the range of the resistance

GOLD - SHORT TO $2,880 (UPDATE)Beautiful melt overnight, with Gold down close to 400 PIPS so far. Zoom in to the left & you'll see I've also added in a trendline which sellers have now start taking out. Another strong confluence of sellers taking control.
I warned you all last night not to sleep on Gold. My Gold Fund investors are in deep profits😉

$XAUUSD: Macro InterconnectionsResearch Notes
Linking historic surface area and coordinates of consistent geometric expressions to document and learn more about the "texture" of self-organizing processes. The topology assumes that current price is a result of all history together that took to make the price end up where it is.
The fastest shortcut to figure out fractal hierarchy of waves and general direction is through Fractal wave marker .
Since angle of highs cycle is broken and price stayed above it for long time. That means it would be better to strip the chart starting from the lower levels, in order to get better coordinates for structural basis.
FWM helps to spot that distinctive part of broken waves that enables visual orientation in the rhythm. They manifest in its closest formative across cycles.
The angle that links the pattern through the time can have deterministic property, therefore we can use that direction for fibonacci channels to fill the gaps.
The fact that on log scale the bits from bullish phase of cycles contracted on price scale, I'd orientate with thin fibonacci channels (that is based on angle of lows of macro-cycle applied to previous ATH.
There are some other interconnection that are being tested.

Daily gold analysisDaily gold analysis
Sell trade with target and stop loss as shown in the chart
The trend is down and we may see more drop in the coming period in the medium term
All the best, I hope for your participation in the analysis, and for any inquiries, please send in the comments.
He gave a signal from the strongest areas of entry, special recommendations, with a success rate of 95%, for any inquiry or request for analysis, contact me
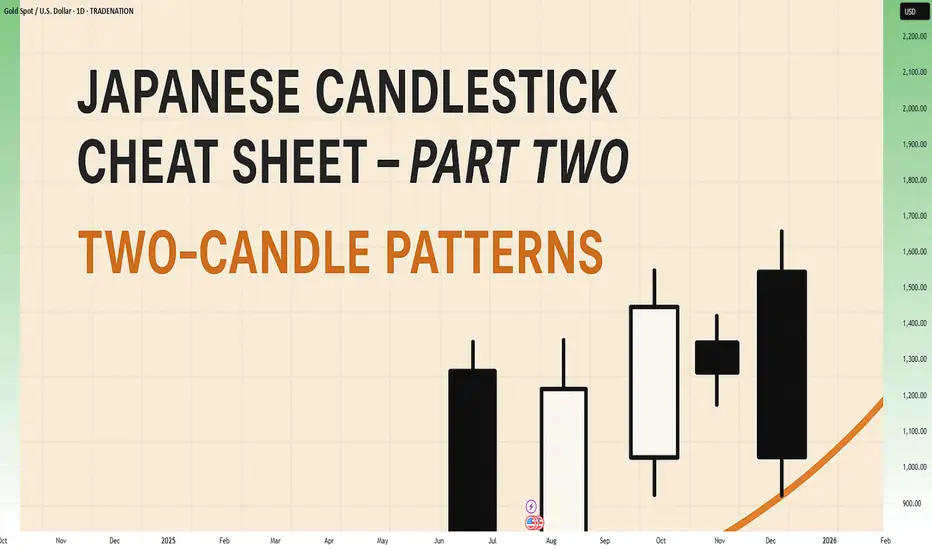
Japanese Candlestick Cheat Sheet – Part Two- 2 candle patternsTwo-Candle Patterns That Signal Shifts in Sentiment
Single candles whisper…
But two candles talk to each other — and when they do, they often reveal the first signs of a reversal or continuation.
In this second part of the series, we go deeper.
From engulfings to haramis, tweezer tops to piercing lines — these patterns don’t just look good on charts… they capture the psychological tug-of-war between buyers and sellers.
Price doesn’t lie.
And two candles in a row can say: “Something just changed.”
Learn to spot them early. Learn to listen when the chart speaks.
This is Part Two of your practical guide to mastering candlestick formations.
BULLISH KICKER
Bias: Bullish
What is the Bullish Kicker pattern?
The Bullish Kicker forms when a strong bullish candle follows a bearish one with no overlap between the two, indicating a sudden shift in sentiment. This pattern is a powerful indicator of a reversal as buyers take control. The sharp contrast between the bearish and bullish candles reflects a dramatic shift in market psychology, where bears are caught off-guard and forced to cover their positions.
Bullish Kickers are rare but extremely telling, providing a clear signal that sentiment is favoring buyers. Recognizing such decisive patterns can be a game-changer.
Meaning:
Found after downtrends or sell-offs; suggests a sudden shift in sentiment, indicating strong buying interest and potential trend reversal.
BULLISH ENGULFING
Bias: Bullish
What is the Bullish Engulfing pattern?
The Bullish Engulfing pattern occurs when a large bullish candle fully engulfs the previous smaller bearish candle, signaling a potential trend reversal. This pattern highlights a moment when buyers overpower sellers, often marking the beginning of upward momentum. Psychologically, it suggests that buyer confidence is returning, and sellers are losing their grip.
For traders, understanding Bullish Engulfing patterns can provide crucial entry points into emerging trends. Learning to identify and trade such patterns is essential for capturing momentum and new trends.
Meaning:
Typically found in downtrends, this pattern signals a potential bullish reversal as buyers overpower sellers, often indicating a shift toward upward momentum.
BULLISH HARAMI
Bias: Bullish
What is the Bullish Harami pattern?
The Bullish Harami consists of a small bullish candle within a preceding larger bearish one, indicating a pause in downward momentum and hinting at a potential reversal. This pattern shows that sellers are beginning to weaken as buyers cautiously test the waters. The Harami reflects a shift in sentiment from bearish to neutral, often marking a transitional phase in the market.
Interpreting the Bullish Harami helps traders spot moments when sentiment is shifting, potentially signaling the start of a trend change.
Meaning:
Seen in downtrends, it suggests indecision, with possible bullish reversal if the following candles confirm buying strength, indicating a weakening bearish trend.
PIERCING LINE
Bias: Bullish
What is the Piercing Line pattern?
The Piercing Line forms when a bullish candle opens below the previous bearish candle’s low but closes over halfway into it. Found in downtrends, this pattern reflects strong buying pressure as buyers step in at lower prices, creating a potential bullish reversal. The Piercing Line pattern suggests that sentiment may be shifting as buyers gain confidence.
This pattern’s strength lies in its psychological impact, revealing moments when buyers are willing to take risks. Recognizing these signs early can provide valuable insights for traders looking to time entries.
Meaning :
Found in downtrends, this pattern suggests a possible bullish reversal if buying continues, as sellers lose control to buyers.
TWEEZER BOTTOM
Bias: Bullish
What is the Tweezer Bottom pattern?
The Tweezer Bottom pattern is characterized by two consecutive candles with nearly identical lows, one bearish and one bullish. This pattern often signals the end of a downtrend, as the matching lows suggest a strong support level where buyers are stepping in. The Tweezer Bottom highlights market psychology at work, with sellers unable to push prices lower, reflecting renewed buying interest.
Tweezer Bottoms are ideal for traders looking to identify support zones and potential reversal points. By understanding this pattern’s significance, traders can make informed decisions.
Meaning:
Found in downtrends, it signals potential reversal, showing strong support at the matching low, suggesting buyers are stepping in.
BEARISH KICKER
Bias: Bearish
What is the Bearish Kicker pattern?
The Bearish Kicker is the inverse of the Bullish Kicker, forming when a strong bearish candle follows a bullish one without overlap, indicating a sharp sentiment shift. This pattern often marks a sudden reversal, with sellers taking control after an initial bullish period. Psychologically, Bearish Kickers are powerful, signaling that buyers are caught off-guard and losing momentum.
Recognizing Bearish Kickers provides traders with insights into sudden shifts in market dynamics, helping them avoid buying into weakening trends.
Meaning:
Found after uptrends; indicates a sudden sentiment shift, signaling potential trend reversal and intensified selling pressure.
BEARISH ENGULFING
Bias: Bearish
What is the Bearish Engulfing pattern?
The Bearish Engulfing pattern forms when a large bearish candle engulfs the previous smaller bullish candle, suggesting a potential reversal in an uptrend. This pattern signals that sellers have regained control, often marking the start of downward momentum. The Bearish Engulfing reveals a psychological shift, as selling pressure overtakes buying interest.
This pattern is a powerful tool for traders who aim to catch trend reversals, allowing them to align with emerging downward momentum.
Meaning:
Typically found in uptrends, this pattern signals a potential bearish reversal as sellers overpower buyers, often indicating a downward momentum shift.
BEARISH HARAMI
Bias: Bearish
What is the Bearish Harami pattern?
The Bearish Harami consists of a small bearish candle contained within a larger preceding bullish one, reflecting indecision and a potential trend reversal. Found in uptrends, it hints that buyers are losing strength, while sellers are cautiously testing the market. This pattern highlights moments when buyer momentum begins to wane, suggesting caution.
Interpreting the Bearish Harami allows traders to spot potential shifts in sentiment, helping them manage risk and time their exits.
Meaning:
Seen in uptrends, it suggests indecision with a potential bearish reversal if following candles confirm, indicating a weakening bullish trend.
DARK CLOUD COVER
Bias: Bearish
What is the Dark Cloud Cover pattern?
The Dark Cloud Cover appears when a bearish candle opens above the previous bullish candle but closes over halfway into it, reflecting a shift in control from buyers to sellers. This pattern suggests that bullish momentum may be fading, hinting at a potential reversal. Dark Cloud Cover patterns reveal moments when sentiment shifts from optimism to caution.
For traders, understanding this pattern helps them anticipate reversals at the top of uptrends.
Meaning:
Found in uptrends; signals potential bearish reversal if selling continues, as buyers lose control to sellers.
TWEEZER TOP
Bias: Bearish
W hat is the Tweezer Top pattern?
The Tweezer Top is formed by two candles with matching or nearly matching highs, typically one bullish and one bearish. This pattern signals potential resistance, as sellers are consistently pushing back against the same level. The Tweezer Top reflects a moment of seller strength, often marking the end of an uptrend.
Recognizing Tweezer Tops helps traders spot resistance zones and potential reversal points, allowing them to avoid buying into weakening trends or even shorting the asset.
Meaning:
Found in uptrends, it signals potential reversal, showing strong resistance at the matching high, suggesting selling pressure.
🧭 Final Thought
Two-candle formations often appear at key turning points — right where most traders hesitate or get trapped.
Learn to read them not just as patterns, but as conversations between candles — one pushing, the other reacting.
And if this is your first time reading the series, don’t miss Part One – where we covered single-candle signals like dojis, hammers, and marubozus — the very foundations of candlestick reading.
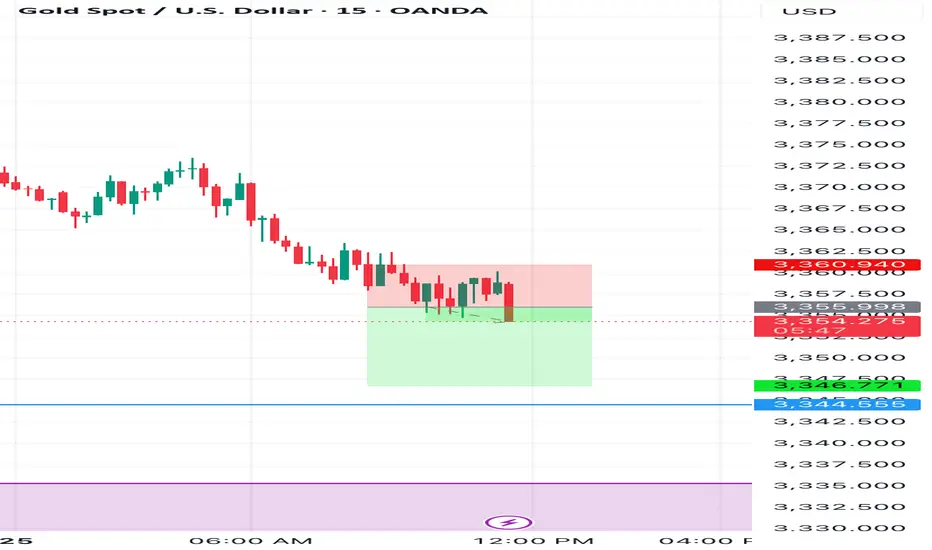
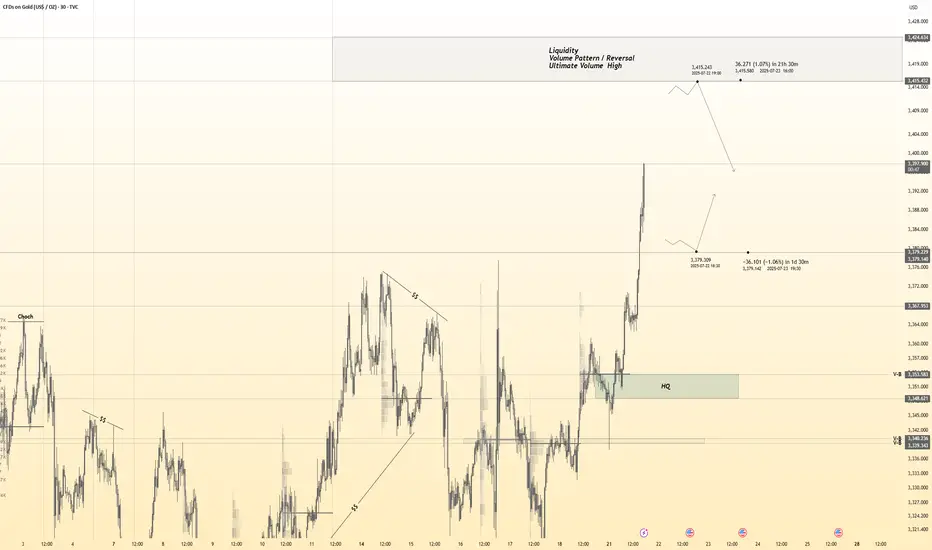
Gold 30Min Engaged ( Bullish & Bearish Reversal Entry Detected )————-
➕ Objective: Precision Volume Execution
Time Frame: 30-Minute Warfare
Entry Protocol: Only after volume-verified breakout
🩸 Accurate Bullish Reversal : 3380
🩸 Accurate Bearish Reversal : 3314.5
➗ Hanzo Protocol: Volume-Tiered Entry Authority
➕ Zone Activated: Dynamic market pressure detected.
The level isn’t just price — it’s a memory of where they moved size.
Volume is rising beneath the surface — not noise, but preparation.
🔥 Tactical Note:
We wait for the energy signature — when volume betrays intention.
The trap gets set. The weak follow. We execute.
Short XAUUSDElite Analysis
Price Hit a 6H BOS
Price rejected the OB
Detected a bearish BOS, confirmed it a second time.
Executed in 5m, targeting a lower liquidity pool.
XAU/USD – Current Wave Count & Potential ScenariosOANDA:XAUUSD
We are currently moving from (white) wave 3 to (white) wave 4.
So far, I am leaning towards the white count where the waves labeled (A), (B), (C) form a larger corrective wave A, which leads to wave B, and then to (white) wave 4.
Up to now, we have only completed (A) and (B).
Now, in the yellow bracket, we can interpret a 1-2-3-4-5 structure leading to (white) wave C 🟡.
Alternatively, one could interpret a triangle pattern (pink count):
Waves A, B, C, D, E, which would then form our wave 4.
In that case, we would expect bullish targets afterwards 🚀.
We need to watch closely if the price reverses or breaks through our yellow Fibonacci zone 🟡.
For now, we are primarily looking for upside potential 🔼.
From our yellow wave 2, we saw a downward push, which could theoretically be our yellow wave 1 leading into yellow wave 2 and the yellow Fibonacci zone — essentially a five-wave move from wave 2 to wave 3.

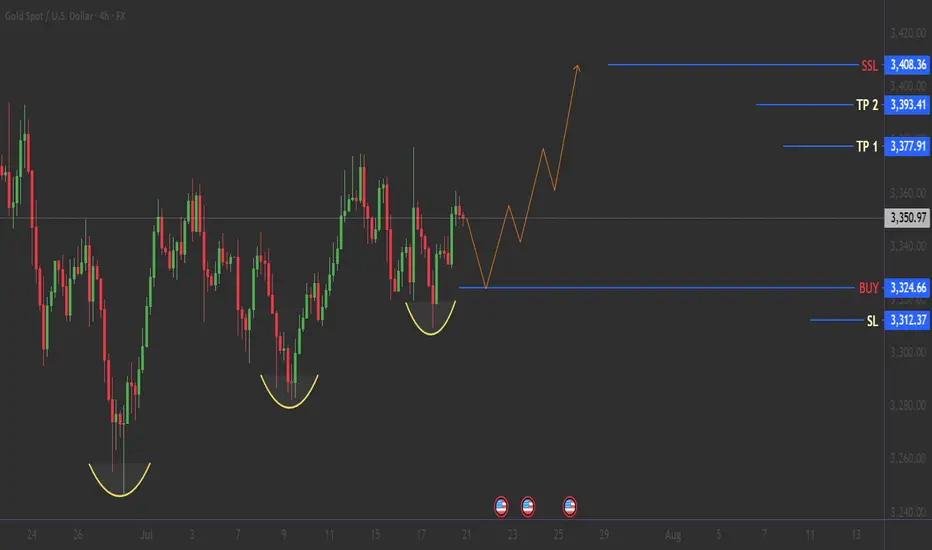
GOLD: Bullish Reversal Pattern Activated! 21/07/2025THE GOLDEN SETUP: Triple Bottom Masterpiece :
🟢 BULLISH BREAKOUT SETUP
🎯 BUY ZONE: $3,324 (Neckline Break)
🚀 TP1: $3,377
🚀 TP2: $3,393
🚀 LAST TP : $3,408
Stop Loss: $3,312 (Below recent low) 🚨
🌟 Before You Trade:
✅Wait for neckline break ($3,325+)🔥
✅Confirm with volume surge
✅Set stop loss below pattern ($3,312)
✅Calculate position size (max 2% risk)
--------------- N O T E ----------------
🚨 RISK MANAGEMENT 💡DYOR
Follow for more high-probability setups! 📊✨
Gold – Bear-to-Bull Transition in Motion?🧠 MJTrading:
TVC:GOLD – 8H Chart: Bulls, It’s Your Move.
📸 Viewing Tip:
🛠️ Some layout elements may shift depending on your screen size.
🔗 View the fixed high-resolution chart here:
The impulsive move from 3000 to 3500 wasn’t just a trend — it was a statement of strength.
That rally carved the ATH, then left behind weeks of digestion and structural compression.
Now, the market may be setting up for its next decision.
Notice how each bearish leg has been shrinking — a classic behavioral signal that sellers are losing momentum — possibly a shift in control underway.
We’re also pressing above the downtrend line from the ATH (3500), while the uptrend from 3000 remains clean and respected.
We’re now testing the 3400 zone — a key battleground.
📍 If bulls want to reclaim the momentum and show dominance, this is the moment to act.
🔹 1st Support: 3363–3377
🔹 2nd Support: Rising trendline
🎯 Target Zone: 3455–3500+ (Liquidity Pool & ATH proximity)
⚠️ Break back inside the triangle could delay the breakout narrative.
⚠️ If momentum fails to increase from here, and bulls can’t break out with conviction, the market is likely to remain range-bound for longer — extending the sideways phase between 3250–3500.
💭 If you’re watching for a new ATH… stay sharp, stay structured — the market rewards patience and readiness.
“If the structure speaks to you, let it echo, boost it.”
📐 MJTrading 🚀
What do you think?
#GoldAnalysis #XAUUSD #MarketStructure #LiquiditySweep #AnythingCanHappen
#MJTrading
#ChartDesigner
Psychology Always Matters:
Click on them for the caption...

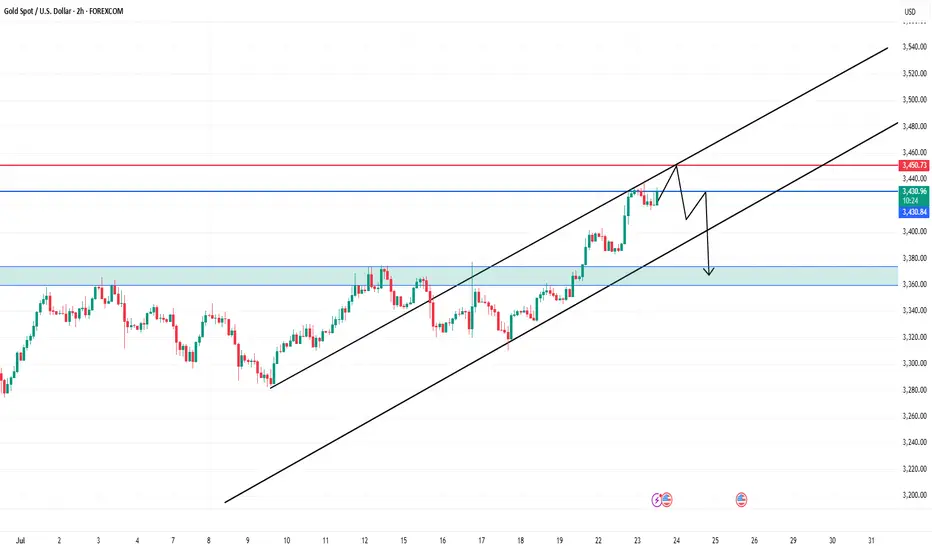
Gold at Key Resistance – Bearish Pullback Ahead?Technical Analysis (2H Chart)
1. Trend Structure:
Price is moving in a clear ascending channel (black trend lines).
Currently testing the upper boundary of the channel, which may act as resistance.
2. Resistance Zones:
$3,431–$3,450: Strong resistance zone.
Horizontal resistance at $3,450.73 (marked in red).
Price may form a lower high before reversal, as the black arrow suggests.
3. Support Zones:
$3,374 – $3,360: Previous structure and demand zone (highlighted green).
Strong potential bounce zone if price drops.
4. Price Action Expectation:
Possible fakeout or retest near $3,450 → followed by a rejection and drop toward the $3,360 area.
Bearish bias indicated by the projected path.
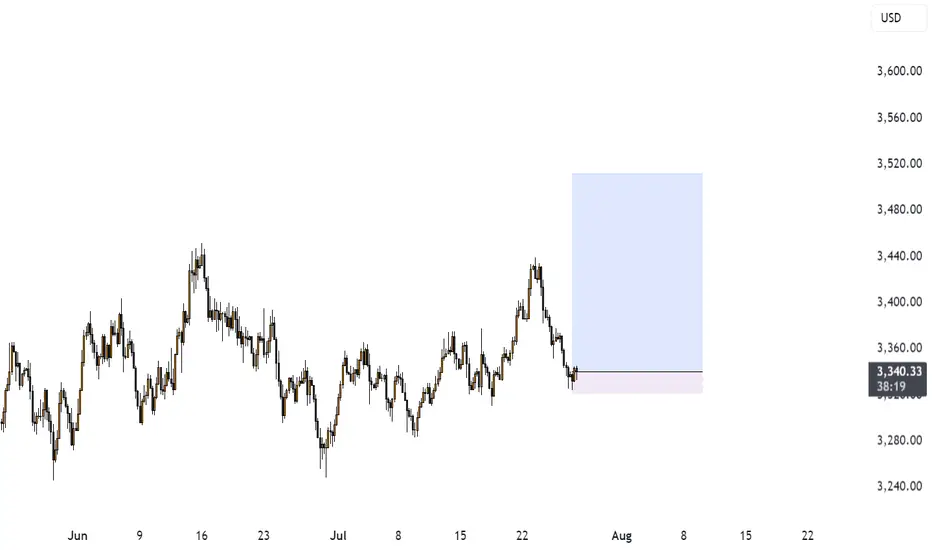
Bullish continuation?The Gold (XAU/USD) is falling towards the pivot and could bounce to the 1st resistance.
Pivot: 3,390.13
1st Support: 3,356.66
1st Resistance: 3,491.05
Risk Warning:
Trading Forex and CFDs carries a high level of risk to your capital and you should only trade with money you can afford to lose. Trading Forex and CFDs may not be suitable for all investors, so please ensure that you fully understand the risks involved and seek independent advice if necessary.
Disclaimer:
The above opinions given constitute general market commentary, and do not constitute the opinion or advice of IC Markets or any form of personal or investment advice.
Any opinions, news, research, analyses, prices, other information, or links to third-party sites contained on this website are provided on an "as-is" basis, are intended only to be informative, is not an advice nor a recommendation, nor research, or a record of our trading prices, or an offer of, or solicitation for a transaction in any financial instrument and thus should not be treated as such. The information provided does not involve any specific investment objectives, financial situation and needs of any specific person who may receive it. Please be aware, that past performance is not a reliable indicator of future performance and/or results. Past Performance or Forward-looking scenarios based upon the reasonable beliefs of the third-party provider are not a guarantee of future performance. Actual results may differ materially from those anticipated in forward-looking or past performance statements. IC Markets makes no representation or warranty and assumes no liability as to the accuracy or completeness of the information provided, nor any loss arising from any investment based on a recommendation, forecast or any information supplied by any third-party.

XAUUSD - market structureXAUUSD - market structure, XAUUSD - market structure , use risk and trade managment, this is not FULL analysis
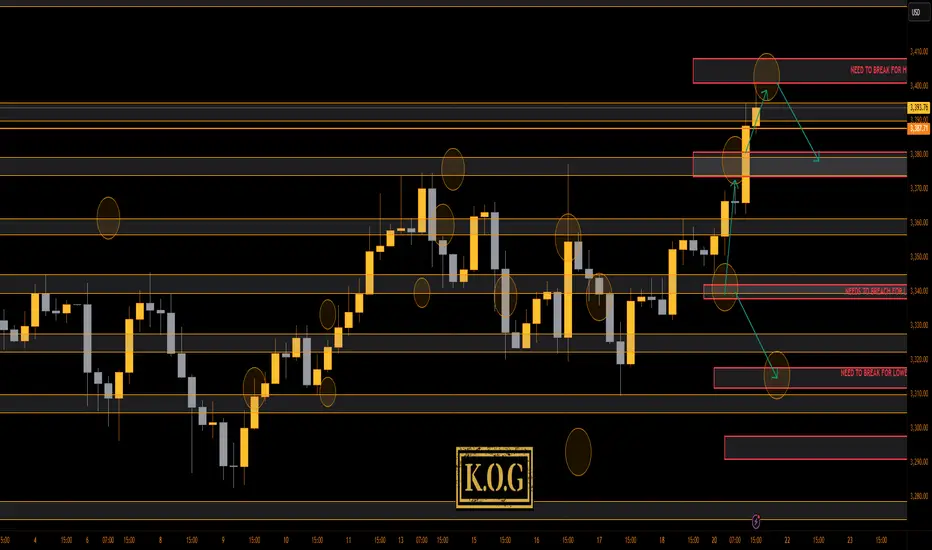
THE KOG REPORT - UpdateEnd of day update from us here at KOG:
Interesting open for the week, not just on gold but across the markets! Our plan yesterday in the KOG Report was to look for that lower support level to hold and then not only to target Excalibur which confirmed the move, but also the red box and bias level targets. This worked well and yet again, within a day, we've completed the week's targets upside!
We couldn't short from the first red box as it was broken. Now we have the red box above which is holding and giving a slight move downside and with the indicators flashing red, we'll stick with the move so far initially looking for 3390-85. We're not discounting a retest of the level, but as long as it holds, we'll go with it.
KOG’s Bias for the week:
Bullish above 3340 with targets above 3355✅, 3361✅, 3368✅, 3372✅ and above that 3385✅
Bearish below 3340 with targets below 3335, 3330, 3322, 3316, 3310 and below that 3304
RED BOX TARGETS:
Break above 3350 for 3355✅, 3361✅, 3367✅, 3375✅ and 3390✅ in extension of the move
Break below 3340 for 3335, 3330, 3320, 3310 and 3306 in extension of the move
Please do support us by hitting the like button, leaving a comment, and giving us a follow. We’ve been doing this for a long time now providing traders with in-depth free analysis on Gold, so your likes and comments are very much appreciated.
As always, trade safe.
KOG
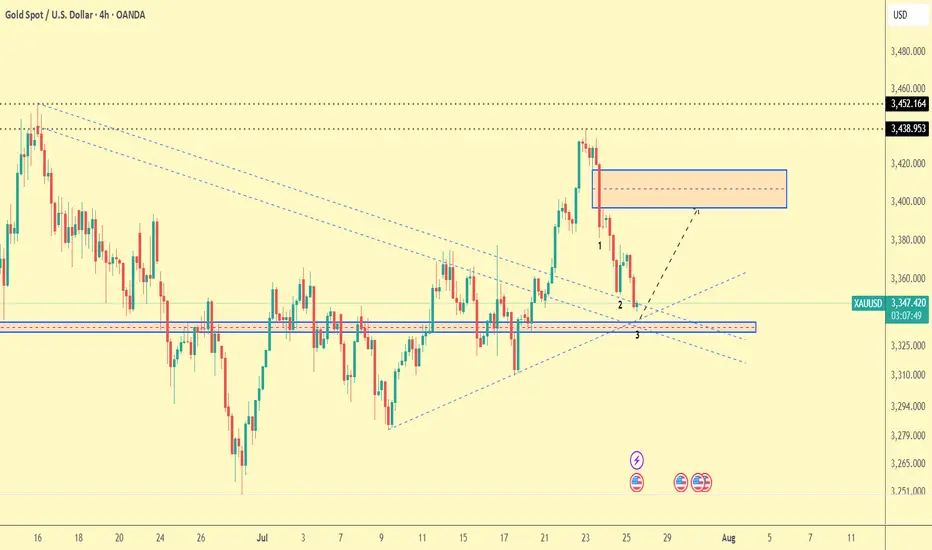
Gold Trade Plan 25/07/2025Dear Trader,
Gold (XAU/USD) is currently in a corrective phase, reaching near the support zone at around 3,340. The price is testing the trendline, and we may see a potential bounce towards the resistance level at 3,400-3,420. If the price breaks below this support, we could expect a further drop towards the next support levels near 3,325-3,310. The market will likely consolidate in this range until we see a breakout in either direction. The key levels to watch are 3,340 (support) and 3,400-3,420 (resistance). Monitor the price action closely as a reversal or continuation can occur here.
Regards,
Alireza!
XAUUSD -28/5/25 - Day trade in bearish directionWatching DXY i noticed some string bullish momentum in the dollar.
As a result it looks like gold may have continued weakness today.
I see a pivot formed on the 15in and taking a bearish trade to the hight time frame liquidity equal levels below.
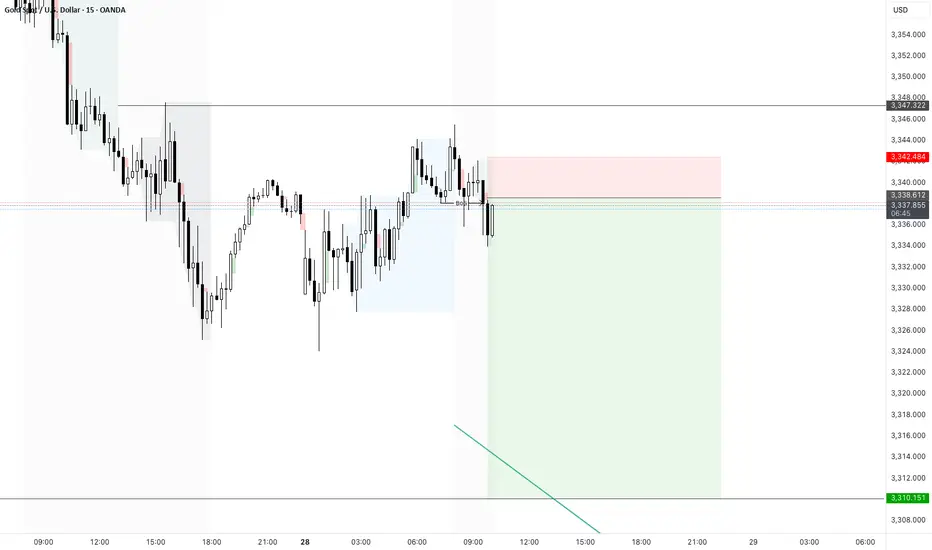
Gold Trade Plan 28/07/2025Dear Trader,
Today, I think the market will move within the range of 3320-3360, given the lack of major news. For now, it is a range-bound area, and my final target for today is around 3352-3360.
regards,
Alireza!
