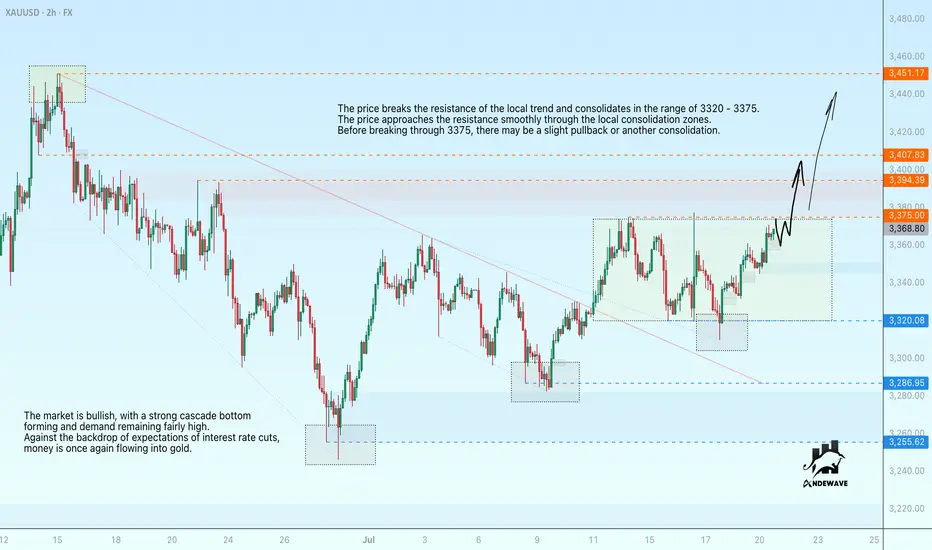
Gold tests resistance for a rally to 3450The price breaks through the resistance of the local trend and consolidates in the range of 3320-3375. The price approaches the resistance smoothly through local consolidation zones. Before breaking through 3375, there may be a slight pullback or another consolidation.
The market is bullish, with a strong cascade bottom forming and demand remaining fairly high. Against the backdrop of expectations of interest rate cuts, money is once again flowing into gold.
XAUUSDK trade ideas
XAUUSD H4 Outlook – “Fed Week: Only the Real Zones”Hello, gold traders!
FOMC week is here, the dollar’s flexing, and gold is stuck under a fortress of supply. No fantasy, no overlaps, just your real, actionable H4 map—zones spaced, logic tight, and all fluff deleted.
⬜Bias:
Neutral to bearish while price is capped under 3,355 and the EMA cluster.
Only flip bullish if price closes and holds above 3,375 with strong confirmation after news.
Current Price: 3,336.81
Summary for your audience:
Neutral–bearish: All the EMAs (21/50/100/200) are overhead, and the primary supply and decision zones are blocking any upside.
No reason to flip bullish unless gold breaks out and holds above both the decision zone and the full supply ceiling after major news.
All bounces into supply are likely to get faded, unless the structure changes dramatically post-FOMC.
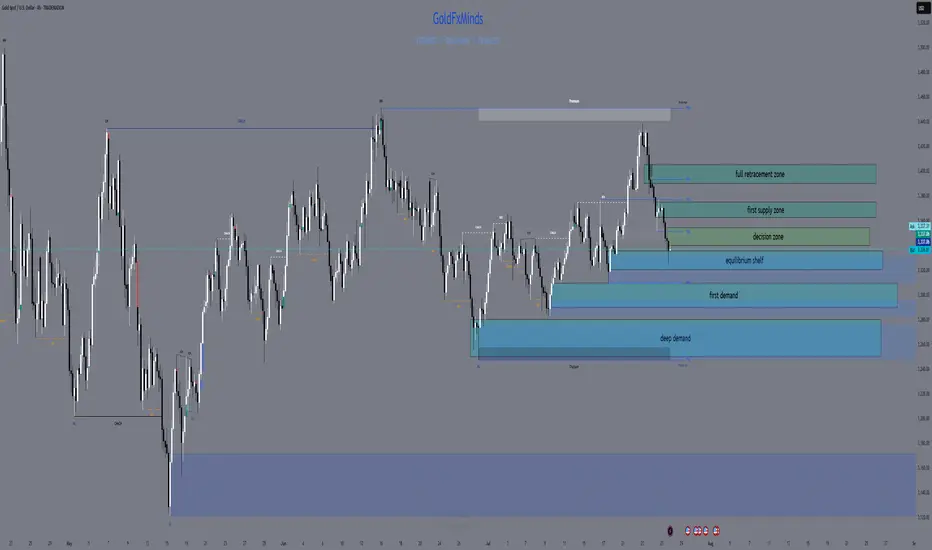
🟥 ULTRA SUPPLY ZONE: 3,390 – 3,405
127–161.8% Fib extension—liquidity grab and stop-hunt target for news-driven spikes
Only short if you see a monster upper wick and hard rejection
🟥 PRIMARY SUPPLY: 3,365 – 3,375
All EMAs (21/50/100/200) are stacked overhead; unfilled FVG at 3,370–3,375
Short on a clear rally rejection or bearish engulfing candle—this is where most breakouts get trapped
🔶 DECISION ZONE: 3,340 – 3,355
EMA100/200 straddle this level; small FVG at 3,350–3,352
Market “decides” here—fade unless price closes decisively above 3,355
🔵 EQUILIBRIUM SHELF: 3,320 – 3,335
50% Fib at 3,327; filled FVG at 3,325–3,330; SMA50 just below
Bounce/fake-break zone—wait for a clean H4 reversal, not a guess
🟢 FIRST DEMAND BASE: 3,290 – 3,310
H4 Order Block, hidden FVG (3,300–3,305), Fib 38.2% around 3,295
Longs only with strong pin-bar/engulf and quick EMA50 reclaim
🔵 DEEP PULLBACK BAY: 3,250 – 3,280
Weekly EMA21 and 61.8% Fib (~3,260), strong volume
Only consider a long on a panic flush and a powerful reversal wick
⚡️ MACRO CONTEXT
USD: On fire into ADP and FOMC; gold moves will be explosive, not logical
Events:
Tue: ADP
Wed: FOMC + Powell
Thu: Core PCE
Fri: NFP, ISM
Bias: Neutral-bearish under 3,355; only bullish if we close and hold above 3,375
EMAs: Clustered tightly overhead—bulls get no respect until this ceiling is crushed
🎯 TRADE LOGIC
Shorts:
3,390–3,405 (big wicks and clear rejection only)
3,365–3,375 (news spike or failed breakout with bearish candle)
Longs:
3,340–3,355 (only on a confirmed close above)
3,320–3,335 (strong reversal only—don’t front run)
3,290–3,310 (classic H4 pin-bar/engulf + EMA50 reclaim)
3,250–3,280 (deep panic flush and major reversal only)
NO TRADE: In the gaps—let the gamblers get chewed up, not you.
💬 Which zone will you snipe? Drop a comment and show you’re here for structure, not noise!
👍 Like & Follow for high-value, real-time sniper maps every day.
Disclosure: Chart via Trade Nation’s TradingView feed. Influencer Program participant.
GoldFxMinds 💛
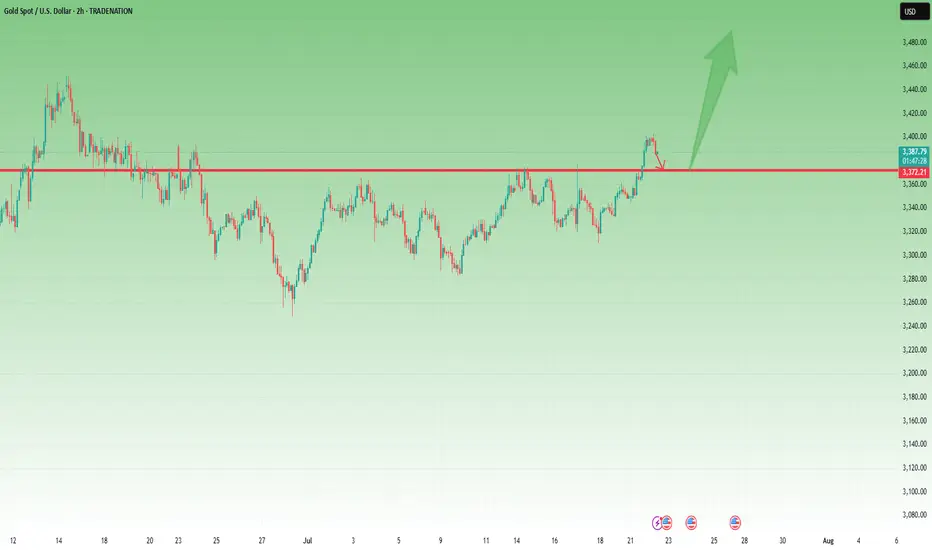
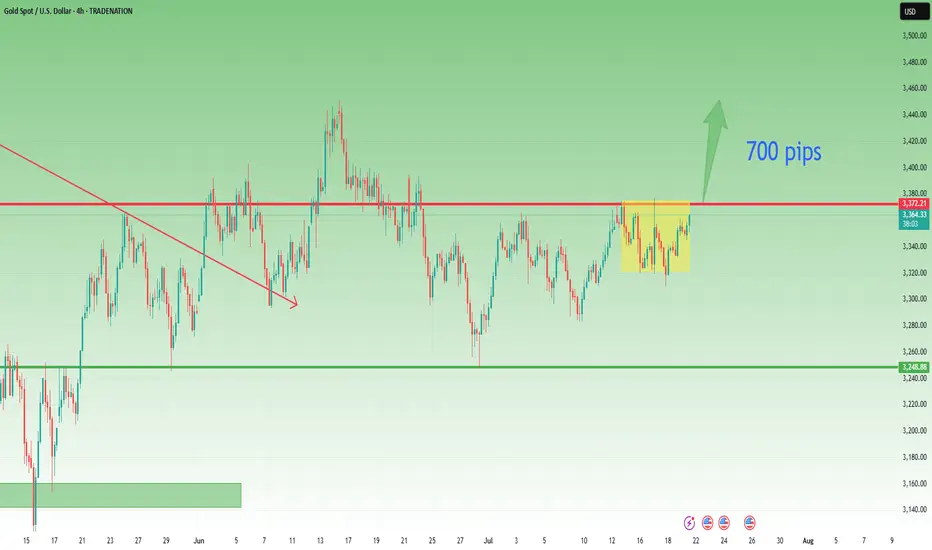
Gold - Above 3370 Is Bullish Territory – But 3360 Must Hold📆 What happened yesterday?
After more than a week of frustrating, sideways price action, Gold finally broke out above the key 3370 resistance zone.
The breakout was clean and impulsive, with TRADENATION:XAUUSD pushing to an intraday high around 3400.
Following that move, price printed a small double top near the high and began a modest correction — perfectly normal after such a breakout. At the time of writing, Gold trades at 3385, still holding above former resistance.
📈 Why this breakout matters:
The daily close at 3396 came in strong and near the top, leaving behind a clear Marubozu candle
This kind of price action signals conviction and momentum
The breakout confirms what I’ve been anticipating for days — the range is resolved, and the market is choosing the bullish path
🎯 What to expect next:
If price stabilizes above 3400, the road to 3450 opens — which is the target mentioned in my previous analyses
That area represents the next major resistance and likely magnet for price if bulls stay in control
🧭 Trading Plan:
For me, the plan is now simple:
✅ Buy the dips — especially on a potential retest of the 3370–3375 broken resistance, which now turns into support
❌ Negation comes only with a daily close below 3360, which would invalidate this breakout and raise questions
📌 Conclusion:
The breakout has finally come. After days of coiling, Gold chose the upside.
Momentum is building, structure is clean, and bulls are back in control — unless 3360 fails.
Until then, I remain bullish, looking to buy dips into strength. 🚀
Disclosure: I am part of TradeNation's Influencer program and receive a monthly fee for using their TradingView charts in my analyses and educational articles.
XAUUSD bullish breakout from major supply zone retracement done📊XAUUSD Forecast – 1H Timeframe
Gold has broken out above the major supply zone at 3375, showing strong bullish intent
Price is now pulling back — retracement in progress back to the breakout level for a potential bullish continuation
📍 Key Zone to Watch:
3375 now acting as strong support — waiting for a bullish confirmation candle from this zone
🎯 Next Resistance / Target Levels:
🔹 3399 – minor resistance
🔹 3435 – key supply zone on watch
🧠Waiting patiently for confirmation before re-entering — structure still bullish on the 1H timeframe
What’s your next move on Gold? Drop your thoughts below
👍 Like | 🔔 Follow | 💭 Comment for real-time trade ideas
#xauusd #gold

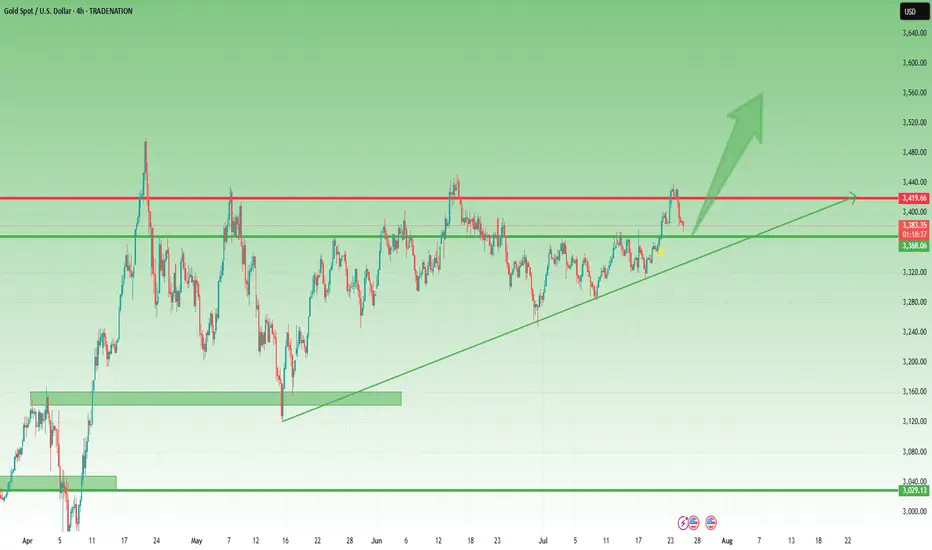
Gold Correction Went Deeper, but the Bullish Structure Intact📌 Quick recap from yesterday:
In my previous analysis, I mentioned that I was looking to buy dips around 3400, expecting a continuation move toward the ATH near 3500.
That was the plan.
But as the day unfolded, I removed my pending buy order — and explained exactly why in an educational post on how context can override entry levels.
If you read that, you already understand:
It’s not where price goes. It’s how it gets there.
________________________________________
📉 So… where are we now?
The big question is:
Was this just a deeper correction, or is Gold preparing to shift direction entirely?
In my opinion, we’re still in a healthy correction, not a reversal.
Why?
• Price remains above the horizontal support — the same level that acted as resistance last week
• The market is still above the trendline from mid-May
• No breakdown, no major structure violation — just deeper retracement after a sharp impulsive move
________________________________________
📈 What’s the plan going forward?
As long as these two supports hold, I believe the buy-the-dip narrative remains valid — even at better prices.
In fact, I already entered a new long position about an hour ago, which is currently up around 90 pips at the time of writing.
My bias stays bullish unless proven otherwise.
________________________________________
📌 Conclusion:
Yes, the correction went deeper than expected.
Yes, I removed a pending order — because the reaction was not what I wanted to see.
But structure still supports continuation, and I remain in the buy-the-dip camp as long as key support holds. 🚀
Disclosure: I am part of TradeNation's Influencer program and receive a monthly fee for using their TradingView charts in my analyses and educational articles.
Simple Swing Trading Strategy with Smart Money Concept Explained
I will share with you the essential basics of swing trading forex gold with Smart Money Concepts.
You will learn how to do swing trading with the best SMC strategy.
I will teach you to c ombine order blocks, liquidity zones and imbalances to spot accurate entries and confirmation signals.
If you just started learning swing trading Forex with Smart Money Concepts, I strictly recommend trading with the trend only.
The cases and examples that we will discuss will be strictly trend-following ones.
Swing Trading with SMC in Uptrend
For swing buying any forex pair, we will look for the market that is trading in a bullish trend.
To confirm that the market is rising, you will need to execute structure mapping and find a forex pair that updates Higher Highs HH and Higher Lows HL.
Above is the example how I confirmed that GBPUSD is bullish with structure mapping. You can see that the pair consistently updates the highs.
Once you identified a bullish pair, your next step will be to find the zone from where the next swing move will follow.
According to the rules, the market remains in uptrend till the price is staying above or on the level of the last Higher Low HL.
Here is such a zone on GBPUSD.
It is based on the last Higher Low and current price levels.
We will assume that buying orders will concentrate within that area and from that a bullish rally will follow.
The problem is that this area is extremely wide, and we can not just buy randomly within.
Our next step will be to find liquidity zones within.
To buy, we need demand areas.
I found 4 price action based historic demand zones on GBPUSD.
We will need to wait for the test of one of these zones and then wait for an order block - a place where smart money are placing their buy orders.
The problem is that we don't know in which of these areas the order block is, so we will need to wait for tests of these zones and a consequent imbalance to confirm it.
To confirm a bullish imbalance for swing trading Forex, I recommend analyzing a 4H time frame after a test of a demand zone.
According to Smart Money Concepts, a bullish imbalance can be any sign of strength of the buyers : bullish breakout of a vertical/horizontal resistance, change of character, high momentum bullish candle, bullish price action pattern, etc.
An order block on GBPUSD was confirmed with a breakout of a resistance line of a falling channel on a 4H time frame.
That was the signal that Smart Money are buying, and that is your signal to open a swing long trade.
You place a buy position then with a stop loss below the order block and a target - at least a current high.
Swing Trading with SMC in Downtrend
For swing selling any forex pair, you will need to find a market that is trading in a bearish trend.
I suggest applying structure mapping to identify such a pair.
It simply should update Lower Lows LL and Lower Highs consistently.
USDCAD is trading in a bearish trend.
Structure mapping helps to easily confirm that.
Then, we will need to identify the zone from where the next bearish wave will start.
According to Smart Money Concepts structure mapping rules, the market remains bearish till the price is staying below or on the level of the last Lower High LH.
That's such a zone on USDCAD.
It is based on current prices and the last Lower High.
We will assume that selling orders will be distributed along the entire lenth of our zone.
Of course, we can not sell randomly within that zone because it is relatively extended.
Our next task will be to find liquidity supply zones within.
I found 2 price action based supply zones within our underlined area.
Before we sell, we will need to find an order block.
A place from where smart money are selling big.
To spot that, I suggest waiting for a test of one of our supply zones and wait for a bearish imbalance on a 4H time frame.
According to SMC, a bearish imbalance can be a bearish high momentum candle, a bearish CHoCH, a bearish price action pattern, a bearish breakout of a horizontal/vertical support , etc.
You can see that a lower supply zone was tested on USDCAD.
Our bearish order block confirmation is a bearish Change of Character, a formation of a high momentum bearish candle and a breakout of a rising trend line.
After that we can open a swing sell position and expect a bearish movement at least to a current low.
Stop loss should lie strictly above the order block.
TP should be at least a c urrent low.
That is how a trade should be executed on USDCAD pair.
Remember that there is no guarantee that the order block will be within a liquidity zone. You should learn to track the signs of smart money and their operations.
A proper combination of a trend analysis, liquidity zones and order block is the essential basis of a profitable swing trading Forex.
Mastering that, practice recognizing the imbalances and confirmations for spotting the best swing trading entries.
❤️Please, support my work with like, thank you!❤️
I am part of Trade Nation's Influencer program and receive a monthly fee for using their TradingView charts in my analysis.
Gold 30Min Engaged ( Bullish Reversal Entry Detected )————-
➕ Objective: Precision Volume Execution
Time Frame: 30-Minute Warfare
Entry Protocol: Only after volume-verified breakout
🩸 Bullish Reversal From : 3341.5 Zone
➗ Hanzo Protocol: Volume-Tiered Entry Authority
➕ Zone Activated: Dynamic market pressure detected.
The level isn’t just price — it’s a memory of where they moved size.
Volume is rising beneath the surface — not noise, but preparation.
🔥 Tactical Note:
We wait for the energy signature — when volume betrays intention.
The trap gets set. The weak follow. We execute.
Gold 30Min Engaged ( Bullish & Bearish Reversal Entry's Detected————-
➕ Objective: Precision Volume Execution
Time Frame: 30-Minute Warfare
Entry Protocol: Only after volume-verified breakout
🩸 Bullish reversal : 3354.5
🩸 Bearish Reversal : 3379
➗ Hanzo Protocol: Volume-Tiered Entry Authority
➕ Zone Activated: Dynamic market pressure detected.
The level isn’t just price — it’s a memory of where they moved size.
Volume is rising beneath the surface — not noise, but preparation.
🔥 Tactical Note:
We wait for the energy signature — when volume betrays intention.
The trap gets set. The weak follow. We execute.
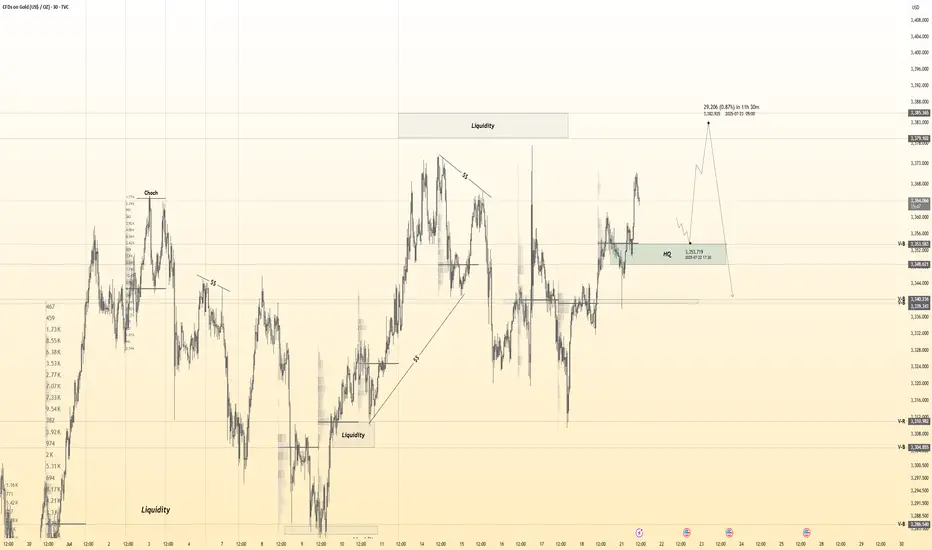
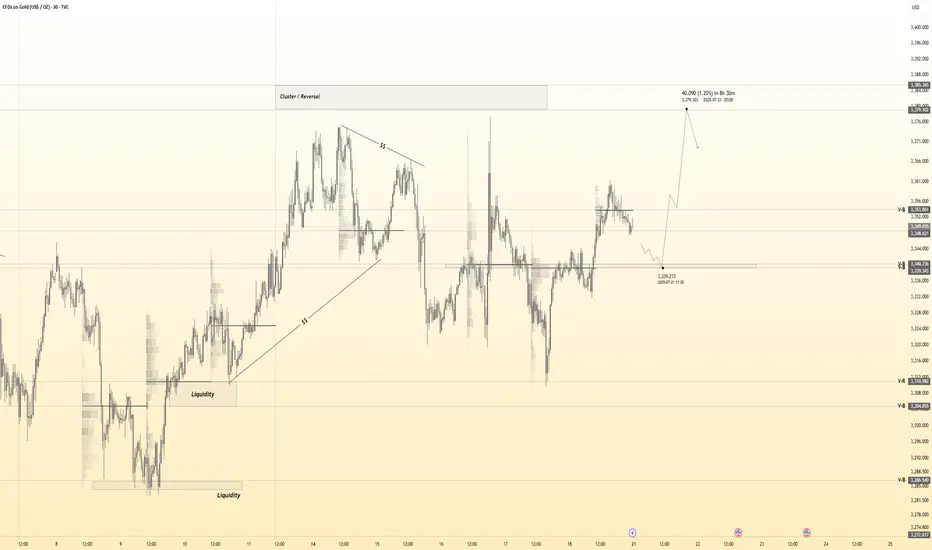
XAU/USD – Likely Wave ⑤ Top In – ABC Correction in Progress!OANDA:XAUUSD
✅ We’ve most likely completed our (Circle) Wave ⑤, and are now entering the first corrective wave of an ABC pattern (marked in 🟡 yellow brackets).
🔹 The (A) wave unfolded as a clean white ABC correction – textbook structure, worked out perfectly.
🔹 From (A) to (B) we saw an impulsive move (likely a 1-2-3-4-5, though not labeled).
🔻 From (B), a strong bearish move broke right through our 🔴 ascending trendline, signaling a potential trend reversal.
👉 We’ve likely completed wave 1 of the new downtrend and are now in a corrective move upward, forming yellow wave 2:
🟡 (A) – (B) – (C), with the (B) once again forming an internal ABC structure.
🎯 We’re now watching for the completion of wave C – this will complete yellow wave 2.
📐 The target zone (TP) lies in the yellow Fibonacci retracement area, with a key level at the 78.6% retracement (marked in white).
🛑 Stop Loss should be placed above the 4-month zone, or just above wave (B).
📊 The Take Profit will be more precise once the top of wave C is confirmed – but expect it to align closely with the 🔵 Fibonacci extension zone.

Bullish continuation?The Gold (XAU/USD) is falling towards the pivot and could bounce to the 1st resistance.
Pivot: 3,390.13
1st Support: 3,356.66
1st Resistance: 3,491.05
Risk Warning:
Trading Forex and CFDs carries a high level of risk to your capital and you should only trade with money you can afford to lose. Trading Forex and CFDs may not be suitable for all investors, so please ensure that you fully understand the risks involved and seek independent advice if necessary.
Disclaimer:
The above opinions given constitute general market commentary, and do not constitute the opinion or advice of IC Markets or any form of personal or investment advice.
Any opinions, news, research, analyses, prices, other information, or links to third-party sites contained on this website are provided on an "as-is" basis, are intended only to be informative, is not an advice nor a recommendation, nor research, or a record of our trading prices, or an offer of, or solicitation for a transaction in any financial instrument and thus should not be treated as such. The information provided does not involve any specific investment objectives, financial situation and needs of any specific person who may receive it. Please be aware, that past performance is not a reliable indicator of future performance and/or results. Past Performance or Forward-looking scenarios based upon the reasonable beliefs of the third-party provider are not a guarantee of future performance. Actual results may differ materially from those anticipated in forward-looking or past performance statements. IC Markets makes no representation or warranty and assumes no liability as to the accuracy or completeness of the information provided, nor any loss arising from any investment based on a recommendation, forecast or any information supplied by any third-party.

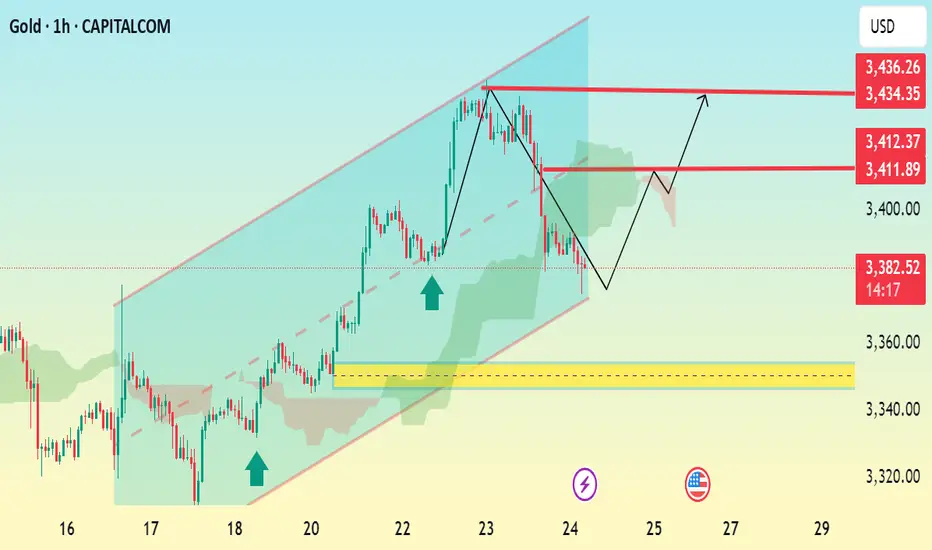
GOLD 1H Bullish Reversal AnalysisAnalysis Summary: Gold (XAU/USD) is currently trading at 3,383.75 and has shown a corrective move after reaching a recent high near 3,436.26. The chart indicates a bullish channel with support holding near the lower boundary of the channel.
Key Observations:
Price has pulled back sharply but respected the channel's lower trendline, suggesting a potential bullish reversal.
A bullish rebound is anticipated from the 3,360–3,370 zone, marked by the yellow support area.
Two key resistance levels are highlighted at 3,411.89 and 3,434.35.
The Ichimoku Cloud is thin ahead, suggesting less resistance for upward momentum.
Potential Trading Setup:
Entry Zone: Near 3,370–3,383 (support zone or on bullish confirmation).
TP1: 3,411
TP2: 3,434
SL: Below 3,360 (outside the channel and below yellow zone).
GOLD → Retest of trend support. Consolidation...GOLD is consolidating below the previously broken trend support. On Sunday, Trump announced a trade deal with the EU, which is putting pressure on the market along with the rising dollar...
Gold rebounded from support at $3310 after a week-long low, interrupting a three-day decline amid profit-taking. However, the overall downtrend remains intact as markets brace for a busy week with the release of US GDP data and the Fed's decision. Optimism surrounding US-China trade talks and the US-EU framework agreement is reducing demand for safe-haven assets. Additional pressure on gold is coming from easing geopolitical tensions: Thailand and Cambodia have agreed to ceasefire talks. The metal's recovery may be short-lived.
Technically, we have global and local bullish trends, against which gold is testing support, but as we can see, buyers are trying to hold back the decline due to uncertainty over interest rates. There is a chance that we will see active action by the Fed, behind which lies a rate cut, this week...
Resistance levels: 3345, 3375
Support levels: 3320, 3287
At the moment, I do not see a proper reaction to the support breakout. The price is consolidating after confirming the key trigger at 3345. Thus, if the price starts to return to 3345, test and consolidate above the level, we will have a chance for growth. I do not rule out a liquidity grab from 3325 (false breakout) before the rise.
BUT! The structure will be broken if the price breaks 3325 - 3320 and begins to consolidate below this zone. In this case, gold may fall to 3287
Best regards, R. Linda!

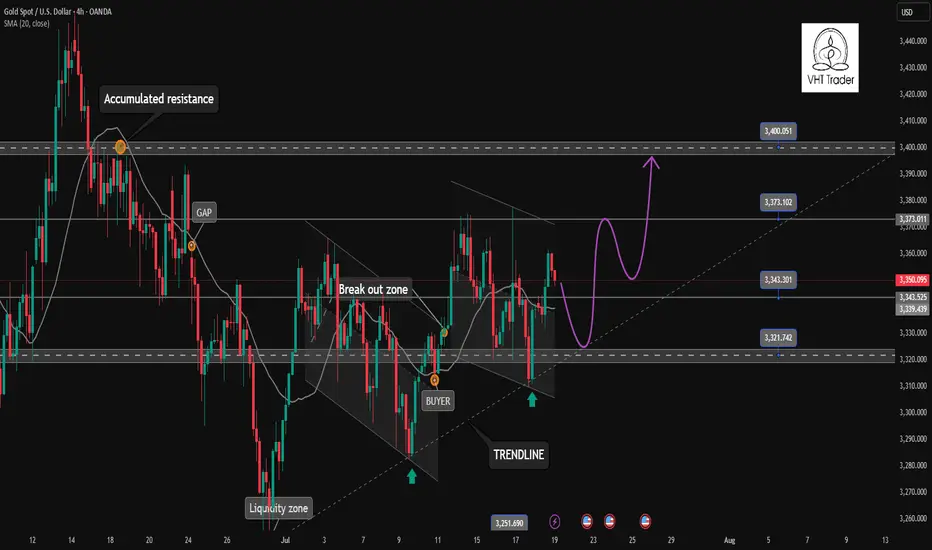
Gold Outlook – The Range Holds, Direction Still Pending📆 What happened recently?
Since the middle of last week, I’ve been repeating the same core idea like a broken record:
👉 “Gold needs to break out of the range to define its next real move.”
And once again, on Friday, TRADENATION:XAUUSD respected the structure, fluctuating quietly and closing the week right in the middle of the range — no breakout, no confirmation.
📈 Current status:
The new week opened with some bullish interest, and at the time of writing, Gold trades around 3363. Still inside the box.
So far, no technical change, and certainly no resolution.
❓ What am I watching for?
A clear break above 3375 → confirms bullish continuation
A decisive break below 3320 → confirms reversal potential
Until then, everything in between is noise and chop.
🧭 Trading plan:
My stance remains unchanged:
⏳ No position. No bias. Just waiting.
Once we get confirmation in either direction, I’ll take action.
📌 Conclusion:
Gold is still locked inside the range. The market is coiling, but no side is winning yet.
Patience here is a weapon — and I’m keeping it loaded. 🚀
Disclosure: I am part of TradeNation's Influencer program and receive a monthly fee for using their TradingView charts in my analyses and educational articles.
XAUUSD Breakout Structure | Smart Money Bullish Roadmap 🚨 XAUUSD 2H | Smart Money Concept Setup
Price perfectly tapped into demand zone and showed a strong bullish reaction — now forming a clear BOS (Break of Structure).
📍 Key Liquidity Zones:
• Price swept previous lows and is now targeting major liquidity levels marked as “Target Points.”
• Bullish momentum is expected to push price towards 3410 – 3425 range 📈
🔁 Expect possible consolidation before a continuation to upper targets.
💡 Strategy:
Wait for a minor pullback near the 3380–3390 level for confirmation, then ride the momentum to higher targets.
🎯 Target Levels:
1. 3398 ✅
2. 3410 🚀
3. 3425+ (Final Target)
📌 Like, Follow & Save if you caught this early 📊
#XAUUSD #SMC #LiquidityGrab #GoldSetup #TradingViewIdea #SmartMoney #Breakout

Gold in Demand Zone | Target $3,380🚨 GOLD/USD – BIG MOVE LOADING! 🚨
🔍 Price is currently reacting from a major demand zone ($3,340–$3,345) with signs of accumulation and a possible double bottom pattern forming.
📉 After a strong downtrend, this looks like a liquidity sweep and smart money trap — prepping for a reversal back to the $3,380 resistance zone where liquidity resides.
📈 Scenarios to Watch:
1️⃣ Price sweeps support again and reverses hard
2️⃣ Clean structure break above $3,365, followed by a retest
🎯 Target: $3,380–$3,385
🛡️ Invalidation: Strong close below $3,335
⚠️ Confirmation Required! Best entry would be after structural break + retest. Keep your risk tight, and let the market show its hand.
⸻
📌 Key Levels:
• Support Zone: $3,340–$3,345
• Target Zone: $3,380–$3,385
• Invalidation: Below $3,335
⸻
📣 If this setup helps you, like 👍, comment 💬, and follow 🔔 for more high-probability ideas every week!
#Gold #XAUUSD #SmartMoney #LiquidityGrab #ForexSetup #PriceAction #BreakoutTrade #DoubleBottom #TradingView #GoldAnalysis #ForYou #FXStrategy #SupplyAndDemand

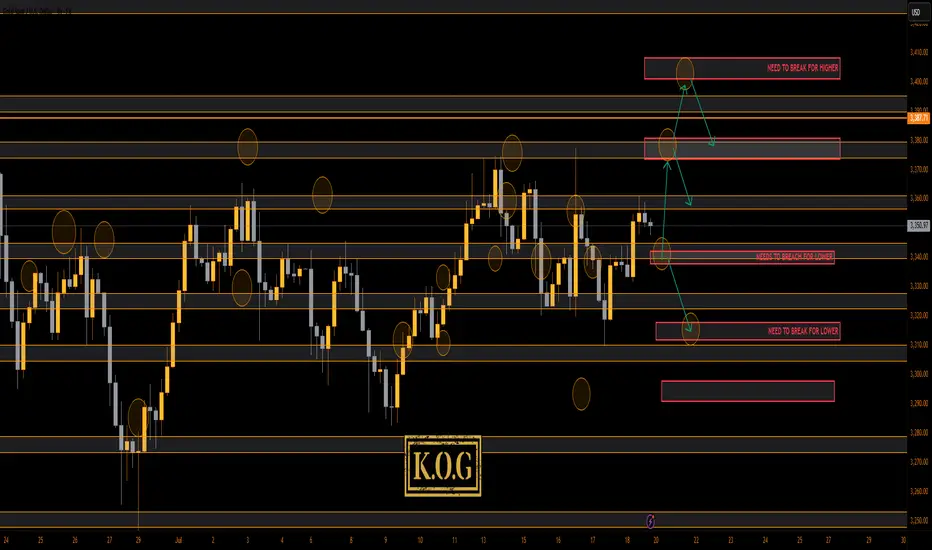
THE KOG REPORT THE KOG REPORT:
In last week’s KOG Report we said we would be looking for a price to attempt the higher level red box sitting around the 3370-75 region and if not breached, we felt an opportunity to short would be available from that region. We said if that failed and the move commenced, we would be looking at a complete correction of the move back down into the 3330-35 region, where we would then monitor price again in anticipation of a long from there or the extension level of 3310 which was also a red box short target (move complete). As you can see from the above, not only did we get that higher red box, we rejected, completed the move downside and then our traders managed to get that long trade all the way back up into the Excalibur target, red box targets and the hotspots shared in Camelot.
A decent week again, not only on Gold but also the numerous other pairs we trade, share targets on and analyse.
So, what can we expect in the week ahead?
For this week we can expect more ranging price action, but due to the previous range from last week being so tight, it looks like we’ll see a breakout coming in the latter part of the week unless there is news to bring us unexpected volume.
We have the key level below 3335-40 support and above that resistance and a red box sitting at 3375-80. This is the region that needs to watched for the break, and if broken we should hit the range high again at 3400-10. However, if rejected, we could again see this dip to attack that lower order region 3310-6 before attempting to recover.
Last week we wanted to see that curveball and although we did see some aggressive price action, I think we will see something extreme for this week. It’s that lower level 3310-6 that is a key region for bulls, if broken we can see a complete flush in gold taking us down into the 3250’s before we start the summer run. That for us would be the ideal scenario going into the month end, but, we’ll play it how we see and as usual, we go level to level and update any changes as we go along.
KOG’s Bias for the week:
Bullish above 3340 with targets above 3355, 3361, 3368, 3372 and above that 3385
Bearish below 3340 with targets below 3335, 3330, 3322, 3316, 3310 and below that 3304
RED BOX TARGETS:
Break above 3350 for 3355, 3361, 3367, 3375 and 3390 in extension of the move
Break below 3340 for 3335, 3330, 3320, 3310 and 3306 in extension of the move
Please do support us by hitting the like button, leaving a comment, and giving us a follow. We’ve been doing this for a long time now providing traders with in-depth free analysis on Gold, so your likes and comments are very much appreciated.
As always, trade safe.
KOG
Gold : Holding Ground Below 3345 Amid USD SurgeGold : Holding Ground Below 3345 Amid USD Surge
Gold's upward potential from Friday appears limited by the 3345 level—a narrow but firm resistance zone. As long as price fails to break above it, this zone has a high importance.
If gold holds below 3345, the probability of further downside increases significantly.
Meanwhile, the recent US–EU agreement has strengthened the USD. While this isn’t expected to severely impact gold, short-term fluctuations can’t be ruled out.
If price stabilizes in the red zone, it may consolidate ahead of the upcoming FOMC meeting. In such cases, volatility could erupt based on news-driven catalysts—so be prepared for unexpected moves.
You may find more details in the chart!
Thank you and Good Luck!
PS: Please support with a like or comment if you find this analysis useful for your trading day

Gold returns to its original nature. Price increase towards 3400✏️ OANDA:XAUUSD is back to its inherent uptrend. Currently trading in a wide range. Shaped by CPI news last week. Trendline is still supporting Gold price towards 3400 next week. Pay attention to the important zone 3373 to DCA BUY and do not SELL when breaking this important zone 3373. Effective trading strategy is to wait for Gold to correct and buy.
📉 Key Levels
Support: 3343 - 3322
Resistance: 3373-3400
Buy Trigger: Rejects the support zone 3343 and reacts to the upside
Buy Trigger: Rebound from 3322
Target 3400
Leave your comments on the idea. I am happy to read your views.
GOLD - SHORT TO $2,800 (UPDATE)Price has pushed up as expected back into the $3,400 zone, where we had a lot of pending liquidity that needed to be wiped out. Now that liquidity is collected I am patiently waiting for some form of 'distribution price action' to play out, before I consider selling. Until then I'm sitting on the sideline.
If Gold takes out Wave 2 high ($3,451) then bearish structure is invalidated & we can start looking at buy trades.

Sell Reversal We have QML and price broke structure to the downside on a daily TF and price retraced back to premium price ... Possible Strong sell

GOLD (XAUUSD): Bearish Move From Resistance Confirmed
Gold tested a significant confluence cluster on a daily time frame
that is based on a rising trend line and a horizontal resistance.
A double top formation on that on an hourly time frame indicates
a highly probable retracement from that.
Goal - 3378.5
❤️Please, support my work with like, thank you!❤️
I am part of Trade Nation's Influencer program and receive a monthly fee for using their TradingView charts in my analysis.

XAUUSD Bullish Setup | Liquidity Grab to Breakout📊 XAUUSD Bullish Breakout Plan | Price Action + Key Levels Analysis 🔥
Gold (XAUUSD) is currently holding above a strong support-turned-resistance zone around $3,340 - $3,345. After a clear rejection from the support area and a bullish structure forming, price is showing potential for a clean breakout toward higher targets.
🔍 Key Technical Highlights:
• Support Area: $3,310 - $3,320 held strongly
• Resistance Flip: $3,345 zone acting as new demand
• Target 1: $3,375
• Target 2: $3,390 major liquidity zone
• Structure: Bullish W pattern forming above demand
This setup favors buy on retracement, aiming for breakout above recent highs. Wait for a confirmation candle above resistance before entering.
📈 Watch for liquidity grab and strong bullish impulse.
#XAUUSD #GoldAnalysis #SmartMoney #BreakoutSetup #LiquidityHunt #ForexTrading #TechnicalAnalysis #BuySetup #PriceAction #TradingView #GoldSetup #ForYou

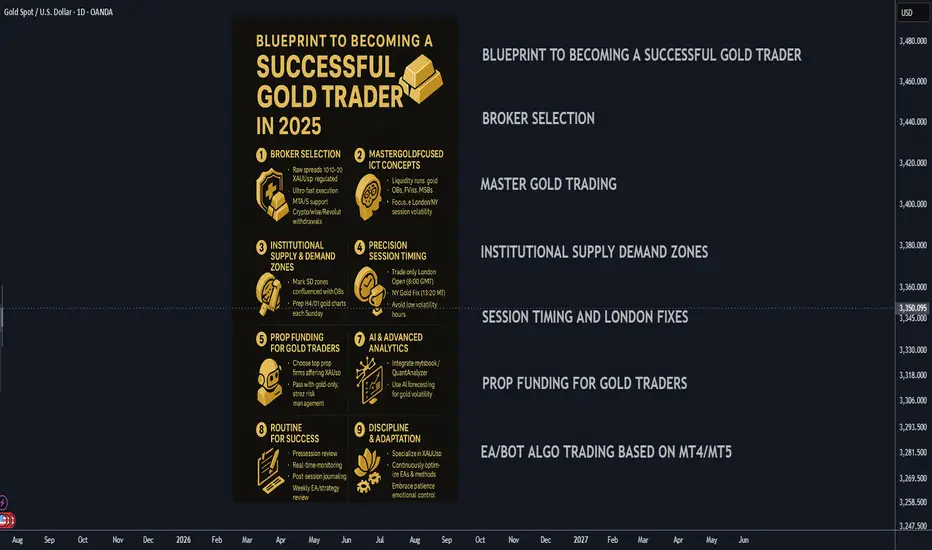
Blueprint to Becoming a Successful Gold Trader in 2025🚀 Blueprint to Becoming a Successful Gold Trader in 2025
A strategic, step-by-step plan to master gold trading by combining institutional concepts, cutting-edge automation, and the best prop funding opportunities for XAUUSD.
________________________________________
🏦 Broker Selection (Gold-Specific)
• 🔍 Choose Brokers Offering Raw Spread XAUUSD Accounts:
Seek brokers with raw/zero spread gold trading or tight gold spreads (0.10-0.30 average) with deep liquidity.
• ⚡ Prioritize Ultra-Fast Execution for Metals:
Confirm broker servers are in NY4/LD4 and latency is optimized for gold volatility spikes.
• 🛡️ Verify Regulation & Execution:
ASIC, FCA, FSCA preferred; check for proof of XAUUSD execution quality (Myfxbook/FXBlue verified).
• 📊 MetaTrader 4/5 Gold Support:
Ensure MT4/5 platform offers tick-chart precision for gold and supports custom EAs/indicators.
• 💳 Flexible Withdrawals/Payouts:
Crypto, Wise, and Revolut compatibility for fast, secure funding.
________________________________________
🎯 Gold Trading Strategy (ICT + Supply/Demand Zones)
• 🧠 Master Gold-Adapted ICT Concepts:
o Liquidity runs and stops at London/NY session highs/lows
o XAUUSD-specific Order Blocks (OBs), FVGs, and Market Structure Breaks (MSB)
• 📍 Map Institutional Supply-Demand Zones:
Gold reacts violently to these—align SD zones with ICT Order Blocks for best confluence.
• 📐 Precision Entries:
Only enter after liquidity sweeps at key XAUUSD levels (H4/D1), avoiding choppy retail entries.
• 📈 Time & Price for XAUUSD:
Focus exclusively on London Open (8:00 GMT) and NY Open/Gold Fixing (13:20 GMT)—peak volatility windows.
• 📆 Weekly Preparation:
Annotate D1/H4 gold charts every Sunday with clear OBs, liquidity points, and SD zones for the week.
________________________________________
💰 Prop Funding for Gold Trading
• 🥇 Select Firms Offering XAUUSD with Tight Rules:
Choose FTMO, The Funded Trader, MyFundedFX, or similar with high leverage and XAUUSD trading enabled.
• 📑 Pass Evaluation with Gold-Only Strategy:
Use high-probability, low-frequency XAUUSD trades—1-3 setups per week, strict risk parameters.
• 🎯 Risk Management:
Max 1% risk/trade, stop trading after 2 consecutive losses—protect account and pass evaluations.
• 📊 Analytics Monitoring:
Use prop dashboards (FTMO Metrics, FundedNext stats) to review XAUUSD trade stats and adjust.
• 📚 Diversify Funded Accounts:
Split funded capital among multiple firms to hedge against firm-specific risk and maximize payouts.
________________________________________
⚙️ Automating Gold Trading (MT4/5 EAs & Bots)
• 🛠️ Hire MQL4/5 Developers for XAUUSD EAs:
Code bots focused on gold-specific ICT (OBs, FVGs, London/NY volatility).
• 🤖 Develop EAs for Gold:
o OB/FVG/Market Structure detection on XAUUSD
o Supply/Demand zone algo entries
o Gold breakout EAs for session openings
• 📌 Trade Management Automation:
o Entry, stop loss, partial TP, BE, trailing for gold’s high volatility
o Dynamic lot-sizing by daily ATR
• 📡 VPS Hosting Near Broker’s Gold Server:
Use NY4/LD4 VPS for lowest latency (ForexVPS, Beeks).
• 📈 Quarterly Forward-Testing:
Optimize EAs in demo before live trading, retest on every major gold volatility shift (FOMC, CPI).
________________________________________
📲 Leveraging Bots & AI in 2025
• 📊 Integrate with MT4/5 Analytics Tools:
Use myfxbook, QuantAnalyzer for detailed gold trade breakdowns.
• 🔮 AI-Based Gold Forecasting:
Layer in machine learning models (e.g., TensorTrade, TradingView AI) to anticipate session volatility and direction.
• 🔔 Real-Time Alert Bots:
Set up Telegram/Discord bots for instant notification of ICT-based XAUUSD signals.
• 🧑💻 Manual Oversight:
Always review high-impact news (NFP, CPI, FOMC) and override automation when macro risk spikes.
• 🔄 Continuous Bot Updates:
Retrain your EAs monthly on latest XAUUSD price action to maintain edge.
________________________________________
🗓️ Daily Gold Trader Routine
• 🌅 Pre-Session (30 mins):
Review annotated gold charts, key session highs/lows, OB/FVG/SD levels, and upcoming news.
• 💻 During Session:
Monitor bot execution, validate setups manually, manage risk during NY/London overlap.
• 📝 Post-Session (15 mins):
Journal gold trades, note reasoning for entry/exit, emotional state, and lessons learned.
• 📆 Weekly Review:
Assess overall gold trading stats and EA performance, adjust strategy as needed.
• 📚 Continuous Learning:
Stay updated on ICT, gold market fundamentals, and new trading tech.
________________________________________
📌 Final Success Advice for 2025
• 🔍 Specialize in XAUUSD/Gold—Don’t Diversify Randomly:
Depth > Breadth—become a true gold trading expert.
• 🚩 Keep Adapting Your Gold Trading EAs:
Markets change—so must your bots and playbooks.
• 🧘 Stay Patient, Disciplined, and Selective:
Gold rewards precision and patience, not overtrading.
• 💡 Embrace AI & Automation:
Leverage every tool: AI, analytics, and custom EAs for a real 2025 trading edge.