Gold analysis WednesdayHello guys today I update the gold price action analysis, some parts of my journey and plan, and how we must prepare for every scenario that would come. Thankyou for watching
XAUUSDK trade ideas

350pips Secured — Focus Shifts to Dip-Buying StrategyToday's trading was very successful, and the grasp of the long and short rhythm was very accurate. Today's trading situation is as follows:
1. Close the short position with an overnight entry price of around 3386 near 3380, with a loss of 60 pips, and the loss amount exceeded $6K;
2. Directly short gold near 3380, manually close the position near 3366, profit 130pips, profit amount exceeded $12K;
3. Long gold near 3356, hit TP: 3372 and end the transaction, profit 160pips, profit amount exceeded $8K;
4. Long gold near 3362, hit TP; 3375 and end the transaction, profit 120pips, profit amount exceeded $6K.
Intraday trading summary: Today, the long and short sides completed a total of 4 transactions, one of which suffered a loss, but the net profit was 350pips, and the profit amount exceeded $20K. For short-term trading, I think I can submit a satisfactory answer to myself today!
How to execute the transaction next? Gold started to pull back from around 3438 and has now reached a low of around 3351, with a retracement of more than 870pips. The retracement space is not small. However, gold has stabilized above 3350 and has started a technical rebound repair, and the upward force is not weak, so gold may have completed the retracement. Under the support of these two technical conditions, gold may regain its upward momentum and hit 3400 again.
At present, the short-term resistance is obvious, located in the area near 3380. Once gold breaks through 3380, gold will inevitably continue to rise and hit 3400 again; but I think as long as gold stabilizes above 3350, it is not difficult to break through the short-term resistance of 3380, so gold will inevitably test the 3400 mark again; and the short-term support below is in the 3365-3355 area. Gold may still retreat to this area first during the rise in order to increase liquidity and accumulate momentum, helping gold to break through 3380 more easily.
So for the next short-term trading, I think it is feasible to go long on gold in the 3365-3355 area, first looking at the target area of 3380-3390, and then 3400.

GOLD - Important Breakout !Hello Traders !
The Gold price formed an ascending triangle pattern.
Currently, The resistance level is broken!
So, I expect a bullish move🚀
_______________
TARGET: 3414🎯

XAU/USD) Bullish trend analysis Read The captionSMC Trading point update
Technical analysis of Gold (XAU/USD) on the 1-hour timeframe. Here's a breakdown of the key trading
---
Technical Overview
Price: $3,428.71 (currently near the upper consolidation)
EMA 200: Around $3,367.38 (well below price, indicating strong uptrend)
Target Point: $3,468.52
Indicators:
RSI (14): 60.19–62.55 → shows moderate bullish momentum, not yet overbought.
---
Key Technical Elements
1. Bullish Breakout Structure:
Price has broken out of a previous range, and is forming a bullish flag or rectangle, which typically leads to continuation higher.
Measured move projection from previous leg (approx. $51.57 gain) targets the $3,468.52 level.
2. Strong Support Zones:
Two yellow zones highlighted:
Upper support level (around $3,415): acting as immediate structure support.
Lower key support (around $3,380): crucial structure level from where the trend initiated.
3. Trend Line Support:
A clearly marked ascending trend line supporting higher lows—indicating bulls are in control.
Expect price to stay above this trend line to maintain bullish bias.
4. Volume & RSI Confirmation:
RSI remains in a bullish zone but isn’t overbought → leaves room for upside.
Volume remains steady, confirming healthy consolidation.
Mr SMC Trading point
---
Conclusion & Trade Idea
Bias: Bullish
Entry Zone: On breakout or retest of minor support ($3,415–$3,420)
Stop Loss: Below trendline or below $3,415
Target: $3,468.52
Confirmation: Hold above trendline + RSI staying above 50
This is a classic bullish continuation setup supported by structure, RSI, and trend momentum. Traders could look for buying opportunities on minor dips or trendline retests.
---
Please support boost 🚀 this analysis)

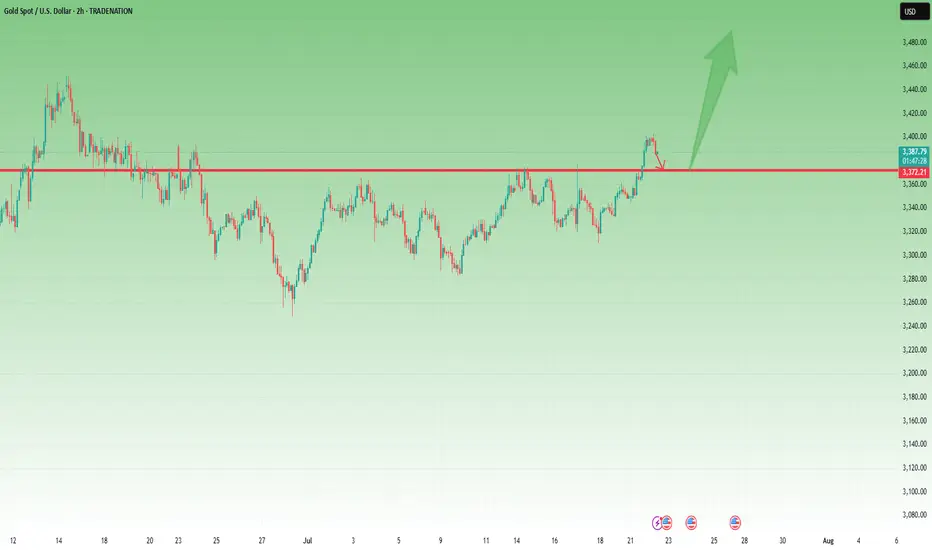
Gold - Above 3370 Is Bullish Territory – But 3360 Must Hold📆 What happened yesterday?
After more than a week of frustrating, sideways price action, Gold finally broke out above the key 3370 resistance zone.
The breakout was clean and impulsive, with TRADENATION:XAUUSD pushing to an intraday high around 3400.
Following that move, price printed a small double top near the high and began a modest correction — perfectly normal after such a breakout. At the time of writing, Gold trades at 3385, still holding above former resistance.
📈 Why this breakout matters:
The daily close at 3396 came in strong and near the top, leaving behind a clear Marubozu candle
This kind of price action signals conviction and momentum
The breakout confirms what I’ve been anticipating for days — the range is resolved, and the market is choosing the bullish path
🎯 What to expect next:
If price stabilizes above 3400, the road to 3450 opens — which is the target mentioned in my previous analyses
That area represents the next major resistance and likely magnet for price if bulls stay in control
🧭 Trading Plan:
For me, the plan is now simple:
✅ Buy the dips — especially on a potential retest of the 3370–3375 broken resistance, which now turns into support
❌ Negation comes only with a daily close below 3360, which would invalidate this breakout and raise questions
📌 Conclusion:
The breakout has finally come. After days of coiling, Gold chose the upside.
Momentum is building, structure is clean, and bulls are back in control — unless 3360 fails.
Until then, I remain bullish, looking to buy dips into strength. 🚀
Disclosure: I am part of TradeNation's Influencer program and receive a monthly fee for using their TradingView charts in my analyses and educational articles.
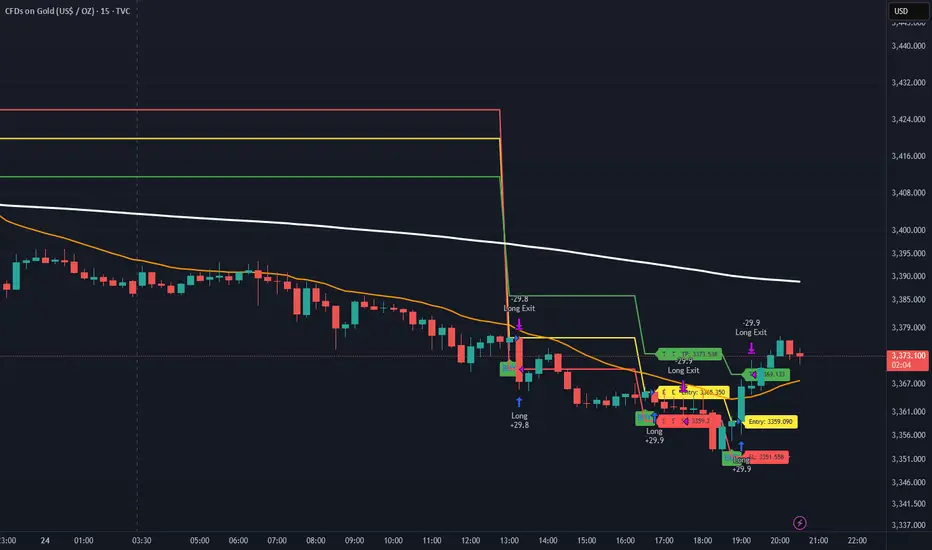
XAUUSD Chart Analysis: Bullish Flag PatternBased on the provided XAUUSD chart, a classic bullish flag pattern appears to be forming on a short-term timeframe. This is a continuation pattern that suggests a potential resumption of the prior uptrend.
Here's a breakdown of the pattern's components:
The Flagpole: The pattern begins with a strong and rapid upward price movement, which forms the "flagpole." This sharp rally is visible around the 21:00 mark on the chart, indicating strong buying pressure.
The Flag (Consolidation): Following the flagpole, the price has entered a period of consolidation. This forms the "flag," which is characterized by the price action moving downward within a well-defined parallel channel or falling wedge. The two white trendlines neatly outline this corrective phase.
Potential Breakout: The price is currently testing the upper trendline (resistance) of the flag. A bullish flag pattern is confirmed when the price breaks decisively above this upper trendline.
Interpretation and Potential Trade:
Continuation Signal: A breakout would signal that the consolidation period is over and the initial bullish momentum is likely to continue.
Price Target: The "Long Position" tool on the chart illustrates a potential trade based on this pattern. Typically, the target for a flag pattern is measured by taking the height of the flagpole and adding it to the breakout point. The tool projects a take-profit level around 3,395.538.
Risk Management: The tool also indicates a potential stop-loss placed below the low of the flag (around 3,364.496), which is a common strategy to manage risk if the pattern fails.
In summary, the chart shows a pause in an uptrend. Traders will be watching for a confirmed breakout above the flag's resistance to anticipate further upward movement in XAUUSD.

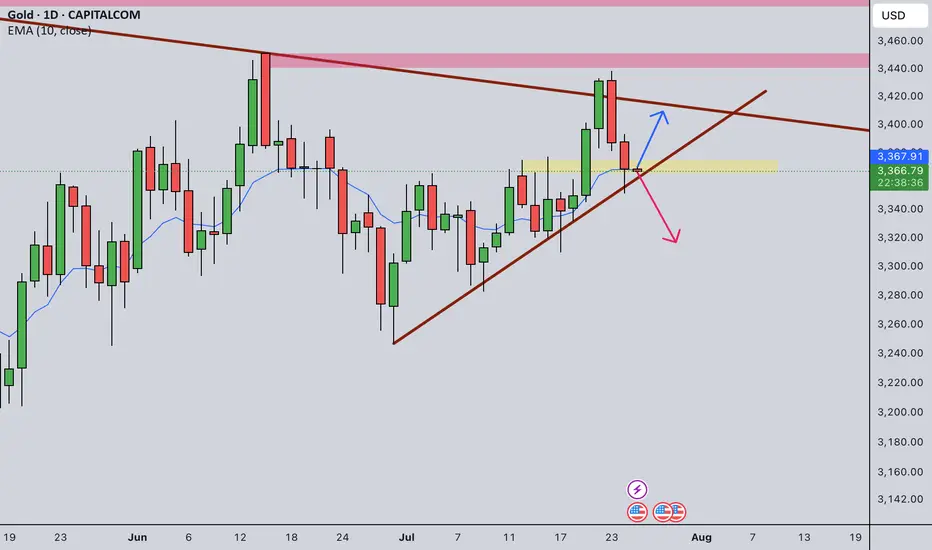
Gold Intraday Trading Plan 7/25/2025Gold closed the day right at the 3365-3373 support which was the previous resistance. It is also just at the EMA line. Yesterday it also tested the trendline support. The situation is very tricky right now. It seems it is testing the supports and trying to break down. I will be cautious to engage buying orders today.
If I see it rejecting the supports again, I will engage buying orders. Alternatively, if the trendline is broken, I will engage selling orders.
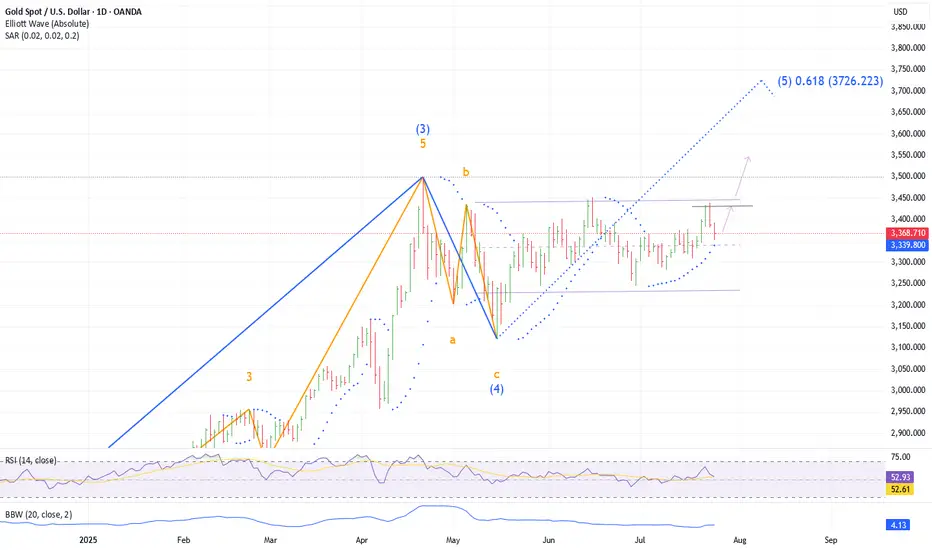
Gold Set to Continue RallyExpect gold to snap back to 3431 and likely much higher in the next day or two. Any recent gold downdraft was quick, prices shooting back up to the highs. Long term trends are too powerful. While Gold could drop down to the 3100 range completing an A-B-C for Wave 4, I think we are already in wave 5. A quick move to 4,000 would stun many but for those who see much much higher prices, 4,000 just might be a level to start getting people's attention.
Gold forming triangle patterenGold is currently consolidating within a symmetrical triangle pattern, signaling a potential breakout setup as price coils tighter between converging support and resistance trendlines.
CMP: Around $ 3370 (adjust based on your exact chart)
Lower highs & higher lows = compression zone
Volume declining, typical before breakout
Break above upper trendline could signal continuation toward 4000
Break support may lead to retest of $2985
This setup reflects indecision in the market — waiting for a decisive breakout with volume to confirm direction.

Gold : Sell Continuation Gold: Top Formed at Major Supply Zone 🔻 | 4H Reversal Setup
Looking for continuation after bearish BOS. Targeting clean liquidity below. SL above structure. R:R ~3:1

SellRejection Level
Daily Volume
Market Structure Shift
London Session
Trend Line Break
Untapped Order Point

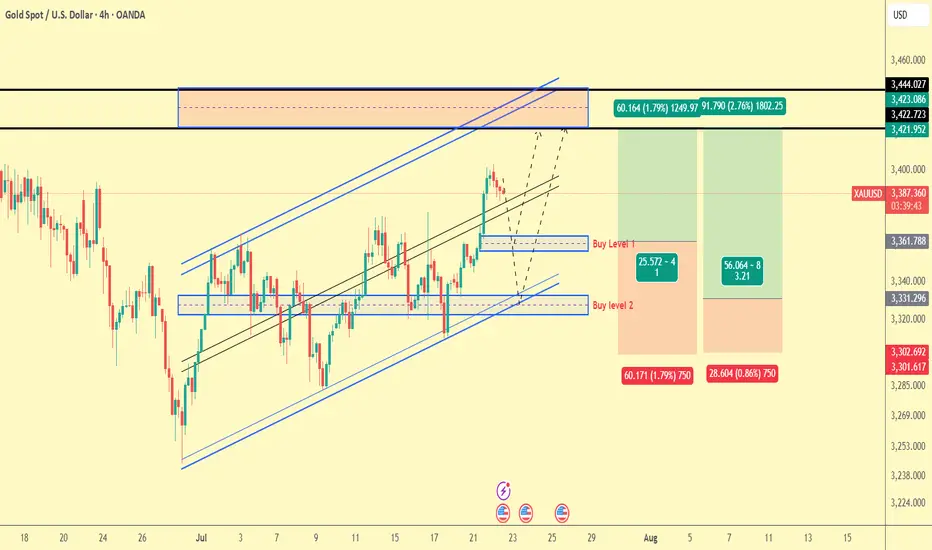
Gold Trade plan 22/07/2025Dear Traders,
The price is currently moving towards the upper boundary of the channel. The areas where it could potentially rise again are the 3360 zone and the 3320 zone, which is the lower boundary of the upward channel. The first area I have in mind is the 3360 zone, and the second area, 3325-3330, which is more attractive for buying. In the first area, there is a high likelihood that the price will react, but the risk-to-reward ratio is better in the second area.
Regards,
Alireza!
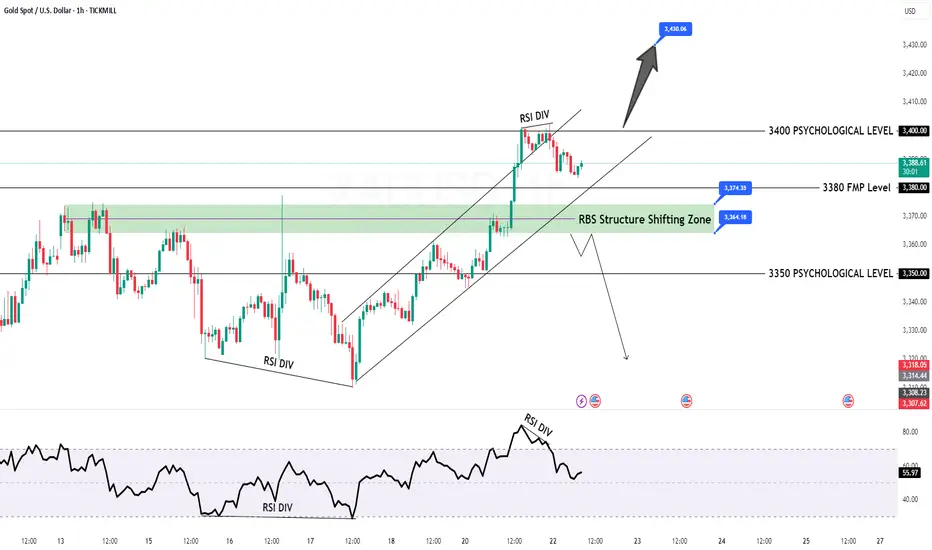
GOLD Intraday H1 Chart Update For 22 July 2025Hello Traders,
Today we have FED Chair Powell Speech ahead
all eyes on 3400 Psychological Level Break for now, if market successfully breaks 3400 then it will move towards 3435
below 3400 it will move back towards 3350 level
Disclaimer: Forex is Risky
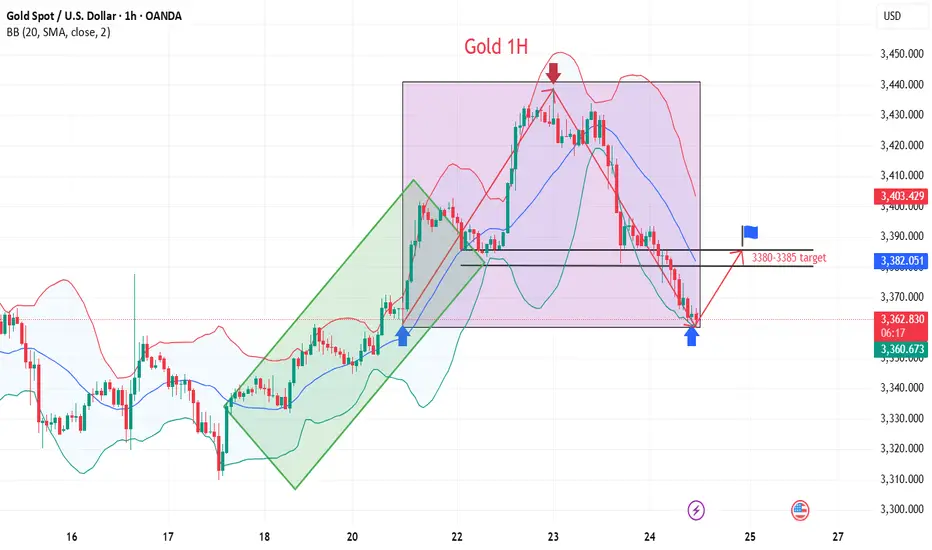
Lingrid | GOLD Price Correction or Continuation ?The price perfectly fulfilled my last idea . OANDA:XAUUSD has completed an A-B-C bullish movement within the rising structure and is now testing a key resistance zone near 3,387. With momentum fading near the upper boundary, a potential correction toward the 3,367 area is likely before any further advance. A bounce from the SWAP zone may trigger renewed upside toward the 3,430 resistance. Price action remains bullish above the higher low and broken triangle pattern.
📉 Key Levels
Buy trigger: Rebound from 3,367
Buy zone: 3,355–3,370
Target: 3,430
Invalidation: Break below 3,342
💡 Risks
Deep correction below key structure
Failure to reclaim resistance after retest
Sudden shift in macroeconomic sentiment
If this idea resonates with you or you have your own opinion, traders, hit the comments. I’m excited to read your thoughts!

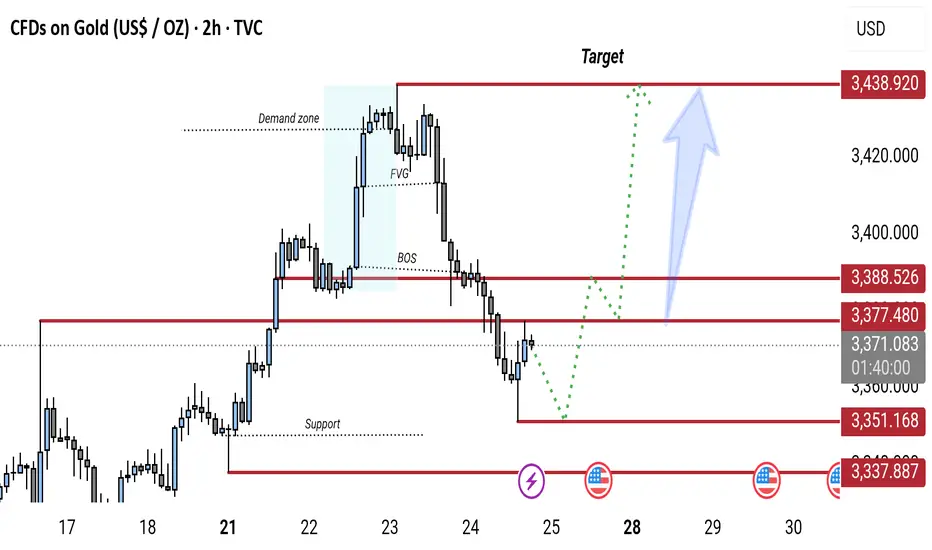
Gold 2H Chart: Bullish Reversal Expected from Key Support ZoneGold (XAU/USD) 2H chart shows a bearish break of structure (BOS) followed by a pullback toward a key support zone (around 3,337–3,351). A potential bullish reversal is expected from this zone, targeting the 3,438 resistance level. The chart highlights a demand zone, FVG (Fair Value Gap), and possible retracement before continuation to the upside.
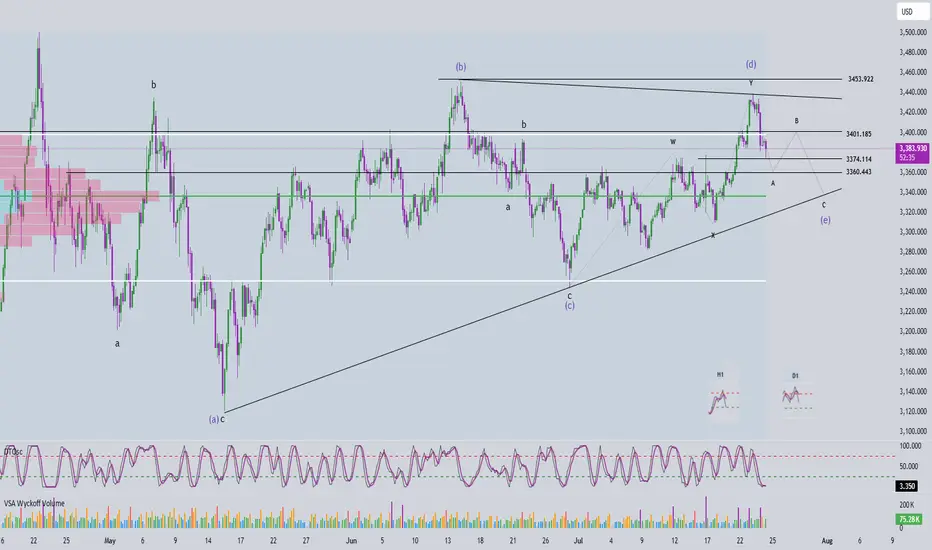
Elliott Wave Analysis – XAUUSD July 24, 2025📊
________________________________________
🔍 Momentum Analysis:
• D1 Timeframe: Momentum is currently in a downtrend, indicating that the dominant trend in the short term (at least until early next week) is likely to remain bearish or sideways.
• H4 Timeframe: Momentum has entered the oversold zone and is showing signs of a potential bullish reversal. This suggests that a corrective upward move may occur today.
• H1 Timeframe: Momentum is still declining and is expected to need around two more H1 candles before entering the oversold zone, implying that one more leg down may occur before a recovery begins.
________________________________________
🌀 Elliott Wave Structure Update:
Yesterday’s expectation of a breakout above the resistance zone at 3453 to confirm the start of a new bullish trend did not materialize. Instead, price dropped to the 3374 region, opening up two primary scenarios:
✅ Scenario 1: The correction is still unfolding
• Wave (d) in blue appears to be complete.
• The current leg is likely wave (e), the final leg in a contracting triangle correction.
• In this case, the lower boundary of the triangle and overlapping support zones will serve as key levels to watch for the completion of wave (e).
✅ Scenario 2: Wave 1 of a new bullish trend has completed
• The current decline is wave 2 in a new bullish impulsive sequence.
• The objective here is to identify the bottom of wave 2 to prepare for a potential buy entry into wave 3, which is expected to be stronger and longer than wave 1.
📌 Key difference between the two scenarios:
• Scenario 1 → Wave (e) completes, followed by wave 1 of wave 5.
• Scenario 2 → Wave 2 completes, followed by a powerful wave 3 of wave 5.
________________________________________
🧩 Current Wave Structure:
• A five-wave bearish structure is currently unfolding on the chart.
• According to Elliott Wave Theory, corrective patterns do not typically form five-wave structures.
• Therefore, this is likely wave A in a zigzag (5-3-5) formation.
• Possible targets for wave 5 within wave A:
o Target 1: 3374 – current reaction zone.
o Target 2: 3360 – next significant support level.
________________________________________
📌 Combining Wave Structure with Momentum:
The D1 momentum is firmly bearish, reinforcing the view that the market is undergoing a larger ABC correction.
On the H4 timeframe, momentum is oversold and showing early signs of reversal, aligning with the potential formation of wave B — typically a weak, sideways upward move. The likely resistance zone for the end of wave B lies between 3401 and 3410.
Meanwhile, H1 momentum is still falling and not yet in the oversold zone, suggesting there may be one more move down to complete wave 5. The ideal target for this final leg is around 3360.
Summary:
• D1 bearish → confirms ongoing major correction.
• H4 oversold → supports a potential weak wave B.
• H1 still declining → wave 5 may complete around 3360 before a recovery begins.
________________________________________
💼 Suggested Trading Plan:
For traders with limited experience or those not yet confident in reading live market signals, a Buy Limit strategy at clear support levels is recommended:
• Buy Zone: 3362 – 3360
• Stop Loss: 3352
• Take Profit:
o TP1: 3384
o TP2: 3400
🎯 For experienced traders, it is advised to observe price action at the target support zones and look for real-time reversal signals to optimize entry timing.
XAUUSD Traders - Turn Chaos into Pips with This StrategyHello Traders,
Struggling to trade XAUUSD due to its high volatility? Taking small profits but suffering big losses?
We’ve got your back.
Introducing Gold Sniper — a high-probability strategy specially crafted for XAUUSD traders. With a 65%+ win rate and a consistent 1:1.33 risk-reward ratio, it’s designed to help you catch sharp moves with confidence.
🚨 Live Performance Highlights:
Today’s Trades:
Signal 1
🟢 Buy @ 3365.350
🔴 SL @ 3359.209
🟢 TP @ 3373.538
❌ Result: SL Hit → 61 Pips Loss
Signal 2
🟢 Buy @ 3359.090
🔴 SL @ 3351.558
🟢 TP @ 3369.133
✅ Result: TP Hit → 75 Pips Profit
📊 Net Profit Today: +13 Pips
📅 Yesterday’s Profit: +150 Pips
✅ Gold Sniper helps you:
• Avoid fake breakouts
• Catch real momentum
• Stick to disciplined entries and exits
🎯 Want to boost your trading accuracy?
📩 DM us now to get access and start using Gold Sniper directly on your TradingView chart.
If you find this valuable, like the idea and show your support. Let’s grow together!
Happy Trading,
InvestPro India
XAUUSD 15m trade possibilitty 7/21/25This is what I'm looking at for the short term after the recent rally.
I'm targeting the green area for buys because that was the last consolidation and breakout zone.

Gold failed to break through three times, short-term bearish?
💡Message Strategy
Gold's decline today means the second consecutive day of decline as investors turn their attention to more positive trade developments since yesterday.
However, gold still received buying support earlier this week and briefly broke through $3,400. This round of gains tested key resistance levels on the gold daily chart, but ultimately the bears held their ground.
This is the third time in nearly three months that gold has tried to break through the $3,430 to $3,435 resistance area, but all failed.
📊Technical aspects
Gold’s latest decline this week has brought the price back into a range-bound trading state between key hourly moving averages. This means that the short-term trend has become more neutral.
This shows that the upward momentum has clearly weakened and buyers need to regain short-term dominance before they can hope to challenge the key resistance area mentioned earlier again.
Currently, the 200 hourly moving average near $3,365 provides support to the downside. If the price can hold this level, it will indicate that buyers are still holding on and waiting for the next upside opportunity.
Combined with the current 1H chart trend analysis, there is still a great chance of a bullish pullback in gold in the short term.
💰Strategy Package
Long Position:3360-3365,SL:3340,Target: 3380-3400
Gold breaks trendline and returns to uptrend. BUY NOW!✏️ OANDA:XAUUSD A deep sweep to 3310 and bounce back to the trading range. Gold is reacting at the Trendline around the price zone of 3344. This is an important price zone that if broken will return to the uptrend and head towards 3373 soon. 3332 plays an important role in the current bullish wave structure, which is a suitable SL placement point for BUY signals.
📉 Key Levels
Support: 3332-3312
Resistance: 3344-3357-3373-3389
BUY trigger: Break and trading above Resistance 3344 (trendline, top uptrend wave 1)
BUY DCA trigger: Break Resistance 3353
Target 3373
Leave your comments on the idea. I am happy to read your views.

XAUUSD - Bullish Bias Holding StrongPair: XAUUSD (Gold)
Bias: Bullish
HTF Overview: Multi-timeframe structure aligned bullish. Market is in a clear uptrend across 4H and 1H, currently retracing toward key OB levels.
LTF Confirmation: Waiting on price to mitigate the 1H OB — once tapped, will drop to 15M and 5M for confirmation before any entries.
Entry Zone: 1H OB marked — setup strengthens if inducement or liquidity sweep occurs just before mitigation.
Targets: Short-term target is the previous high — extended target based on 4H continuation range.
Mindset Note: Alignment is there — now it’s about patience and waiting for execution clarity. Let price deliver the opportunity.
Bless Trading!

XAUUSD 2H | Smart Money Buy from Strong DemandXAUUSD 2H | Support Rejection with Upside Targets 🎯
Price respected the key support zone and is now showing bullish momentum. Two clear target levels are marked above. Ideal buy opportunity after rejection confirmation from demand zone. Watch for clean continuation toward 3370 and 3390.
#XAUUSD #GoldAnalysis #SmartMoneyConcepts #SMC #Forex #PriceAction #BuySetup

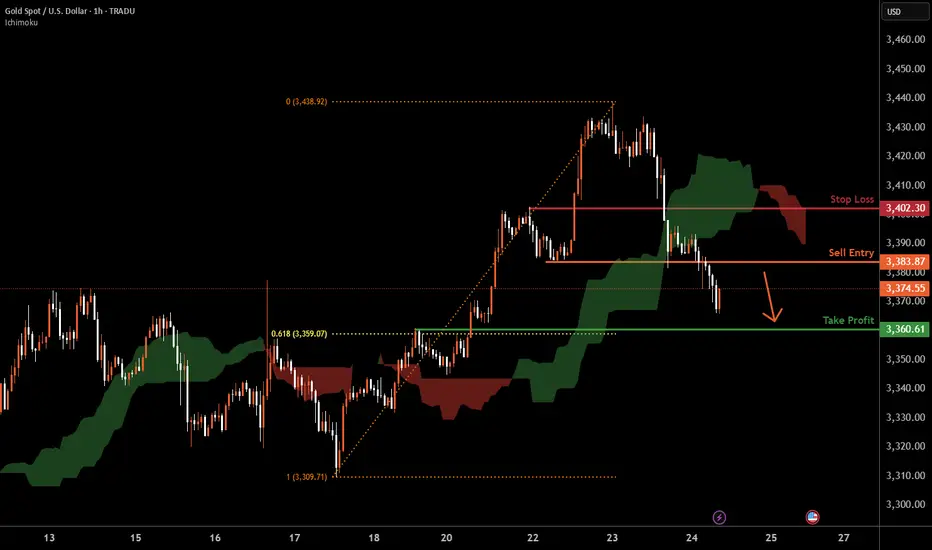
XAUUSD H1 I Bearish Reversal Based on the H1chart, the price is approaching our sell entry level at 3383.87, a pullback resistance.
Our take profit is set at 3360.61, a pullback support that aligns with the 61.8% Fib retracement.
The stop loss is set at 3402.30, a pullback resistance.
High Risk Investment Warning
Trading Forex/CFDs on margin carries a high level of risk and may not be suitable for all investors. Leverage can work against you.
Stratos Markets Limited (tradu.com ):
CFDs are complex instruments and come with a high risk of losing money rapidly due to leverage. 63% of retail investor accounts lose money when trading CFDs with this provider. You should consider whether you understand how CFDs work and whether you can afford to take the high risk of losing your money.
Stratos Europe Ltd (tradu.com ):
CFDs are complex instruments and come with a high risk of losing money rapidly due to leverage. 63% of retail investor accounts lose money when trading CFDs with this provider. You should consider whether you understand how CFDs work and whether you can afford to take the high risk of losing your money.
Stratos Global LLC (tradu.com ):
Losses can exceed deposits.
Please be advised that the information presented on TradingView is provided to Tradu (‘Company’, ‘we’) by a third-party provider (‘TFA Global Pte Ltd’). Please be reminded that you are solely responsible for the trading decisions on your account. There is a very high degree of risk involved in trading. Any information and/or content is intended entirely for research, educational and informational purposes only and does not constitute investment or consultation advice or investment strategy. The information is not tailored to the investment needs of any specific person and therefore does not involve a consideration of any of the investment objectives, financial situation or needs of any viewer that may receive it. Kindly also note that past performance is not a reliable indicator of future results. Actual results may differ materially from those anticipated in forward-looking or past performance statements. We assume no liability as to the accuracy or completeness of any of the information and/or content provided herein and the Company cannot be held responsible for any omission, mistake nor for any loss or damage including without limitation to any loss of profit which may arise from reliance on any information supplied by TFA Global Pte Ltd.
The speaker(s) is neither an employee, agent nor representative of Tradu and is therefore acting independently. The opinions given are their own, constitute general market commentary, and do not constitute the opinion or advice of Tradu or any form of personal or investment advice. Tradu neither endorses nor guarantees offerings of third-party speakers, nor is Tradu responsible for the content, veracity or opinions of third-party speakers, presenters or participants.