Gold in Demand Zone | Target $3,380🚨 GOLD/USD – BIG MOVE LOADING! 🚨
🔍 Price is currently reacting from a major demand zone ($3,340–$3,345) with signs of accumulation and a possible double bottom pattern forming.
📉 After a strong downtrend, this looks like a liquidity sweep and smart money trap — prepping for a reversal back to the $3,380 resistance zone where liquidity resides.
📈 Scenarios to Watch:
1️⃣ Price sweeps support again and reverses hard
2️⃣ Clean structure break above $3,365, followed by a retest
🎯 Target: $3,380–$3,385
🛡️ Invalidation: Strong close below $3,335
⚠️ Confirmation Required! Best entry would be after structural break + retest. Keep your risk tight, and let the market show its hand.
⸻
📌 Key Levels:
• Support Zone: $3,340–$3,345
• Target Zone: $3,380–$3,385
• Invalidation: Below $3,335
⸻
📣 If this setup helps you, like 👍, comment 💬, and follow 🔔 for more high-probability ideas every week!
#Gold #XAUUSD #SmartMoney #LiquidityGrab #ForexSetup #PriceAction #BreakoutTrade #DoubleBottom #TradingView #GoldAnalysis #ForYou #FXStrategy #SupplyAndDemand
XAUUSDK trade ideas

GOLD Buy limit targetGold is preparing a possible retracement till the $3400 area. My plan is wait the price there and enter long if this level will get a rejection. This is a high volume area where price could catch some volatility to bounce
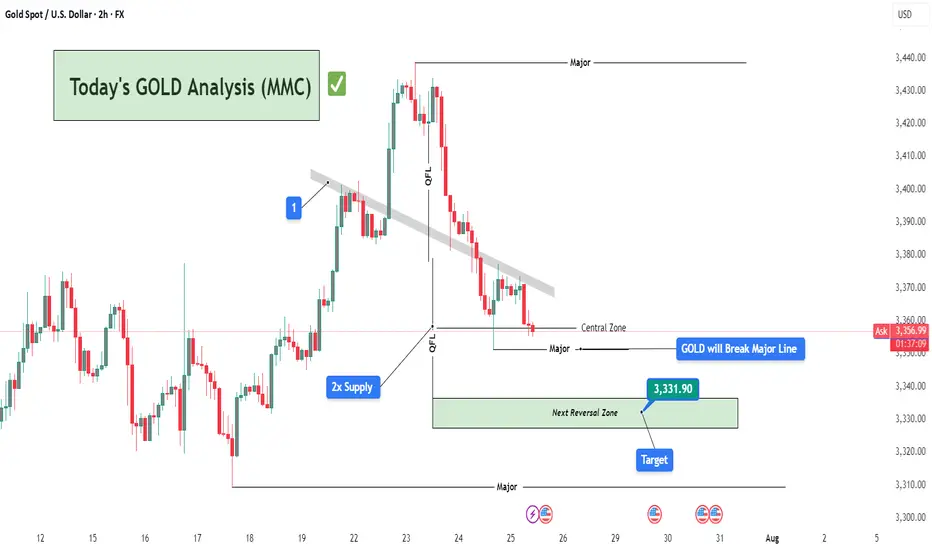
Today's GOLD Analysis (MMC) – Sell Bias Continues To Next TargetChart Overview:
This 2-hour GOLD (XAU/USD) chart showcases a clear bearish structure in line with the Mirror Market Concepts (MMC) methodology. Price action is respecting key supply zones and continues to reject significant levels, confirming the dominance of sellers in the short-term structure.
🔍 Key Technical Elements:
1️⃣ Break of Trendline (MMC QFL Entry Model)
The descending grey trendline marks consistent lower highs, showing clear bearish pressure. The breakout and rejections around this trendline zone (annotated “1”) confirm it as a strong supply area. This breakdown set the stage for a QFL (Quick Flip Liquidity) drop.
🧊 2x Supply Zone (High Confidence Rejection)
The 2x supply label highlights an area where price rapidly reversed with aggressive bearish momentum. This zone was tested and respected again, leading to further downside pressure, reinforcing the idea of institutional selling interest from that level.
📉 QFL Levels & Central Zone
Two major QFL drops are evident, where price broke previous demand structures and created new supply imbalance. The Central Zone currently acts as short-term support, but price is hovering just above it with weak bullish reaction, indicating potential for further breakdown.
🎯 Target & Reversal Zone – 3,331.90
The green zone below marks the Next Reversal Zone, with a highlighted price target at 3,331.90. This is where:
Previous liquidity was absorbed.
Demand imbalance may attract buyers again.
MMC reversal structures might be anticipated.
This zone aligns perfectly with the broader MMC concept of flipping between major zones and reversal blocks.
🧠 Trade Idea & Strategy (MMC Traders’ Minds)
Current Bias: Bearish
Entry Trigger: After rejection from trendline & 2x supply area.
Stop-Loss Suggestion: Above the trendline or recent supply wick (~3,375-3,380).
Take-Profit Zone: Primary TP at 3,331.90, with eyes on lower reversal targets if momentum persists.
Market Behavior: Controlled by sellers, liquidity sweeps seen, weak demand below Central Zone.
📌 Key Events to Watch
As marked at the bottom, major US news events are scheduled between July 30th and 31st, which could act as catalysts for price acceleration toward the reversal zone or cause sharp volatility. Plan accordingly.
🧭 Conclusion:
Gold is respecting bearish market structure under the MMC model. With clear QFL breakouts, rejection from 2x Supply, and weak bullish attempts near the Central Zone, this chart favors short setups targeting the 3,331.90 zone. MMC traders should monitor price action closely within the Reversal Zone for potential buy signals or trend continuation if sellers remain aggressive.
Gold is under pressure, shorts aim at 3310Gold is under pressure, shorts aim at 3310
Gold technical analysis and trading strategy: key support faces test, weak rebound, beware of breakout risk
Fundamental driving factors
The stabilization of the US dollar index suppresses gold prices: recent US economic data (such as retail sales, initial jobless claims) show resilience, the market's expectations for the Fed's rate cuts have been postponed, and US Treasury yields have rebounded, weakening the attractiveness of interest-free assets such as gold.
Risk aversion cools down: The situation in the Middle East has not escalated yet, and the rebound in US stocks has weakened the safe-haven demand for gold.
Fund flow: ETF holdings data show that institutional investors have continued to reduce their holdings of gold recently, reflecting that market sentiment is cautious.
Key technical signals
1. 4-hour cycle: oscillating bearish structure
Clear suppression: The overnight rebound high of 3375 (38.2% Fibonacci retracement level) constitutes a short-term strong and weak boundary, and the price has failed to stand firm here, indicating that bullish momentum is insufficient.
Support overlap: The 3340-35 area is the resonance area of the 4-hour trend line support and the Fibonacci downward target (3335-40). If it is lost, the downward space will be opened to 3320-3300.
Indicator divergence: The MACD histogram is shrinking and the fast and slow lines are close to the zero axis, and the RSI is hovering below 50, suggesting that the rebound momentum is exhausted.
2. 1-hour cycle: short-term technical structure is formed
Descending channel: Thursday's high of 3395 and the current high of 3377 form a secondary high point. Connecting the low point of the hourly chart can draw a descending channel, and the price runs along the lower track of the channel.
Key watershed: 3350 (61.8% retracement level) is a short-term long and short battle point. After breaking it, it will accelerate the test of 3340-35.
Today's trading strategy
Direction: Rebound high and empty mainly, and follow up after breaking the support.
Entry:
Aggressive short order: 3368-3373 light position short test, stop loss above 3380, target 3345-3340.
Steady short order: If the price rebounds to 3375-3380 under pressure, add short position, stop loss 3385, target unchanged.
Take profit and risk control:
Partial reduction of position near the first target 3340, the remaining position observes the support strength of 3340-35.
If it quickly breaks below 3340, short can be chased to 3325-3320 (previous low of daily line).
Alternative plan:
If the price unexpectedly breaks through 3380 and stabilizes, short position needs to be exited, wait and see the 3390-3400 pressure zone and then choose the opportunity to layout.
Key Tips
Don’t blindly buy the bottom: The current technical structure has not shown a bottom signal. Although the 3340-35 area is support, if it is accompanied by a large negative line break, it may trigger long stop-loss orders.
Data risk: Pay attention to the US PMI data in the evening. If it is stronger than expected, it may strengthen the dollar to suppress gold prices.
Gold – 25 July: Watching M15 Demand for Bullish Reversal📍 Gold – 25 July Outlook
Early Signs of Reversal from H4 OB Zone – Wait for Clear Continuation
🔍 Market Recap & Context:
Yesterday, the H4 Order Block zone (3359–3345) was retested and showed signs of holding. A visible M15 structure shift (ChoCH) suggests the market may be preparing to resume the uptrend.
However, the M15 Break of Structure (BoS) has not yet occurred — so this is not a confirmed reversal .
📍 Current Zone to Watch:
M15 Demand Zone: 3359.5 – 3351.5
Price is retracing into this zone. If respected, it could be the base for the next bullish leg.
📌 Trade Setup Possibility:
If price holds the M15 demand zone and M1 gives confirmation (e.g., micro-ChoCH + micro-BoS , a long trade could be considered.
But keep in mind — this would be an aggressive entry , because the M15 BoS is still pending.
This setup would rely on:
• Candlestick behavior
• Volume spikes or reaction
• Price action psychology
✅ Strategy Note:
Wait for signals like:
– Bullish engulfing on M1 or M5
– Micro ChoCH + demand hold
– Volume absorption or imbalance reaction
Only act if the market shows strength — not just a zone tap.
📝 Summary:
• Bias: Early bullish reversal watch
• Zone in Play: 3359.5–3351.5 (M15 demand)
• Confirmation: M1 LTF shift + strong candlesticks
• Caution: No M15 BoS yet — be precise and patient
• Risk Management: 1:3 RR — 40 pip SL / 120 pip TP
Let the chart speak first — observe with stillness, execute with precision.
📘 Shared by @ChartIsMirror

350pips Secured — Focus Shifts to Dip-Buying StrategyToday's trading was very successful, and the grasp of the long and short rhythm was very accurate. Today's trading situation is as follows:
1. Close the short position with an overnight entry price of around 3386 near 3380, with a loss of 60 pips, and the loss amount exceeded $6K;
2. Directly short gold near 3380, manually close the position near 3366, profit 130pips, profit amount exceeded $12K;
3. Long gold near 3356, hit TP: 3372 and end the transaction, profit 160pips, profit amount exceeded $8K;
4. Long gold near 3362, hit TP; 3375 and end the transaction, profit 120pips, profit amount exceeded $6K.
Intraday trading summary: Today, the long and short sides completed a total of 4 transactions, one of which suffered a loss, but the net profit was 350pips, and the profit amount exceeded $20K. For short-term trading, I think I can submit a satisfactory answer to myself today!
How to execute the transaction next? Gold started to pull back from around 3438 and has now reached a low of around 3351, with a retracement of more than 870pips. The retracement space is not small. However, gold has stabilized above 3350 and has started a technical rebound repair, and the upward force is not weak, so gold may have completed the retracement. Under the support of these two technical conditions, gold may regain its upward momentum and hit 3400 again.
At present, the short-term resistance is obvious, located in the area near 3380. Once gold breaks through 3380, gold will inevitably continue to rise and hit 3400 again; but I think as long as gold stabilizes above 3350, it is not difficult to break through the short-term resistance of 3380, so gold will inevitably test the 3400 mark again; and the short-term support below is in the 3365-3355 area. Gold may still retreat to this area first during the rise in order to increase liquidity and accumulate momentum, helping gold to break through 3380 more easily.
So for the next short-term trading, I think it is feasible to go long on gold in the 3365-3355 area, first looking at the target area of 3380-3390, and then 3400.

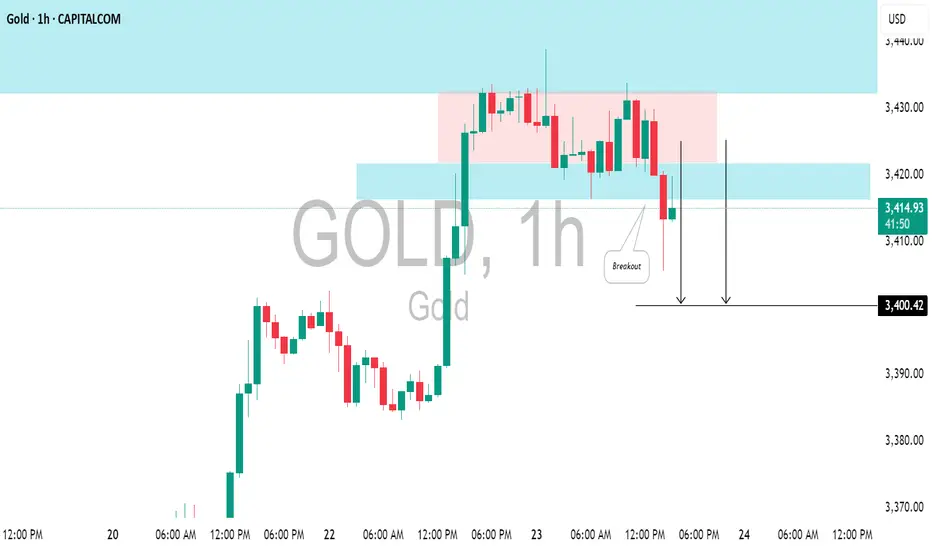
GOLD(#XAUUSD): Pullback From Resistance ConfirmedGOLD could retreat from the highlighted resistance level.
I observed a horizontal trading range pattern following a test of significant intraday resistance, along with a breach of its support level marked by a strong bearish candle.
Target - 3400.
XAUUSD – healthy correction, ready to bounce from 3,338Gold is retracing within an ascending channel after facing rejection at the FVG zone near 3,402.800. This pullback is seen as a healthy correction, with confluence support around 3,338, which previously acted as a springboard for bullish momentum.
As long as price holds above this zone, a rebound toward 3,402 remains likely.
Primary scenario
Buy zone: 3,338
Target: 3,402
Invalidation: Break below 3,320
Note
Weak volume near the FVG zone may cause short-term consolidation, but the broader trend still favors buyers.

GOLD → Breakthrough accumulation. Correction before growthFX:XAUUSD has been strengthening since the session opened and is heading towards the 3374 zone of interest. The price has previously broken through the consolidation resistance and may test this boundary before moving further.
Gold is rising amid trade risks and dollar weakness. After falling to $3310, gold resumed its growth, seeking to break through the $3368 level. Support for prices was provided by uncertainty surrounding Trump's tariff policy and expectations for Fed Chairman Powell's speech. The US dollar weakened temporarily as investors sought refuge in gold amid trade disputes with the EU, political instability in Japan, and criticism of the Fed from the White House.
Technically, the price is in a realization phase after breaking out of consolidation, but it has encountered resistance at 3368, which could lead to a correction. The focus is on the 3350-3355 zone. If the bulls hold their ground above this zone, the market may return to the realization phase.
Resistance levels: 3368, 3374
Support levels: 3345, 3332
The market is bullish and feels support, especially against the backdrop of a weak dollar. Traders are watching Trump and Powell. If the latter decides to cut rates, for example tomorrow at 12:30 GMT, gold could rally...
Technically, gold could test 3350 before rising.
Best regards, R. Linda!

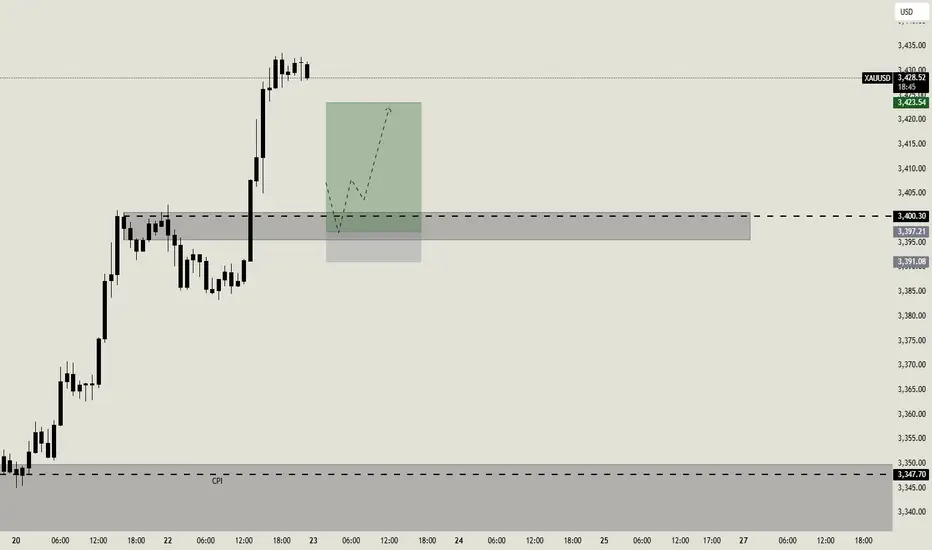
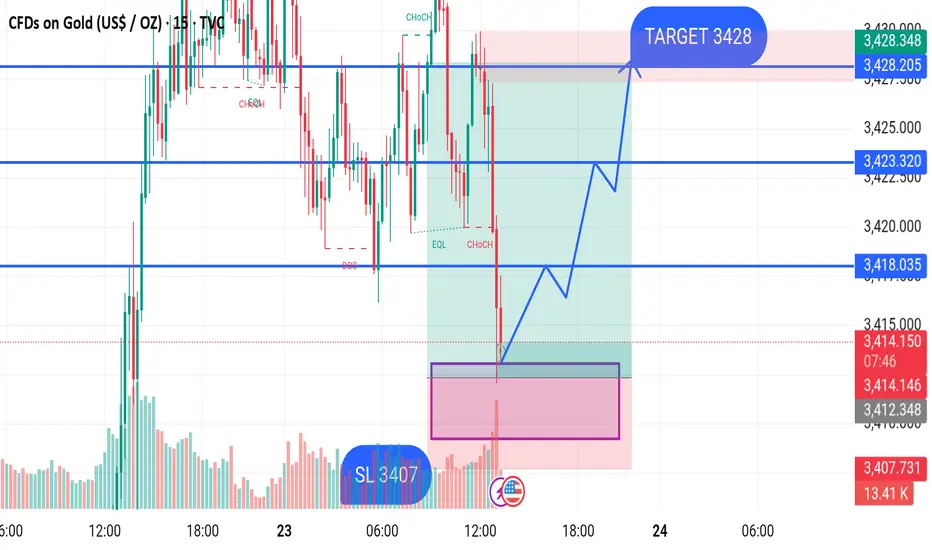
GOLD BUY M15 Gold (XAUUSD) Analysis – 15-Minute Timeframe
Price has recently shown a strong bearish move after a CHoCH (Change of Character) confirmation. The market has entered a demand zone (highlighted in pink), where a potential bullish reversal is expected.
Entry Zone: Around 3407–3408 level (within the demand area)
Stop Loss (SL): 3407 (just below the demand zone)
Target: 3428 (major resistance and supply zone)
The expected move shows price reacting from the demand zone, forming higher highs and higher lows, with bullish confirmation. If price holds above the 3407 level, buyers may take control and push price toward the 3428 target.
Key Levels:
Demand Zone: 3407 – 3408
Support Level: 3418.035
Resistance Levels: 3423.320 and Final Target 3428
Gold analysis WednesdayHello guys today I update the gold price action analysis, some parts of my journey and plan, and how we must prepare for every scenario that would come. Thankyou for watching

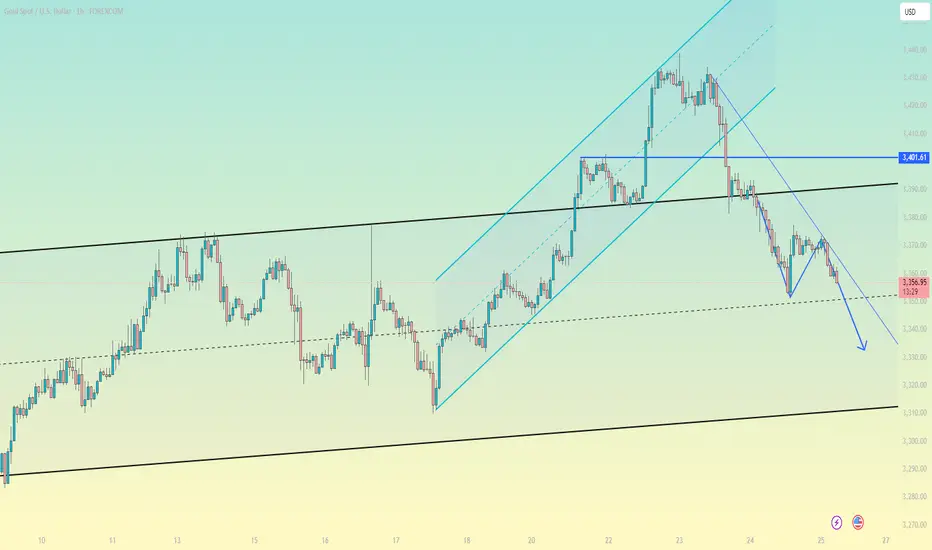
XAUUSD Chart Analysis: Bullish Flag PatternBased on the provided XAUUSD chart, a classic bullish flag pattern appears to be forming on a short-term timeframe. This is a continuation pattern that suggests a potential resumption of the prior uptrend.
Here's a breakdown of the pattern's components:
The Flagpole: The pattern begins with a strong and rapid upward price movement, which forms the "flagpole." This sharp rally is visible around the 21:00 mark on the chart, indicating strong buying pressure.
The Flag (Consolidation): Following the flagpole, the price has entered a period of consolidation. This forms the "flag," which is characterized by the price action moving downward within a well-defined parallel channel or falling wedge. The two white trendlines neatly outline this corrective phase.
Potential Breakout: The price is currently testing the upper trendline (resistance) of the flag. A bullish flag pattern is confirmed when the price breaks decisively above this upper trendline.
Interpretation and Potential Trade:
Continuation Signal: A breakout would signal that the consolidation period is over and the initial bullish momentum is likely to continue.
Price Target: The "Long Position" tool on the chart illustrates a potential trade based on this pattern. Typically, the target for a flag pattern is measured by taking the height of the flagpole and adding it to the breakout point. The tool projects a take-profit level around 3,395.538.
Risk Management: The tool also indicates a potential stop-loss placed below the low of the flag (around 3,364.496), which is a common strategy to manage risk if the pattern fails.
In summary, the chart shows a pause in an uptrend. Traders will be watching for a confirmed breakout above the flag's resistance to anticipate further upward movement in XAUUSD.

Feed Your Ego or Feed Your Account- Your Choise🧭 From Rookie to Realization
I’ve been trading since 2002. That’s nearly a quarter of a century in the markets.
I’ve lived through it all:
• The early days, when the internet was slow and information was scarce
• The forums, the books, the overanalyzing
• The obsession with finding “the perfect system”
• And later… the dangerous phase: needing to be right, because I have a few years of experience and I KNOW
At one point, I thought that being a good trader meant calling the market in advance — proving I was smarter than the rest.
But the truth is: the market doesn't pay for being right. It pays for managing risk, always adapting and executing cleanly.
________________________________________
😤 The Psychological Trap Most Traders Fall Into
There’s one thing I’ve seen consistently over the last 25 years:
Most traders don’t trade to make money.
They trade to feel right.
And this need — this psychological craving to validate an opinion — is exactly what keeps them from growing.
You’ve seen it too:
• The guy who’s been screaming “altcoin season” for 2 years
• Who first called it when EGLD was at 80, TIA, and others that kept dropping
• But now that something finally moves, he says:
“See? I was right all along, altcoin season is here”
He’s not trading.
He’s rehearsing an ego story, ignoring every failed call, every drawdown, every frozen position.
He doesn’t remember the trades that didn’t work — only the one that eventually did.
This is not strategy.
It’s delusion dressed up as conviction.
________________________________________
📉 The Market Doesn’t Care What You Think
Here’s the reality:
You can be right in your analysis — and still lose money.
You can be wrong — and still come out profitable.
Because the market doesn’t reward your opinion.
It rewards how well you manage risk, entries, exits, expectations, and flexibility
I’ve seen traders who were “right” on direction but blew their accounts by overleveraging.
And I’ve seen others who were wrong on their first two trades — but adjusted quickly, cut losses, and ended green overall in the end.
This is what separates pros from opinionated amateurs.
________________________________________
📍 A Real Example: Today’s Gold Analysis
Let’s take a real, current example — my own Gold analysis from this morning.
I said:
• Short-term, Gold could go to 3450
• Long-term, the breakout from the weekly triangle could take us to 3800
Sounds “right,” right? But let’s dissect it:
Short-term:
✅ I identified 3370 as support
If I buy there, I also have a clear invalidation level (below 3350)
If it breaks that and hits my stop?
👉 I reassess — because being “right” means nothing if the trade setup is invalidated
And no, it doesn’t help my PnL if Gold eventually reaches 3450 after taking me out.
Long-term:
✅ The weekly chart shows a symmetrical triangle
Yes — if we break above, the measured move targets 3800
But…
If Gold goes below 3300, that long-term scenario is invalidated too.
And even worse — if Gold trades sideways between 3000 and 3500 for the next 5 years and finally hits 3800 in 2030, that “correct call” is worth nothing.
You can't build a career on "eventually I was right."
You need precision, timing, risk management, and the ability to say:
“This setup is no longer valid. I’m out.”
________________________________________
💡 The Shift That Changed Everything
It took me years to realize this.
The day I stopped needing to be right was the day I started making consistent money.
I stopped arguing with the market.
I stopped holding losers out of pride.
I stopped needing to "prove" anything to anyone — especially not myself.
Now, my job is simple:
• Protect capital
• Execute with discipline
• Let the edge do its job
• And never fall in love with my opinion
________________________________________
✅ Final Thought – Let Go of Being Right
If you’re still stuck in the “I knew it” mindset — let it go.
It’s not helping you. It’s costing you.
The best traders lose small, admit mistakes fast, and stay emotionally neutral.
The worst traders hold on to “being right” while their account burns.
The market doesn’t owe you respect.
It doesn’t care if you called the top, bottom, or middle.
It pays the ones who trade objectively, flexibly, and without ego.
After almost 25 years, this is the one thing I wish I had learned sooner:
Don’t try to win an argument with the market.
Just get paid.
Disclosure: I am part of TradeNation's Influencer program and receive a monthly fee for using their TradingView charts in my analyses and educational articles.

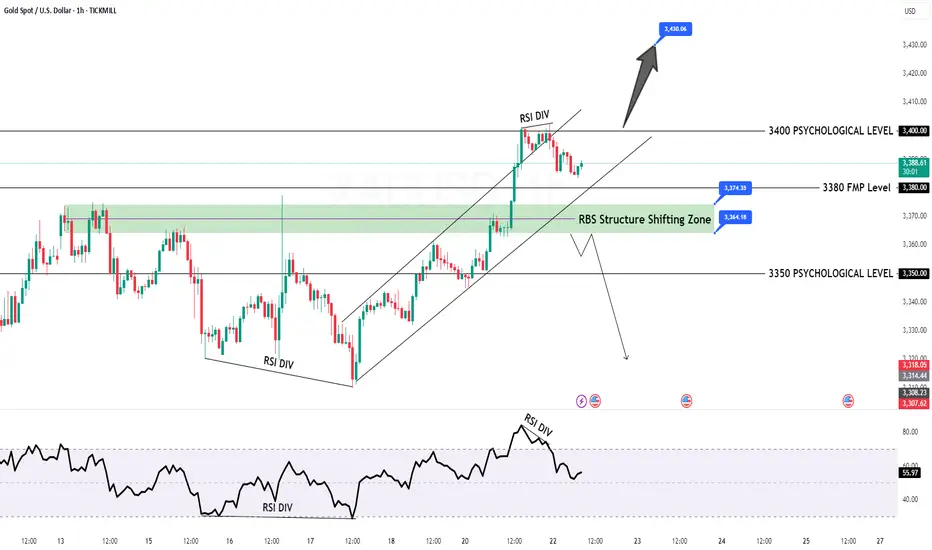
GOLD Intraday H1 Chart Update For 22 July 2025Hello Traders,
Today we have FED Chair Powell Speech ahead
all eyes on 3400 Psychological Level Break for now, if market successfully breaks 3400 then it will move towards 3435
below 3400 it will move back towards 3350 level
Disclaimer: Forex is Risky
Gold is Targeting Fresh HighsHey Traders, in today's trading session we are monitoring Gold for a buying opportunity around 3,410 zone, Gold is trading in an uptrend and currently is in a correction phase in which it is approaching the trend at 3,410 support and resistance area.
Trade safe, Joe.

Lingrid | GOLD Price Correction or Continuation ?The price perfectly fulfilled my last idea . OANDA:XAUUSD has completed an A-B-C bullish movement within the rising structure and is now testing a key resistance zone near 3,387. With momentum fading near the upper boundary, a potential correction toward the 3,367 area is likely before any further advance. A bounce from the SWAP zone may trigger renewed upside toward the 3,430 resistance. Price action remains bullish above the higher low and broken triangle pattern.
📉 Key Levels
Buy trigger: Rebound from 3,367
Buy zone: 3,355–3,370
Target: 3,430
Invalidation: Break below 3,342
💡 Risks
Deep correction below key structure
Failure to reclaim resistance after retest
Sudden shift in macroeconomic sentiment
If this idea resonates with you or you have your own opinion, traders, hit the comments. I’m excited to read your thoughts!
