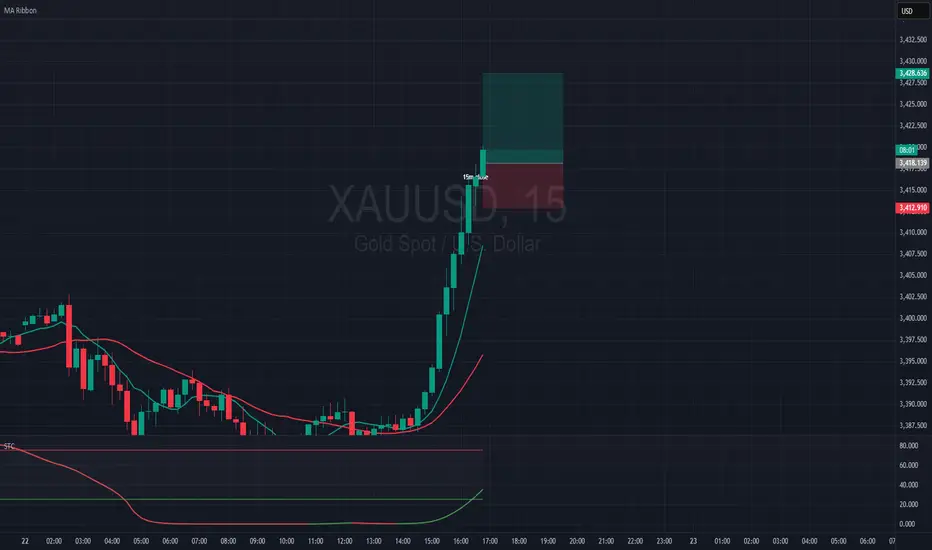
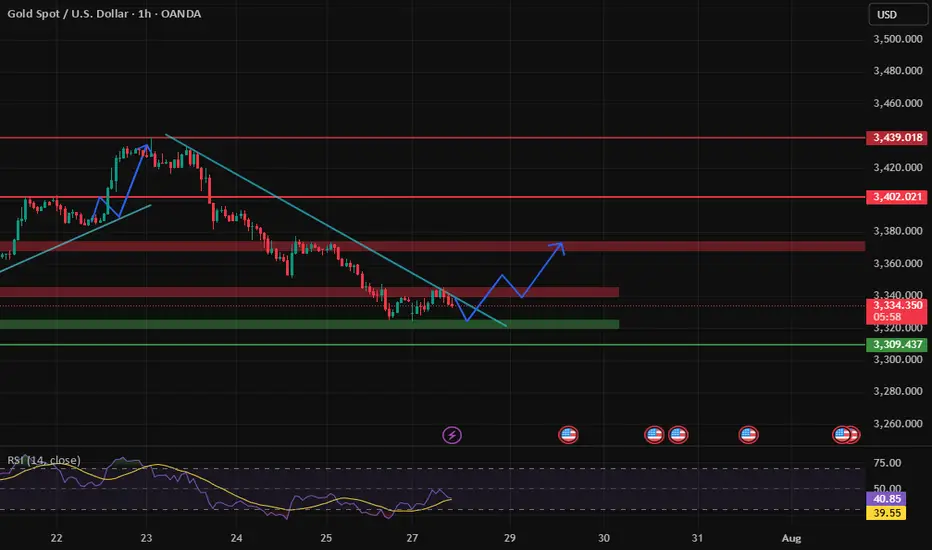
XAUUSD 1 HOUR CHART PATTERN(XAU/USD 1H timeframe), there are two target points clearly marked on the screen:
1. First Target Point:
~3,380,000 (as shown on the chart).
2. Second Target Point:
~3,420,000 (higher target marked at the top).
The chart shows a breakout above a descending trendline, with price retesting the breakout zone (light blue area). The arrows suggest an expected bullish continuation towards these targets.
Suggest stop loss zones.
Analyze further timeframes.
XAUUSDK trade ideas

XAUUSD GOLD H1 TARGETThere we have declared if market break 3380 then it's going to take bullish way so stay tune with us
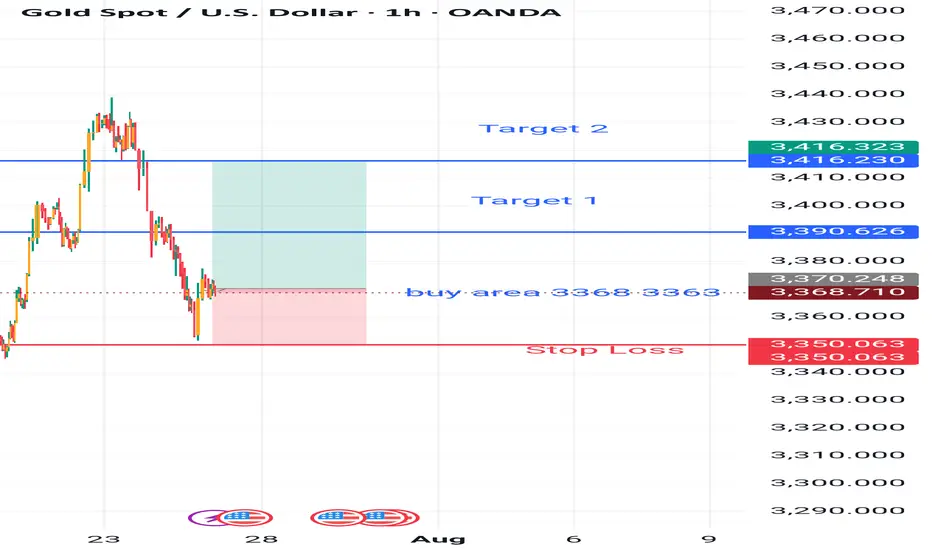
The real target of gold is more than 3400
💡Message Strategy
The United States has recently made frequent moves in global tariff policies. Treasury Secretary Bensont has clearly set August 1 as a hard deadline for tariff negotiations among countries. At present, EU trade negotiations have been decoupled from the issue of sanctions against Russia and Ukraine, while Japan's negotiations are progressing smoothly.
These dynamics reflect that the United States is reshaping the global trade pattern through differentiated strategies, and countries are forced to adjust their economic and trade policies under the pressure of tariffs. As the deadline approaches, gold is facing a test of long and short positions.
The White House's pressure on the Federal Reserve is still fermenting. The US Treasury Secretary said that the Federal Reserve should cut interest rates now, but at the same time said that there is no sign that Powell should resign now. If he wants to leave early, he should do so. Powell gave a public speech yesterday, but to the disappointment of the market, he did not mention monetary policy and the possibility of resignation. However, Trump's pressure on the Federal Reserve has taken effect, and the market has turned its attention to interest rate cuts.
📊Technical aspects
Yesterday, Tuesday, we believed that the trade negotiations between Europe and the United States were on the verge of breaking down, which led to a rise in risk aversion in the market, boosted gold safe-haven buying, and supported the price of gold to a one-month high.
Therefore, we suggest that you take a bullish approach in terms of operation. Pay attention to the support below at $3,380, and pay attention to the breakthrough of $3,402 above. As expected, it broke through to $3,440, reaching our expected profit target.
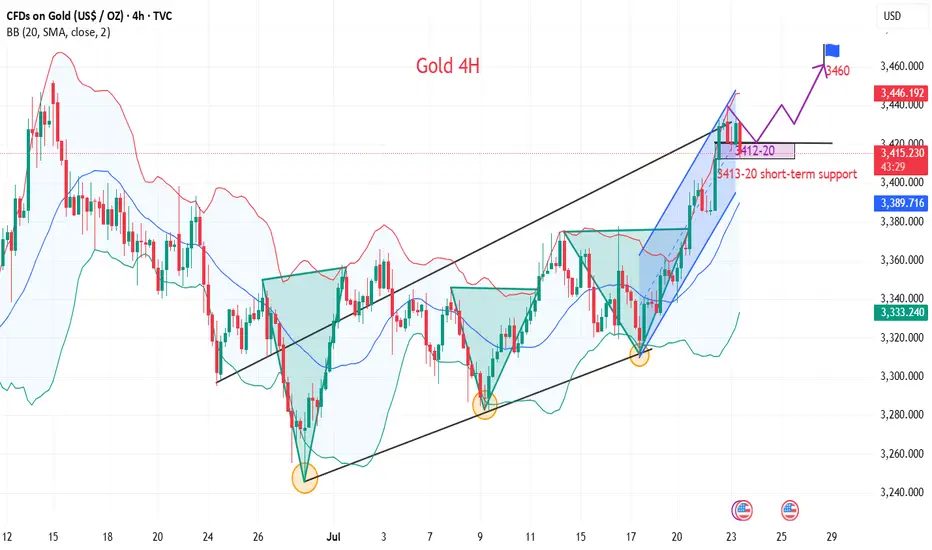
From the 4H trend structure, gold has been climbing rapidly along the upward channel recently. It broke through yesterday and took the 3400 mark in one fell swoop, reaching our expected target of 3440. At present, gold is blocked and falls back on the channel boundary support.
At the same time, the 1-hour RSI broke through the upward trend line support and tested the resistance again, releasing a callback signal in the short term. It is necessary to pay attention to the possibility of short-term adjustments. Today, we can focus on the key resistance around 3415 and try long opportunities.
💰Strategy Package
Long Position:3410-3420,SL:3390,Target: 3440,3460
Well I made my first Million Dollar Trade (even in DEMO)This was a calculated excercise to see what would happen if I brought real money to the table for actual successful outcomes. I had traded the 10K, 50K and 100K. Then I traded the 100K, 200K and 500K levels successfully during trading capital increases. But today I earned a 1M Trade over the capital interests that I could accumulate. This was an excercise, but I ask you to do it. Good, thanks for watching, FLB.

xauusd ideaposible buy At the confluence of additional Fibonacci extensions, we have an institutional price that can be visited before rising through those highs.

Gold (XAU/USD) Technical Analysis:Gold is currently retesting the $3,440 zone — a key level for the next move.
🔹 Bullish Scenario:
If the price breaks and holds above $3,440, we may see a continuation toward $3,455, where a pullback or bearish correction could occur.
🔹 Bearish Scenario:
If selling pressure increases and the price breaks below $3,420 with confirmation, a move down to retest the $3,385 area is likely.
⚠️ Disclaimer:
This analysis is for educational purposes only and does not constitute financial advice. Always do your own research before making any trading decisions.

Mean Reversion Risk & Short Trap ?Analysis :: XAU/USD – July 21, 2025
🧩 Scenario Expansion – Mean Reversion Risk & Short Trap Variant
🧠 FLOW STATUS (Reassessment for MR scenario):
Order book shows replenishment at 3401.50–3403.00, forming a liquidity ceiling.
CVD diverging slightly on 1M–5M as price presses upward—distribution signal rising.
VWAP bands stretched: price outside 1.5x STD (mean reversion trigger zone).
🕳️ Low effort on buyer continuation despite printing highs.
📉 ALTERNATE SIGNAL: 🔃 MEAN REVERSION TO VWAP
🔹 Confidence Band: CONSERVATIVE → CONFIRMED if 3393 fails
📍 Break Trigger Zone:
Breach of 3393.00 on delta + seller reclaim → validates reversal logic
Watch for bid collapse or sustained negative delta below 3391
📉 Expected Pullback Targets:
TP1: 3387.80–3386.20 = VWAP + 1 STD reversion
TP2: 3383.00 = HLQ + CVD shelf
🛡️ Stop Zone for Mean Reversion Entry:
Above 3397.20 or on full absorption at 3395.50 (failure = trap scenario invalid)
🧮 Probability Estimate – Mean Reversion:
46–55% over next 6–12 hours
↑ Strengthens to 65–70% if price fails to reclaim 3394.50 after sweep + delta shift
📈 Trap Reversal Setup (Short trap flipped into long):
If price fakes below 3391.00 then spikes back above 3393.50 with aggressive tape → strong trap confirmation
In that case:
✅ Re-entry LONG with confirmation
📍 Entry: 3393.40–3394.20
🎯 TP: New highs at 3402.50+, then 3406.00
📚 NARRATIVE (Alt Scenario):
Market extended into premium zone without strong continuation. Liquidity overhead, delta divergence, and VWAP stretch suggest potential for correction. If bulls fail to defend 3393–3391, price likely seeks VWAP center and HLQ for rebalancing. Conversely, any reclaim of broken bids post-sweep flips scenario into a reactive long on trap fuel.
📦 MODULE TRACE (Alt Path):
🧠 Disciplined Entry Logic: Rule 3 (bias must adjust if liquidity contradicts setup)
💧 HLQ under VWAP (~3384–3387) aligned with pullback
🔄 Delta divergence + DOM ceiling = soft rejection
📦 Shadowcode ST3/ST5 if price forms mirror wick rejection
🧠 Trap Narrative Active only after flush + reclaim with flow shift

XAUUSD LONG Here are reasons to buy gold,
1.Ascedig triangle formed and clear when you look at daily and h4 time frames.
2.At 3410.42 support truns in to resistance
3.Be on the look out of tend in trends on the smaller time frames

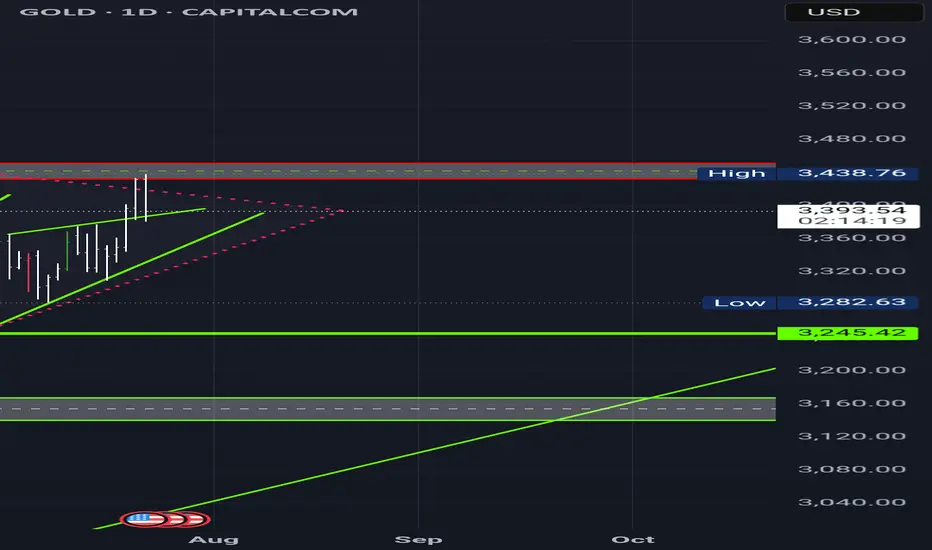
XAUUSD 4H Technical Outlook The current market structure on the 4H timeframe shows a clear sweep of a liquidity pool near the recent highs (~3,348), followed by a strong bearish reaction. Price action suggests a short-term shift in momentum toward downside targets.
🔻 Bearish Scenario
After liquidity was grabbed above the recent highs (highlighted in the orange circle), price rejected sharply. The next critical level lies at the Bullish OB (LTF) around the 3,325–3,337 zone. A break below this could lead to a deeper retracement into the Fair Value Gap (FVG) and demand zone at 3,150–3,244.
📍 Key Levels:
Resistance: 3,347 – 3,439
Support: 3,244 – 3,150 (watch for reaction in the FVG zone)
Intermediate target: 3,244.41 (Low)
🟢 Bullish Case
If price finds support at the OB and respects the ascending trendline, we could see a reversal back to re-test the upper resistance near 3,438.
📈 Bias: Bearish until price confirms support above 3,337 and reclaims liquidity zone.
🔔 Watch for:
Price reaction at OB (3,325–3,337)
Break and close below 3,244 could accelerate selling
Potential long setup from FVG with bullish confirmation

Is Smart Money Selling Gold? A VSA LookHey Traders,
Let's take a look at the Gold (XAU/USD) 1-hour chart using Volume Spread Analysis (VSA). The price made a strong run-up to a new high around $3,438, but the volume is telling us a story of potential weakness.
Here’s a simple breakdown of what I'm seeing.
The Trap at the Top (Signs of Weakness)
Think of the market as being moved by "smart money" (professionals) and "herd money" (the crowd).
Climax Volume: See that huge volume spike right at the peak on July 23rd? While it looks like strong buying, this is often a classic sign of a Buying Climax. This is where smart money starts selling their positions to the excited crowd who are buying at the top, fearing they'll miss out.
No Real Buyers Left: After the peak, notice how the price tried to push higher a few times but on much lower volume? This is a "No Demand" signal. It’s like a car trying to rev its engine, but it's out of gas. It shows there isn't enough buying power to push the price any higher.
Sellers Take Control: As the price started to fall from the top, look at the volume on the down bars. It got bigger. This tells us that supply (selling pressure) is now in control, and they are pushing the price down with force.
Where Are We Now?
The price has dropped and is now hovering around the $3,330 area. The volume has dried up for now, which means the market is taking a pause and deciding where to go next.
What to Watch For Next
Based on the VSA story, here are two possible scenarios:
Scenario 1 (Bearish 📉): The weakness continues. If we see the price try to rally from here but the volume is very low, it would be another major red flag. It would suggest sellers are still in control, and we could see a break below the recent low of $3,320 for another leg down.
Scenario 2 (Bullish 📈): This is a bear trap. For this to happen, we would need to see a strong sign of buying returning. For example, a sharp drop on massive volume that is quickly bought back up. This would signal that the sellers have been absorbed and smart money is starting to buy again.
Conclusion:
For now, the evidence points more towards weakness. The action at the top suggests that smart money was distributing (selling) their gold.
Key Takeaway: Be cautious of any weak-looking bounces. The sellers appear to have the upper hand until we see a clear sign of strength with high buying volume.
This is not financial advice. This is just my interpretation of the chart using VSA. Always do your own research and manage your risk. Good luck trading!

Gold channel Aka RangeJust Lookingg at this weeks price action I think gold will continue to trend in this range
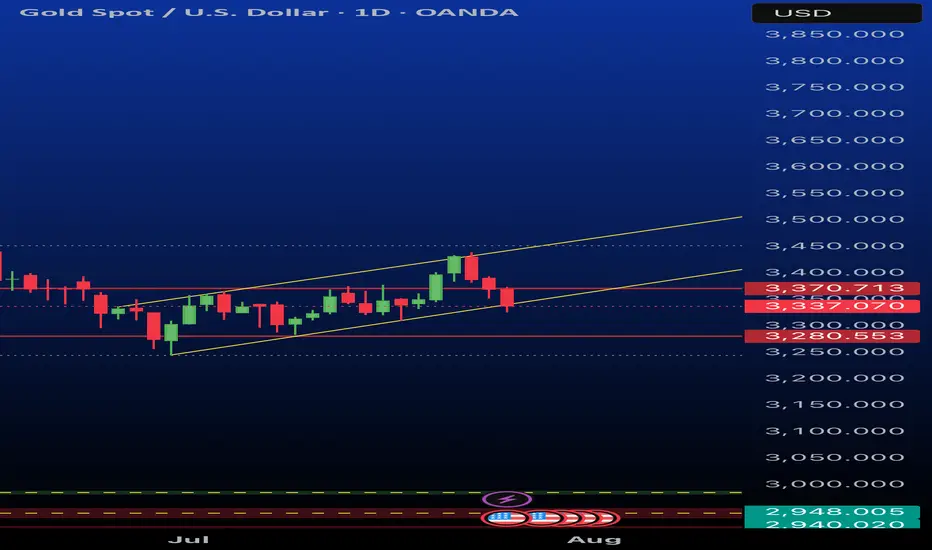
Gold testing SIGNIFICANT DAILY TRENDLINEGold is testing a key ascending trendline support around 3,340. If price holds this level, we could see a strong bullish reaction targeting 3,367 and potentially 3,400+. A break below 3,328 invalidates this setup.”

GOLD: Strong Bullish Sentiment! Long!
My dear friends,
Today we will analyse GOLD together☺️
The in-trend continuation seems likely as the current long-term trend appears to be strong, and price is holding above a key level of 3,392.264 So a bullish continuation seems plausible, targeting the next high. We should enter on confirmation, and place a stop-loss beyond the recent swing level.
❤️Sending you lots of Love and Hugs❤️

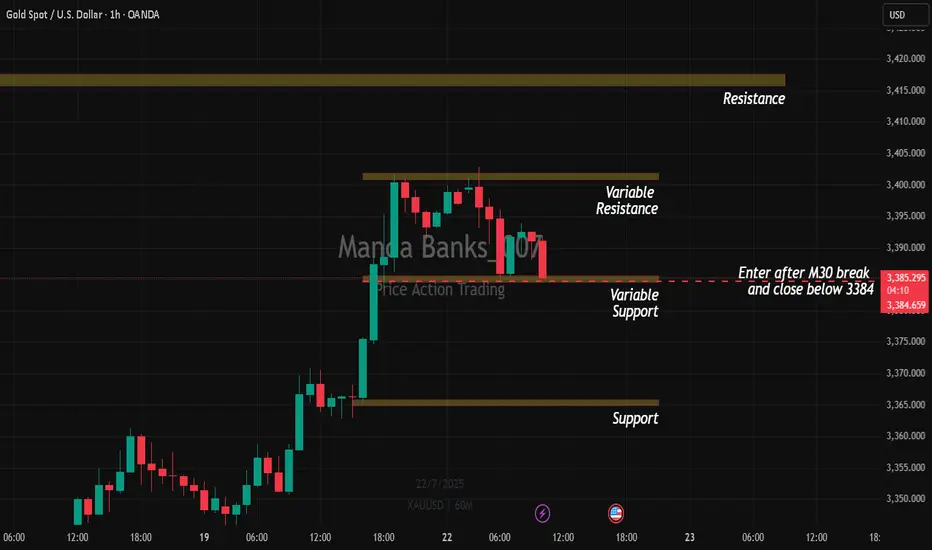
Impulse Sells on Gold/ Pre-London SetupI'll take a sell on Gold if price break and close below 3384.
It's simple price action strategic entry based on volume in Pre-London Session.
1st TP always 15-25 pips.
Manage risk dynamically by trailing SL to the high of the previous candle high.
XAUUSD – Weak recovery, selling pressure still dominatesHello everyone! What do you think – is it time to buy or sell gold?
After clearly breaking the ascending trendline late last week, gold made a slight rebound from the 3,325 zone. However, in my view, this bounce was relatively weak and mostly technical in nature.
Currently, price is retesting a key confluence area around 3,345–3,355, which includes the previous trendline and a nearby resistance zone.
If we see a clear rejection candle form at this level, there's a high chance the price may reverse and continue its downward trend. The short-term target I’m watching is 3,300 USD – and if that level doesn’t hold, we could see stronger reactions near 3,283.
According to the VRVP indicator, volume is concentrated around lower price levels, suggesting that liquidity is still sitting near previous lows. Structurally, the market continues to form lower highs and lower lows, and with the EMA sloping downward, my primary bias remains to SELL on rallies within the trend.

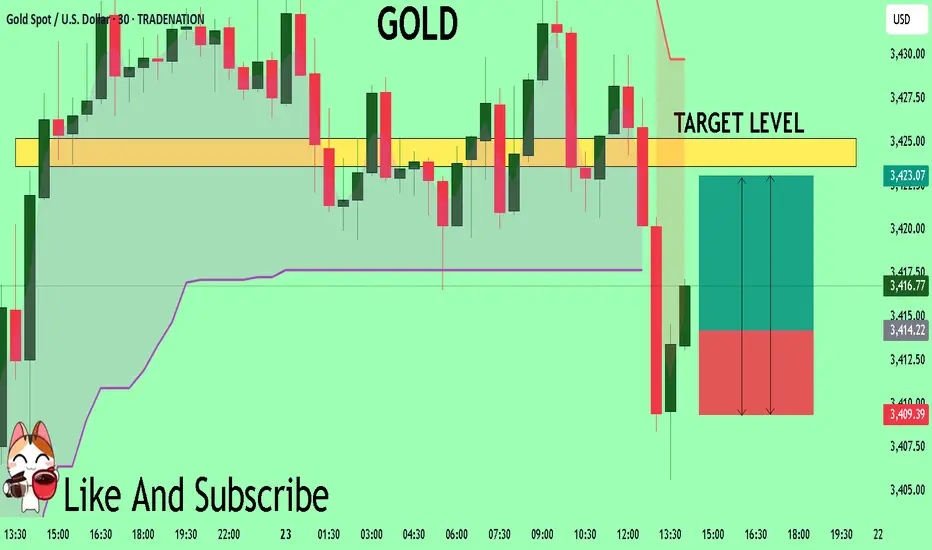
GOLD The Target Is UP! BUY!
My dear friends,
Please, find my technical outlook for GOLD below:
The price is coiling around a solid key level - 3414.2
Bias - Bullish
Technical Indicators: Pivot Points Low anticipates a potential price reversal.
Super trend shows a clear buy, giving a perfect indicators' convergence.
Goal - 3423.6
Safe Stop Loss - 3409.3
About Used Indicators:
The pivot point itself is simply the average of the high, low and closing prices from the previous trading day.
Disclosure: I am part of Trade Nation's Influencer program and receive a monthly fee for using their TradingView charts in my analysis.
———————————
WISH YOU ALL LUCK
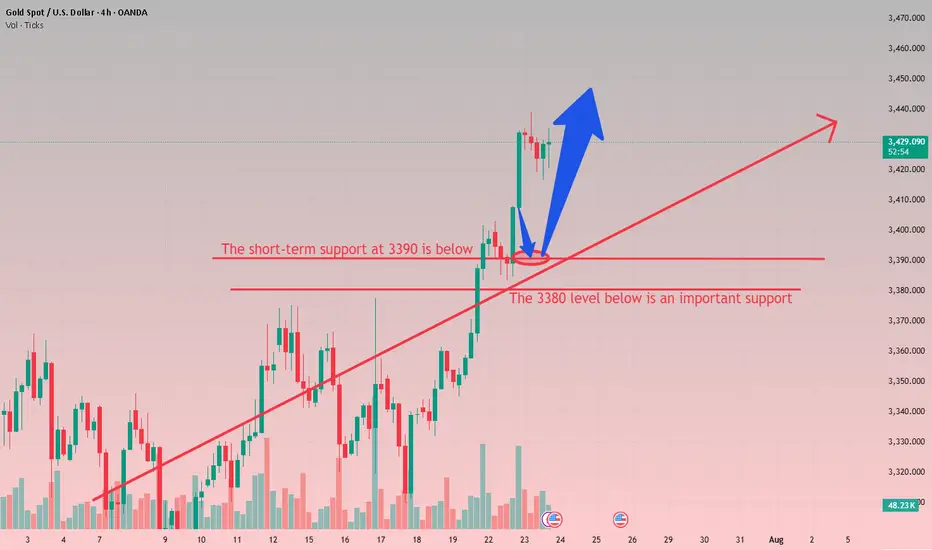
Don't chase gold at high levels, buy more when it falls back to From the 4-hour analysis, today's support is around 3400-10. If the intraday retracement relies on this position, the main bullish trend remains unchanged. The short-term bullish strong dividing line focuses on the 3380 mark. If the daily level stabilizes above this position, the rhythm of retracement will continue. Short positions against the trend should be cautious.
Gold operation strategy:
Gold retracement to 3400-10 line to go long, retracement to 3390-95 line to cover long positions, stop loss 3379, target 3435-3440 line, continue to hold if it breaks;
XAUUSD BUYS EXPECTATIONS I'm expecting buys from the marked demand zone(OB) as indicated from the graph above... Who is in ☝🏾 let me see your hands up 😎

Gold could be an changing hand area False break for cemeterycal triangle. Could lead to to start a down trend for a medterm investment
XAUUSD 5M DEMAND SETUPSpotted a clear 5M demand zone aligned with a bullish trend and previous higher highs. Noted a break of structure before the zone was tapped, with a fair value gap confirming the setup. Entered after a strong rejection and break of candle , targeting a 1:2 R:R. Trade hit take profit, ending the session with a solid result.

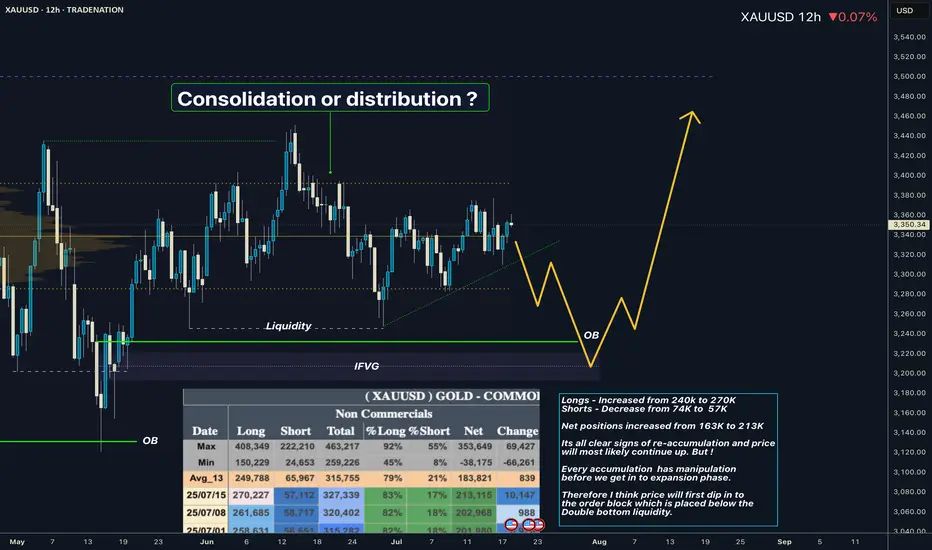
XAUUSD I Whats playing out in the range? COT overviewHey what up traders welcome to the COT data and Liquidity report. It's always good to go with those who move the market here is what I see in their cards. I share my COT - order flow views every weekend.
🎯 Non Commercials added significant longs and closed shorts at the same time. So for that reason I see the highs as a liquidity for their longs profits taking.
📍Please be aware that institutions report data to the SEC on Tuesdays and data are reported on Fridays - so again we as retail traders have disadvantage, but there is possibility to read between the lines. Remember in the report is what they want you to see, that's why mostly price reverse on Wednesday after the report so their cards are hidden as long as possible. However if the trend is running you can read it and use for your advantage.
💊 Tip
if the level has confluence with the high volume on COT it can be strong support / Resistance.
👍 Hit like if you find this analysis helpful, and don't hesitate to comment with your opinions, charts or any questions.
Analysis done on the Tradenation Charts
Disclosure: I am part of Trade Nation's Influencer program and receive a monthly fee for using their TradingView charts in my analysis.
"Adapt what is useful, reject what is useless, and add what is specifically your own."
— David Perk aka Dave FX Hunter ⚔️