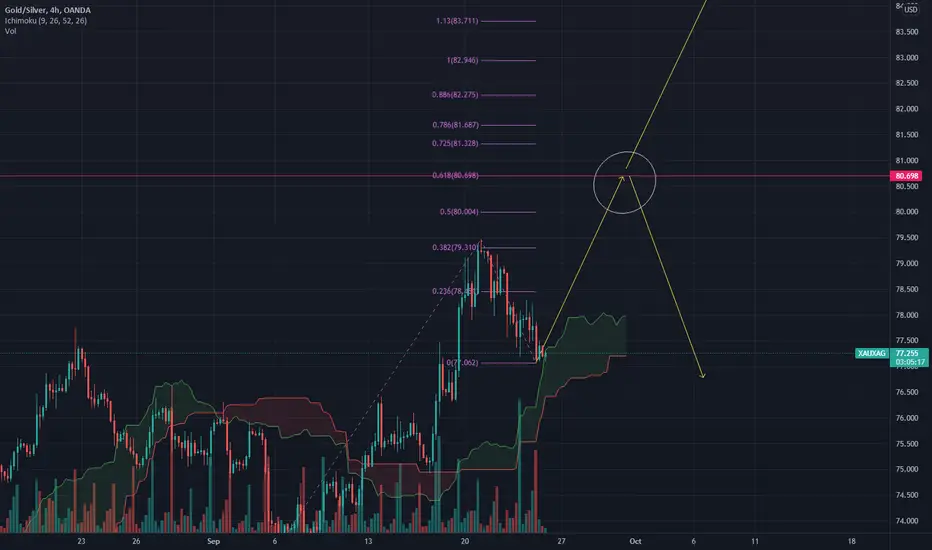
XAUXAGIf there is a return here, we could see an upward movement in precious metals. We've seen this a lot during recessions.
XAUXAG trade ideas

XAU/XAG-IMPORTANT MOVEMENTS-MONTLY‼Dear friends, the direction of long-term analysis does not change much. (Weekly-Monthly Trends)
But the length of daily and 4-hour trends is very short.
That's why we need to constantly update our short-term analyzes.
Today we will continue our gold and silver analysis.
💸Macroeconomic Overview
FED's hard interest rate hikes, along with precious metals, caused a general decline in the commodity market. However, it is not possible for commodity prices to return to their normal prices very quickly, including oil . Therefore, I do not expect any relaxation in the FED's interest rate policy. In general, my expectation is that interest rates will lag behind inflation for a long time.
💥Monthly
Gold silver ratio is an important chart. In the past years, we have witnessed a long-term rise. XAU/XAG showed an increase from $ 30 to $ 130. (5 waves-impulse waves) We can interpret this rise as a 5-wave impulse wave according to the elliot wave pattern. .After this rise, there was a sharp decline in favor of silver. According to the technical analysis, this can be interpreted as a correction of the previous bearish movement. (A decline) Now, I think we are in the B rise. At the 93-102 resistance levels, I expect the current situation to turn in favor of silver again.

XAU/XAG-IMPORTANT MOVEMENTS-WEEKLY.‼Dear friends, the direction of long-term analysis does not change much. (Weekly-Monthly Trends)
But the length of daily and 4-hour trends is very short.
That's why we need to constantly update our short-term analyzes.
Today we will continue our gold and silver analysis.
💸Macroeconomic Overview
FED's hard interest rate hikes, along with precious metals, caused a general decline in the commodity market. However, it is not possible for commodity prices to return to their normal prices very quickly, including oil. Therefore, I do not expect any relaxation in the FED's interest rate policy. In general, my expectation is that interest rates will lag behind inflation for a long time.
💥Weekly
On the weekly chart, we can better observe the reverse shoulder head pattern. The target of this pattern is around $102. However, the price received a strong downward reaction from the $93 resistance.
The purple ascending trendline is a support for the price.

XAU/XAG-IMPORTANT MOVEMENTS-DAILY‼Dear friends, the direction of long-term analysis does not change much. (Weekly-Monthly Trends)
But the length of daily and 4-hour trends is very short.
That's why we need to constantly update our short-term analyzes.
Today we will continue our gold and silver analysis.
💸Macroeconomic Overview
FED's hard interest rate hikes, along with precious metals, caused a general decline in the commodity market. However, it is not possible for commodity prices to return to their normal prices very quickly, including oil. Therefore, I do not expect any relaxation in the FED's interest rate policy. In general, my expectation is that interest rates will lag behind inflation for a long time.
💥Daily
When we examine the price chart on a daily basis, the 86.100 level is in the support position. The price fell hard from the 93 resistance and broke the yellow trend line downwards. After the price rises a little, it may want to withdraw to the purple trend support.

Gold/Silver Fibonacci ChannelSince the beginning of 2021 Gold/Silver parity making an obvious channel. $87 - $85 area is important support and $100 is the target. Even if parity decreases till $80 we're gonna be still in the channel and we still have chance to go to $100.

💹XAU/XAG WEEKLY TERMExamining the weekly chart, the price has been trading in an upside-down head-to-shoulder or a pinched sideways movement between the $85-60 levels.
Then it broke through this compression zone and started to rise.
There may be small reaction decreases, My guess the price will reach its target in 3-4 months.

💹XAU/XAG MONTHLY TERMWe are seeing a super cycle rise that starts at $30 in 2011 and continues to $125 in 2020.
The rise between 2011 and 2020 is a 5-wave rise.
After the completion of Wave 5, we had a sharp drop to the $63 levels, which was the corrective wave A of the 5 Wave drop.
My guess is that the price is currently moving within correction wave B.
I expect this corrective wave to last until the 0.618 maximum and 0.5 fibo level.

Hedging is so much more easier than sl just use your m.v.Hedging is so much more easier than sl just use your market values and study XAUXAG more using heiken ashi
of course trend better be your friend

xauxag looking up and down king is here for you test me in all
xauxag need to test that zone and to fall down i have strategy try stop loss 10 pips -20 pips

GOLDSILVER Spread- SELL ++The gold silver spread is very high, and it feels we may see adjustment to this spread coming weeks.
Strategy is SELL @ 87.50-88.00 and take profit around 81.75.

Start fightingThe indicators flickered. Silver rebounded in the medium term and rose in the last round. I announced the beginning. At present, the model matches perfectly, and a final rise is about to begin. The rally ended and began to short until November December. Let's start our fight.

XAU/XAGThe XAU/XAG ratio rose to 82-84 but could not exceed this level.
If it falls below the $75 level, it can continue to decline to the $68 level.
In the long run; Even if $68 levels are seen, I think the target is $94.
Pls Follow and Like For Support Us.

BETA TEST STRAT XAUXAG Long on the DailyBeta testing a new strat. XAUXAG Long on the Daily. Targets and SL on the chart.

New bull trend on the XAUXAG ratio as the monthly support holdsThe long term trend on the ratio is a bull as the monthly support holds against normal dumps. Gold may be preparing for any stock market crash against the silver will be bullish.


XAUXAGI think when wave 5 of 5 is complete, the price come back to down and it can affect on SIVER to goes up

Hedge for an expected silver pump against gold.Hedge for an expected silver pump against gold, unless the market crashes like march 2020 again


ShortThe gold silver ratio fell below the trend, and another small five waves are expected to dominate the later days of the week. Then it is expected to reverse soon next week, and the gold silver ratio will rise for some time.

Sharp riseIn the next few weeks, the gold silver ratio will start to rush to the top. It should be super fierce. I won't do much silver. Gold and silver are up 21.5% over 4-5 weeks, which is very fierce. If you go down directly, it is not in line with human psychology and emotion. Until I wanted to do more. The gold to silver ratio will fall. Note that gold and silver will fall sharply in the next two months.

ShortNext week, the gold and silver ratio is expected to fall, and it is the last period of the first wave of decline. Next, it needs to rebound about 0.618. The lowest point may be on Friday. On that day, the moon phase also changed, which is easy to correct. Gold fell sharply last week, but silver almost didn't fall in the end, indicating that silver wants to rise very much. Finally, silver will reach the top around 33-35.

Gold and silver plummeted if they broke the red lineXauxag next, the key position is at the red line. If it can break through, it will rise explosively. If not, it will reach the peak in the medium term. Rising is almost certain to rise, but space is crucial. Breaking through the red line and not breaking through determine the fate of gold and silver.
LongThe gold silver ratio has just reached the position I analyzed before. I believe the correction has ended. Let's look forward to the next substantial rise. This promotion is the end of the first round, and there will be a second round in the future. Silver's future is worrying. It is expected that gold will reach the bottom one step ahead of silver. This time, the gold silver ratio will rise, which may make gold reach the bottom first. Like $1620.
