Brent crude: why I'm not trading oil right nowBrent crude surged earlier this month on war headlines, and our trade setups nailed the moves. But right now, the market offers no edge. Volatility is fading and price is stuck in a large triangle. Unless you have geopolitical insight, there's no clear reason to trade. In this video, I explain why I'm staying out and what I’ll look for next.
This content is not directed to residents of the EU or UK. Any opinions, news, research, analyses, prices or other information contained on this website is provided as general market commentary and does not constitute investment advice. ThinkMarkets will not accept liability for any loss or damage including, without limitation, to any loss of profit which may arise directly or indirectly from use of or reliance on such information.
XBRUSD trade ideas

Brent Oil Breakout Heist – Bullish Robbery in Progress!🕶️ Brent Oil Job in Motion – Market Robbery Blueprint by The Chart Bandits 💼💸
What’s up, gang? 👋 Hola, Ola, Bonjour, Hallo, Marhaba! 🌍
Calling all market robbers, trend thieves, and slick profit snatchers! 🤑💰💥
We’ve got eyes on the UK Oil Spot / Brent Energy Market – and this time, it’s a clean breakout job. According to our Thief Trading Code (yeah, that’s the street manual we use), the setup’s lit and the vault’s wide open. Here’s the drill:
📈 Entry Plan – The Break-In Point:
The score begins above MA level 65.400. When that line cracks, it’s time to move.
You can either:
🔹 Set buy stop orders just above the breakout zone
🔹 Or wait for a pullback to a 15m or 30m swing low/high and enter with style
🚨 Pro tip: Set your alerts. Real thieves don’t sleep on breakouts.
🛑 Stop Loss – Safety First, Bandits:
Let the breakout breathe. Don’t slam the SL too early.
Once it confirms, tuck your SL near the 4H swing low – around 64.000.
Lot size, risk appetite, number of positions – all play into where you hide your exit door.
Just don’t blame the crew if you jump in blind. ⚠️
🎯 Take Profit – The Escape Route:
Target set at 70.000 – hit it, grab the bags, and disappear before the bears sniff us out. 🏃♂️💨
📊 Why This Heist Works:
The market’s lookin’ bullish – real heat from fundamentals like:
Macro setups
COT positioning
Intermarket analysis
Sentiment vibes
Storage & inventory updates
🔍 Want the full blueprint? Fundamentals, charts, deep dives – check my profille for the linkss 🔗👀
⚠️ Heads-Up – News Drops Can Wreck the Getaway:
Don’t enter during high-impact news
Protect profits with a trailing SL
Always expect the unexpected, robbers 🚧📉
💥 Smash the Boost Button if you’re part of the Thief Crew!
We’re not just trading – we’re executing blueprints and stealing clean gains.
Stay tuned for the next setup. You know what time it is...
🕶️ Trade smart, loot fast, vanish smooth. 🐱👤💸🚀

UKOIL - Midterm Buy Cycle UKOIL
MIDTERM BUY CYCLE
TP@80.04
% Bubble Ratio
Currently in a negative bubble with fair value at 80… cycle is midterm and expecting to reach the TP in less than a year…
Spot Trading Plan:
Entry starts at -30% bubble ratio and below

XBRUSD is testing the Support Level 66.10 👀 Possible scenario:
Oil prices steadied on June 26 after erasing earlier gains as investors remained cautious about the Iran-Israel ceasefire and refocused on market fundamentals. Brent crude is trading around $66.80 per barrel.
U.S. crude oil and fuel inventories fell sharply in the week ending June 20, with crude stocks dropping 5.8 million barrels—well above the expected 797,000-barrel decline, the Energy Information Administration (EIA) reported. Crude production rose slightly by 9,000 barrels per day to 13.43 million b/d. Meanwhile, crude imports decreased by 102,000 b/d to 6 million b/d, and exports fell by 8,000 b/d to 3.96 million b/d. OPEC+ may accelerate output hikes by about a year, according to Rosneft’s CEO. Analysts noted oil prices tracked equities lower amid these mixed signals.
✅ Support and Resistance Levels
Now, the support level is located at 66.10.
Resistance levels are now located at 77.50 .

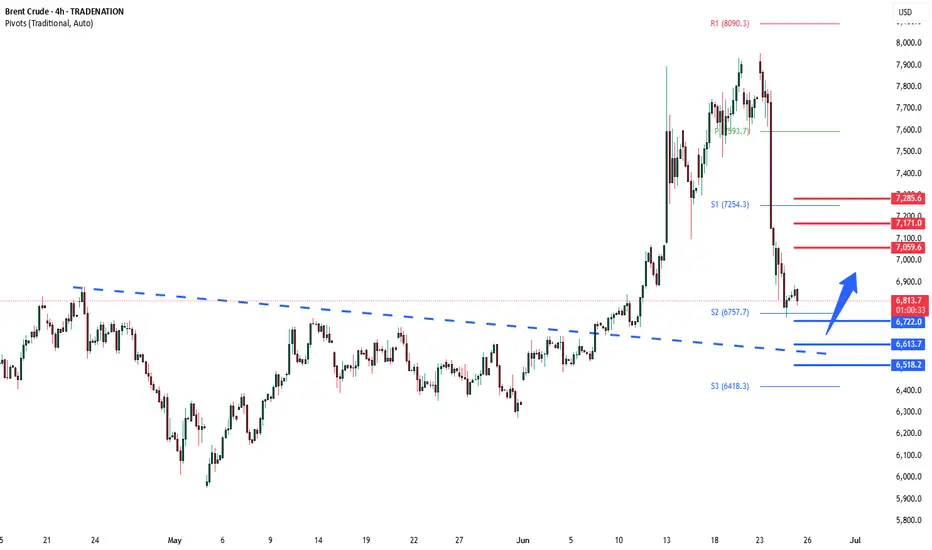
Bren Crude Oil important support at 6720Key Support and Resistance Levels
Resistance Level 1: 7060
Resistance Level 2: 7170
Resistance Level 3: 7280
Support Level 1: 6720
Support Level 2: 6610
Support Level 3: 6520
This communication is for informational purposes only and should not be viewed as any form of recommendation as to a particular course of action or as investment advice. It is not intended as an offer or solicitation for the purchase or sale of any financial instrument or as an official confirmation of any transaction. Opinions, estimates and assumptions expressed herein are made as of the date of this communication and are subject to change without notice. This communication has been prepared based upon information, including market prices, data and other information, believed to be reliable; however, Trade Nation does not warrant its completeness or accuracy. All market prices and market data contained in or attached to this communication are indicative and subject to change without notice.
XBRUSD broke the Support Level 69.90 👀 Possible scenario:
Oil prices dropped more than 3% on June 24 after U.S. President Donald Trump brokered a ceasefire between Israel and Iran, easing fears of a wider conflict disrupting Middle East oil flows.
Analysts said the risk premium built into oil prices has quickly faded, with focus shifting away from threats to the Strait of Hormuz. Macquarie expects U.S. crude stocks to fall by just 0.9M barrels last week—down sharply from the prior 11.5M-barrel draw. Exports likely dropped by 0.6M b/d, while imports rose by 0.7M b/d. Gasoline, distillate, and jet fuel inventories are all expected to have increased.
✅Support and Resistance Levels
Now, the support level is located at 66.10.
Resistance levels are now located at 77.50 .

Brent Crude still in controlled yr 2025 range ~ 75 - 71 - 63 USThe Brent crude oil price today underwent a technical correction in the D1 / Day time frame as seen from a technical analysis standpoint. It has not yet broken out to indicate Panic in markets of while being within controlled thresholds .
2025 opening price level : USD 75 ;
MAY face support at USD 71 which is JUNE resistance ; can range around this price line
Next drop below June 2025 opening price : USD 63
Experience in markets also say that in order to go Up , markets need a timely Correction (preliminary down move )too !!
Time to Wait and Watch !

Brent oilOil prices fell! Trump's tweet sent oil prices lower. But the last three candles were probably because the market was expecting a stronger reaction from Iran, but it is likely that the US will not respond again.

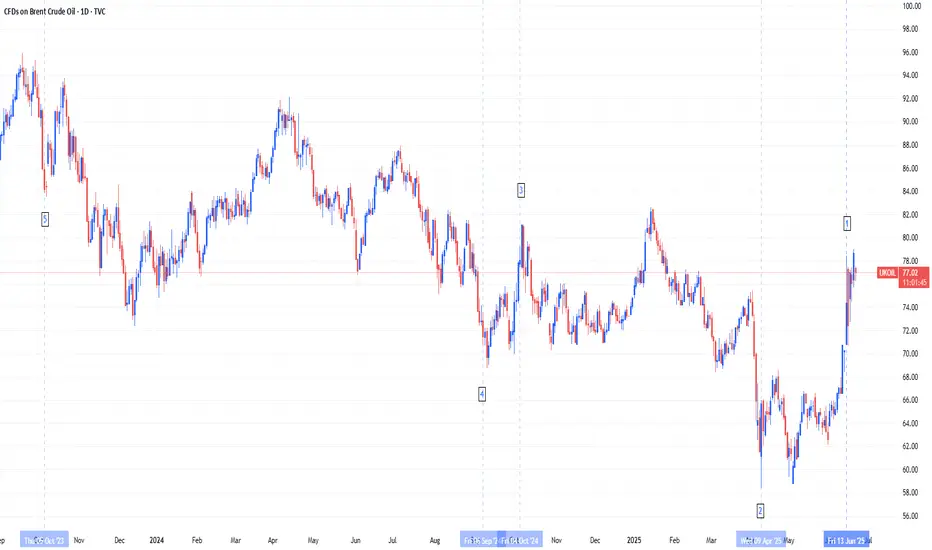
Brent Crude Oil's Defining Moments: Analyzing the Top 5 MovesThe oil market has experienced unprecedented volatility over the past two years, with five pivotal moments generating the most significant price movements in Brent crude.
The Top 5 Market Movers:
1. June 13, 2025 (+7.02%): Israeli airstrikes on Iranian nuclear and oil facilities triggered the largest single-day surge to $74.23/barrel, demonstrating how geopolitical events can instantly drive supply disruption fears.
2. April 8, 2025 (-15.67% over 5 days): Trump's tariff escalation and US-China trade war intensification caused the most severe multi-day decline, ending at $62.82/barrel as traders priced in global economic slowdown.
3. October 7, 2024 (+12.76% over 5 days): Escalating Israel-Iran tensions drove a significant rally to $80.93/barrel as markets built in geopolitical risk premiums ahead of expected retaliatory strikes.
4. September 3, 2024 (-6.41%): Libya's oil dispute resolution combined with weak global demand outlook caused a sharp drop to $73.75/barrel, showing how supply resolutions can trigger selloffs.
5. October 6, 2023 (-11% weekly crash): The end of driving season combined with demand concerns and interest rate fears triggered the biggest weekly decline since March 2023, with Brent falling to $84.07/barrel as gasoline demand hit yearly lows.
Current Fundamental Landscape and Path Forward
The EIA forecasts Brent averaging $66/barrel in 2025 and $59/barrel in 2026, below recent levels due to trade uncertainties and slower growth. Three key factors will drive future prices: US-China trade resolution, Middle East geopolitical risks, and OPEC+'s production strategy. Recent volatility shows that while fundamental supply-demand dynamics remain important, geopolitical events, trade policies, and seasonal demand patterns can generate dramatic price swings that overwhelm traditional market forces.
Brent Crude Oil Bullish above 73.50Key Support and Resistance Levels
Resistance Level 1: 77.50
Resistance Level 2: 78.90
Resistance Level 3: 80.50
Support Level 1: 73.50
Support Level 2: 72.30
Support Level 3: 71.00
This communication is for informational purposes only and should not be viewed as any form of recommendation as to a particular course of action or as investment advice. It is not intended as an offer or solicitation for the purchase or sale of any financial instrument or as an official confirmation of any transaction. Opinions, estimates and assumptions expressed herein are made as of the date of this communication and are subject to change without notice. This communication has been prepared based upon information, including market prices, data and other information, believed to be reliable; however, Trade Nation does not warrant its completeness or accuracy. All market prices and market data contained in or attached to this communication are indicative and subject to change without notice.

Brent and WTI: Is $100 oil just Around the corner?#Brent and #WTI prices are steadily climbing, now reaching $73.30 and $71.15 per barrel. The market is showing strong signs of an upward trend, similar to what we saw in 2021–2022. With global demand picking up and increased interest from major market participants, analysts believe prices could soon push past the $100 mark — especially amid ongoing global tensions and rising consumption.
Standard Chartered forecasts Brent reaching $95 by December 2025, while some outlooks go even higher. What’s fueling this potential rally? Top 5 reasons oil may surge in the coming months:
Global instability : Tensions in the Middle East and unrest in key producers like Venezuela and Nigeria raise concerns about supply disruptions. Any flare-ups could push prices to $90, $95 — or beyond.
Economic recovery : Asia and developing economies are bouncing back fast. With industrial activity rising, so does energy demand — including for oil.
OPEC+ tight supply policy : OPEC+ is likely to maintain production cuts to support prices and keep the market balanced.
Low reserves, limited expansion : Stockpiles remain tight, and exploration has lagged in recent years. If demand spikes, producers may struggle to scale output quickly.
Aviation and petrochemicals rebound : Global air traffic and plastic manufacturing are growing, increasing demand for jet fuel and oil-based feedstocks.
Together, these factors create a strong setup for upward momentum in Brent and WTI prices. According to FreshForex analysts , the current levels could mark the beginning of a new growth cycle.

XRPUSD is moving within the 2.1215 - 2.3370 range👀 Possible scenario:
XRP is consolidating between $2.05 and $2.40, forming a bullish pennant on the weekly chart — similar to the 2017 setup before a 1300% rally. Analyst Mikybull Crypto predicts a 530% surge to $14 if resistance breaks. For continued upside, XRP must break above the 200-day SMA ($2.37) and hold above $2.65. RSI has climbed from 29 to 52, signaling recovery. A breakout above $2.65 could lead to $3.00 or even the 7-year high of $3.31. Failure to break $2.37 may send price back to $2.05.
Network activity is surging: XRPL is averaging 295K daily active addresses — 7x the 3-month average. Whale wallets (holding 1M+ XRP) hit a record 2,708, signaling growing institutional interest. Trident Digital plans a $500M XRP treasury, Circle launched USDC on XRPL, and Guggenheim is issuing digital commercial paper on the network. A spot XRP ETF approval could drive price to $25. Trading volume jumped 245%, open interest rose to $4.02B, and derivatives volume hit $9.8B. Price hovers around $2.22 as the market reacts to on-chain momentum.
✅Support and Resistance Levels
Support level is now located at 2.1215
Now, the resistance level is located at 2.3370.

Brent Crude Hits Key Supply Zone After BreakoutPrice has aggressively broken out from the descending wedge and reached a strong 4H & 1D resistance zone between 74.50–76.00.
• 1D Chart: Sharp breakout from long-term descending trendline. Approaching resistance from Feb-April supply area.
• 4H Chart: Bullish structure confirmed by higher lows and breakout of ascending channel.
• 1H & 23m Chart: Consolidating beneath resistance, forming a triangle structure.
Key Zones:
• Support: 71.50–72.00
• Resistance: 74.50–76.00
Bias: Neutral short-term (range). Bullish if 76 is broken and held.

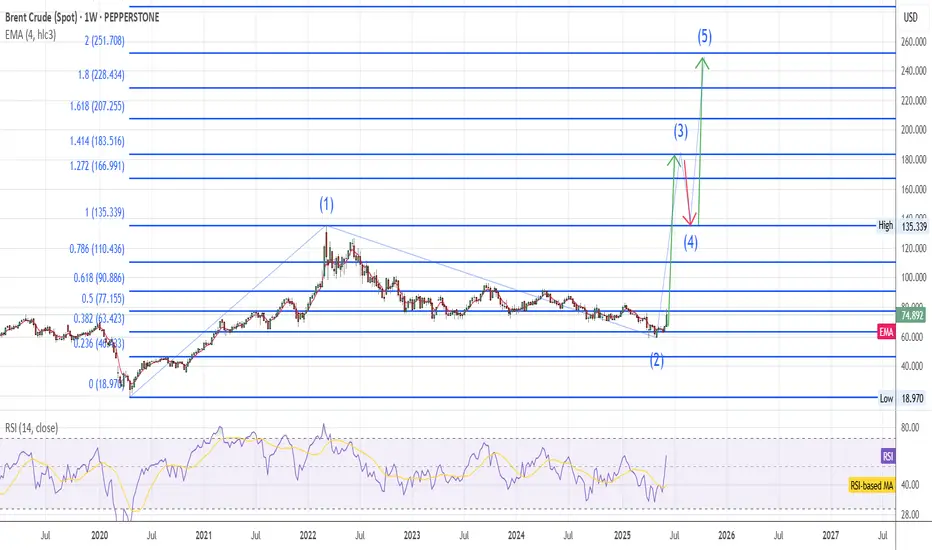
Brent UpdateOn the long term chart wave #2 was completed in the last 2 weeks and wave #3 ha started, I expect massive bullish move for Brent due to Israel-Iran conflict , target 255$
The Tell all of the conflict between Israel and Iran escalationBreak out of the top range and It's not looking good. Fall back into lower range and we should be gravy for awhile.
Not financial advice. DYOR

BRENT CL Technical & Economic Outlook: Geopolitical Tensions
Brent Crude Oil has surged 9% in just one day due to escalating tensions between Iran and Israel, underscoring the volatility in global energy markets. Here’s a breakdown of the key levels and the economic impact:
Resistance at 76.236:
This remains a strong resistance zone. A breakout could indicate more upside, with oil prices potentially reaching higher levels as geopolitical risk mounts.
Equilibrium at 73.535:
The market is stabilizing here, reflecting a balance between buying interest and caution. Consolidation may lead to further volatility as traders digest the geopolitical fallout.
Discount Zone at 71.952:
If the market retraces, this level offers a potential buying opportunity, as demand remains strong in this zone.
RSI at 57.96:
The RSI suggests neutral momentum, but the market could soon enter overbought conditions, making it crucial to watch for potential price exhaustion.
Economic Drivers:
Inflation: A surge in oil prices could worsen inflation globally, increasing costs across industries.
Geopolitical Risks: The ongoing conflict is likely to disrupt global supply chains, especially oil production.
What’s Next?
Bullish: Watch for a breakout above 76.236 to confirm a continuation of the rally.
Bearish: A failure to hold equilibrium could suggest a pullback to the discount zone, offering a buying opportunity.
Stay alert to the evolving geopolitical situation and its impact on oil price volatility.
Follow @GoldenZoneFX for more content and valuable insights.

BRENT CRUDE OIL Long Positionafter making a high of 76.45 brent has posted a potential HL t 71.3 and now forming a bullish flag if it breaks the pole then it can futher go high, we will make entry at 76.5 at pole breakout by making SL at 71.3 nd TP at 81.7

Oil spikes as Israel strikes Iran: What traders need to knowOil prices surged after Israel attacked Iran’s nuclear sites, reversing the recent downtrend and reigniting inflation fears. In this video, we break down the chart patterns, explain the move, and explore what could come next. Is this the start of a new uptrend or just a short-lived spike? Watch for key levels, risk management tips, and trading strategy insights.
This content is not directed to residents of the EU or UK. Any opinions, news, research, analyses, prices or other information contained on this website is provided as general market commentary and does not constitute investment advice. ThinkMarkets will not accept liability for any loss or damage including, without limitation, to any loss of profit which may arise directly or indirectly from use of or reliance on such information.

Israel Strikes Iran. Oil and Gold Prices SurgeIsrael Strikes Iran. Oil and Gold Prices Surge
According to media reports, Israel launched a large-scale overnight strike on Iranian territory, targeting dozens of military and strategic facilities linked to the country’s nuclear programme and missile capabilities. Israeli officials justified the action by citing an existential threat from Tehran, which, according to their intelligence, is accelerating its development of nuclear weapons and expanding its arsenal of ballistic missiles.
In response, Iran has vowed severe retaliation, stating that the United States and Israel will “pay a heavy price” for the attack. US President Donald Trump has urgently convened a meeting to assess the situation.
Commodities Market Reaction
In the wake of these developments, gold — the primary safe-haven asset — surged sharply. The XAU/USD price broke above its May high, rising past $3,440. However, the all-time high near $3,498 remains intact for now.
Oil prices also spiked due to fears of supply disruption. The military conflict threatens shipping through the Strait of Hormuz, a crucial chokepoint through which one-fifth of the world’s oil supply passes. Traders quickly priced in the risk of war, anticipating a supply shortage driven by large-scale instability in the Middle East.
Technical Analysis of the XBR/USD Chart
Brent crude oil price has risen to the upper boundary of a large-scale descending channel (shown in red), which is defined by lower highs from 2024–2025. As anticipated, this upper boundary acted as resistance, with the price forming a peak above $76 before reversing downward (as illustrated by the black arrow).
From a technical standpoint, following such a sharp rally, Brent is vulnerable to a corrective move. In this scenario, a pullback into the orange zone is possible, where support may be found at:
→ The psychologically important $70 level;
→ The 50% Fibonacci retracement level;
→ The former resistance of the purple descending trendline, now turned support.
Nevertheless, given the scale of the geopolitical threat, it is unlikely that market sentiment will allow Brent to decline significantly in the near term.
This article represents the opinion of the Companies operating under the FXOpen brand only. It is not to be construed as an offer, solicitation, or recommendation with respect to products and services provided by the Companies operating under the FXOpen brand, nor is it to be considered financial advice.

Slowing Global Economy and Output Hikes Weigh on Brent OilBrent crude oil is holding steady around the $60 level, even after OPEC announced another 411,000 barrels per day increase in output, following similar hikes in May, June and smaller one in April. This latest adjustment comes at a time when global economic slowdown concerns are rising, making the decision a risky one. Although the main reason points to non-compliance from Kazakhstan and Iraq, some believe the United States may have played a role, possibly through pressure from Trump aimed at controlling inflation during the ongoing tariff hikes.
With several consecutive production increases now in place, a growing surplus is likely to develop over the second half of 2025. This would maintain downward pressure on oil prices if demand fails to keep pace. At the same time, the broader economic outlook is weakening. Recent manufacturing activity data from China, the United States, the European Union, and the United Kingdom all came in below 50, suggesting a faster rate of contraction. The presence of widespread tariffs is expected to continue weighing on business sentiment and consumer demand, potentially leading to rising unemployment and slowing growth.
In this environment, any short-term spikes in Brent and WTI prices are likely to remain opportunities to sell, unless there is a meaningful shift in underlying fundamentals. For a more detailed view of economic trends, please refer to the latest monthly report.
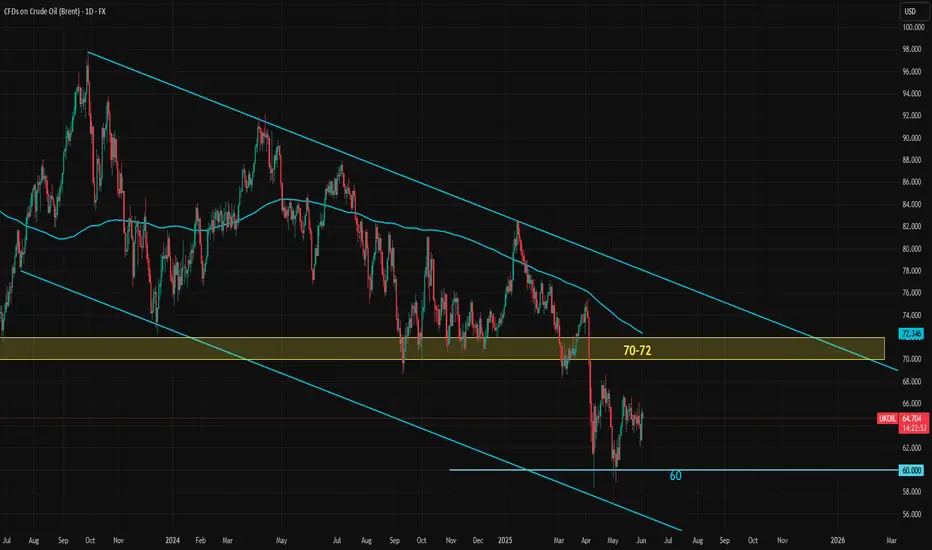
Brent crude has been in a steady downtrend since March of last year. While the price movement doesn't follow a perfect trend channel, the structure has generally held well. At the moment, Brent is hovering near the middle of this declining channel.
The former long-term support zone around $70 to $72. If prices move up toward this zone, it could present a fresh selling opportunity as long as the resistance holds. On the downside, the $60 level and the area just below it have formed a solid medium-term support, which has held up so far.
Still, oil bulls should be cautious around the $60 mark. Even though support looks strong for now, the overall direction of the trend and the broader fundamental backdrop suggest that this level could eventually break. Any long positions taken near current levels should factor in the potential for renewed downside pressure.
Oil Brent Brent oi
According to the trend I see, Brent oil will probably drop to the $25 range, and it will be due to the reduction in tensions between Iran and the United States.

Brent Oil Intra-day Analysis 12-Jun-25Drawing possible scenarios we could see on Brent Oil prices.
Keep in mind fundamentals supporting the move up on oil:
* Geopilitical escalations between Russia and Ukraine
* Opec+ production policy
* US - China Trade talks and demand optimisim
* Geopolitical tensions between US and Iran.
Disclaimer: easyMarkets Account on TradingView allows you to combine easyMarkets industry leading conditions, regulated trading and tight fixed spreads with TradingView's powerful social network for traders, advanced charting and analytics. Access no slippage on limit orders, tight fixed spreads, negative balance protection, no hidden fees or commission, and seamless integration.
Any opinions, news, research, analyses, prices, other information, or links to third-party sites contained on this website are provided on an "as-is" basis, are intended only to be informative, is not an advice nor a recommendation, nor research, or a record of our trading prices, or an offer of, or solicitation for a transaction in any financial instrument and thus should not be treated as such. The information provided does not involve any specific investment objectives, financial situation and needs of any specific person who may receive it. Please be aware, that past performance is not a reliable indicator of future performance and/or results. Past Performance or Forward-looking scenarios based upon the reasonable beliefs of the third-party provider are not a guarantee of future performance. Actual results may differ materially from those anticipated in forward-looking or past performance statements. easyMarkets makes no representation or warranty and assumes no liability as to the accuracy or completeness of the information provided, nor any loss arising from any investment based on a recommendation, forecast or any information supplied by any third-party.

Brent Bulls Eye $74 & $81 — 2 Profit Points, 1 Tight StopBrent crude has confirmed a bullish breakout on the daily chart after closing decisively above the key horizontal resistance near $66.65. This level had acted as strong overhead pressure over the last two months but has now flipped into support, reinforcing the bullish sentiment.
Price is currently trading at $68.18, just above the newly established support zone, and showing strength after consolidating in a tight range. The Ichimoku Cloud system further validates this bullish move. The price has cleanly broken through the Kumo (cloud), and the Tenkan-sen has crossed above the Kijun-sen, forming a classic bullish crossover. The Chikou Span is also above the price, indicating momentum is firmly in the bulls’ favor.
The immediate upside target is the $74.38 resistance, which corresponds to a key prior swing high from earlier this year. This zone is expected to act as the first major take-profit level for swing traders. If the bullish momentum persists, the next target lies at $81.40, a previous supply zone and psychological resistance. The path from current levels to that area appears technically open, with relatively little congestion in between.
Risk-reward analysis supports the long setup. Entering near the current price, with a stop-loss just below $66.10, provides a downside risk of around 3%, while the potential upside to TP1 and TP2 offers gains of approximately 9% and 19%, respectively. This yields a favorable R:R of roughly 1:3 to 1:6, depending on the exit strategy.
For scalpers, the area around $68.42 marks an intraday take-profit zone. However, scalpers must adjust their stop-losses dynamically, based on individual risk tolerance. A tighter stop might sit around $66.65, while more conservative scalpers may prefer to give room down to $66.10.
The secondary support around $58.83 marks a major floor but is currently distant and would only be in play if Brent fails to hold $65—an unlikely scenario given current strength and volume.
In summary, Brent crude’s technical structure favors further upside, with bullish momentum confirmed by both price action and Ichimoku alignment. A retest of $66.65 could present a buying opportunity, but failure to hold above that would invalidate the setup. As long as the price stays above the cloud and key supports, the bullish case remains intact.
