Do not do it Delik!!! )The most popular exchange to buy and trade Onyxcoin is KuCoin, where the most active trading pair XCN/USDT has a trading volume of $18,141,043 in the last 24 hours. Other popular options include Coinbase Exchange and Bithumb.............
XCNUSDT trade ideas

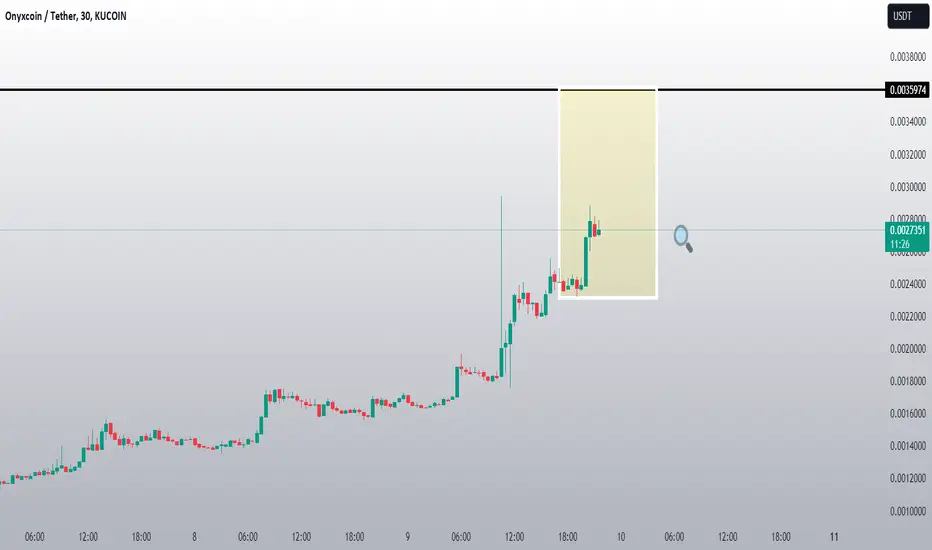
XCN/USDT Hourly AnalysisThe price has broken out of the resistance zone and the black trendline.
📊 Scenario:
If the potential pullback is successfully confirmed:
🎯 First Target: Green line level

ONYX , together with jasmy this will melt faces!ONYX , together with jasmy this will melt faces! ONYX will reach 0.05 cents with the current run! Really promising coin and potential! I would buy a real heavy bag! easy 5X , Max bull target 15 cents!

Bullish after weekly retracement on XCN This coin is recovering nicely from bottoming out! Just like most coins that bottom return and hit a higher if not the same ATH. NFA; this is my gem for now!

$XCN about to fly SEED_DONKEYDAN_MARKET_CAP:XCN is inside a descending wedge
Support: $0.0011928
First Target: $0.0013000 - $0.0013500
Breakout Target: $0.0018000 - $0.0020000
Downside Target: $0.0010000 or below

$xcn #xcn crypto - #NoanFam @CryptoNoanSEED_DONKEYDAN_MARKET_CAP:XCN #xcn #cryptocurrency trading with neutral bias with indication of bullish formation as shown on the chart
1) Long - entry on retest of trendline support
2) long - entry on bullish break out
3) short - entry on breach of trendline support

4 Hours Chart Indicate a Price Action Reversal to the Upside. Keep an eye on this chart. It looks like it is making a bullish hidden divergence on the 4 hour chart. If the horizontal red line drawn holds true, then there is a potential of a reversal price action to the upside.
Not a financial advice.


XCN Scam Coin Season XCN , Chain back then , was a highly seeked coin 1 year ago, until it crashed 95% at once. According to Deepak.eth, CEO of Crypto.com, a single large margin call appears to have exacerbated the flash crash. As much as 500 million XCN worth of tokens purchased ($42.24 million at time of publication) through leveraged was liquidated within a short period .
All the scam coins ftt and luna coins pumping lately , it may actually be Scam Coins Season . Just today , Open Interest change/24h is on a 89.27%. We may actually see hundreds percents gains if this sh1tcoin gains traction.
Disclaimer: DYOR . This is not an investment advice .

XCN NEW VOLUME STARTThank you for reading this update.
Depending on our study we see that XCN has a good chance of volume increase.
This updates depending on day trade, And the market should confirm with time the right market way.
#Nottradingadvice
#For day traders take always profits when market increase
#Expect noting from the markets, but follow what it shows.
XCN and shitcoin season
I cannot figure out how someone would still invest in such shitcoin, but I gained 5X from this coin before, and I am welling to get 2X now.
Risky trade but XCN seems to continue going up

XCNUSD 300% POTENTIALXCNUSD, breakout occured, i see there is 300% pump potential to closest resistance, but there is also probablity to pump higher.

XCNUSDT?I like this one too, but my hands are full.
If you like it..
Past the resistance
Just need the patience.
Waiting for new volume to kick in.
New in space, welcome feedbacks
All the best
Manage well ya coz these asset/trading bit different consideration for risk profile

XCNUSDT will risehello guys how are u
this xcusdt in a support orderblock
nice position
good luck with it
dont forget support me

#XCN/USDT is holding PWL as a strong support level in Daily TF!#XCN/USDT is holding PWL as a strong support level in Daily TF!
Keeping an eye on Trendline, If it Breaks the Trendline the BO will be massive.

Is it growing well?It seems that it is ready for a good climb
It has a good volume and is placed in the saturated zone in weekly time and if we look at the past chart, it has completely filled the shadow
You also check

XCN | Significant Bullish DivergenceXCN | Significant Bullish Divergence
- No telling how low this sucker can go.. but.. I can't help but see this bullish divergence.
- Opened a Futures Grid 5x LONG bot
- DCA bought the dip
- All speculative

XcnUsdt LongThis coin has broken above the trend line and started consolidating above it, the general sentiment is also okay, so i expect this pair to keep on moving up. Try opening a long position.

A decent RR ratio to bet for this scenarioNot sure whether XCN is a scam project.
But if this scenario comes true, the reward could be great enough.
I do not really think there is so much selling pressure on this coin. This dumping velocity is unusual.

Long XCNXCN has just tested the 1.618 Fibonacci level and we're seeing a golden bullish divergence on the 12-hour time frame. We did experience a bit of a fakeout dip, but I suspect that's due to low liquidity causing some delays in order fills. My long fill was a bit delayed so that’s why I’m saying this. As long as it doesn't dip below the wick, I'm feeling pretty bullish about this one.
This chart based off of The Elliot Wave Theory, Fibonacci, EMA’s, MacD , RSI , Momentum, and resistance/support zones combined with patterns.

XCNUSDT ALTCOINS CRYPTO WAKANDIANWhat i really wish for; in the coming days after cpi
XCN WTF IS THAT
Now we are all awre that we are accumulating liquidity both side of the market
I wish to stay Neutral But an Old WISE MAN ONCE SAID
GO SHOPPING WHEN THERE IS BLOOD IN THE STREET
LMAO WARREN
ICT STUDENT
This is not a financial advice OR TRADE SIGNAL
DYOR

XcnUsdt Long This pair broke above the resistance level and traded above, I expect this pair to continue rising

$XCN/USDT 8h (#Bybit) Descending trendline breakout & retestOnyxcoin (a.k.a. Chain) is pulling back to 200MA support after a clear bullish move and just printed an inverted hammer, looks good for more recovery.
⚡️⚡️ #XCN/USDT ⚡️⚡️
Exchanges: ByBit USDT
Signal Type: Regular (Long)
Leverage: Isolated (1.2X)
Amount: 6.9%
Current Price:
0.01463
Entry Targets:
1) 0.01435
Take-Profit Targets:
1) 0.01953
Stop Targets:
1) 0.01089
Published By: @Zblaba
Risk/Reward= 1:1.5
Expected Profit= +43.3%
Possible Loss= -28.9%
Estimated Gaintime= 3 weeks
$XCN #XCNUSDT #Onyxcoin #Chain
onyx.org
