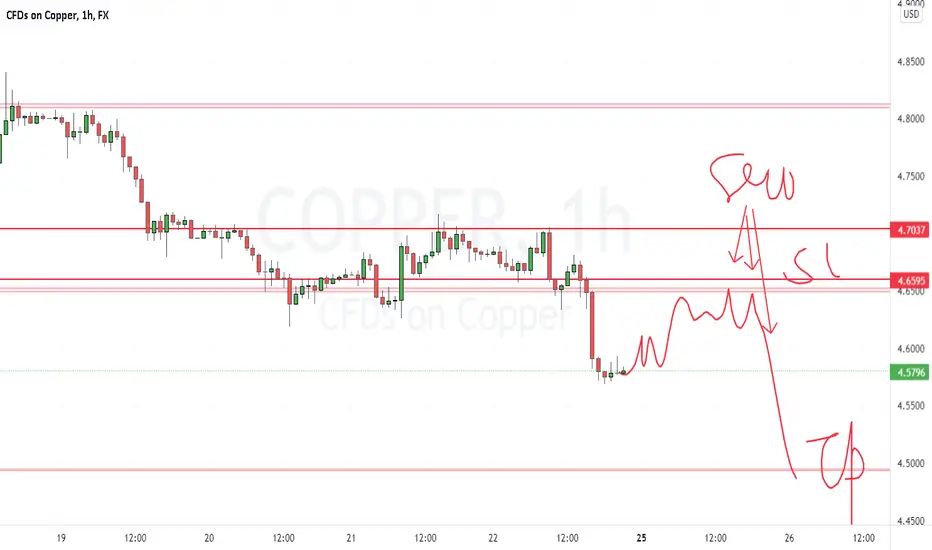
COPPER 25th APRIL 2022The world's demand for Hg/copper is reduced from the previous weeks, this could lead to a correction in copper prices.
there are sentiments to consider for trading COPPER. I usually use 2 sources to see the sentiment of big players:
1. LME : London Metal Exchange is a futures and forwards exchange with the world's largest market in standardized forward contracts, futures contracts, and options on base metals. The exchange also offers contracts on ferrous metals and precious metals.
www.lme.com
2. CFTC : Commodity Futures Trading Commission is an independent agency of the US government created in 1974, that regulates the U.S. derivatives markets, which includes futures, swaps, and certain kinds of options.
www.cftc.gov
It can be concluded that copper tends to be bearish for correction in the short term , but in the long term it still tends to be bullish .
1. Interest in the LME has decreased slightly from 684k to 675k: as in the theory of supply and demand, when goods are not in demand, prices will fall.
2. Contracts on metal trading on the CFTC tend to be more short contracts for the short term.
3. price breakout on the daily time frame, target to the next support level
XCUUSD trade ideas

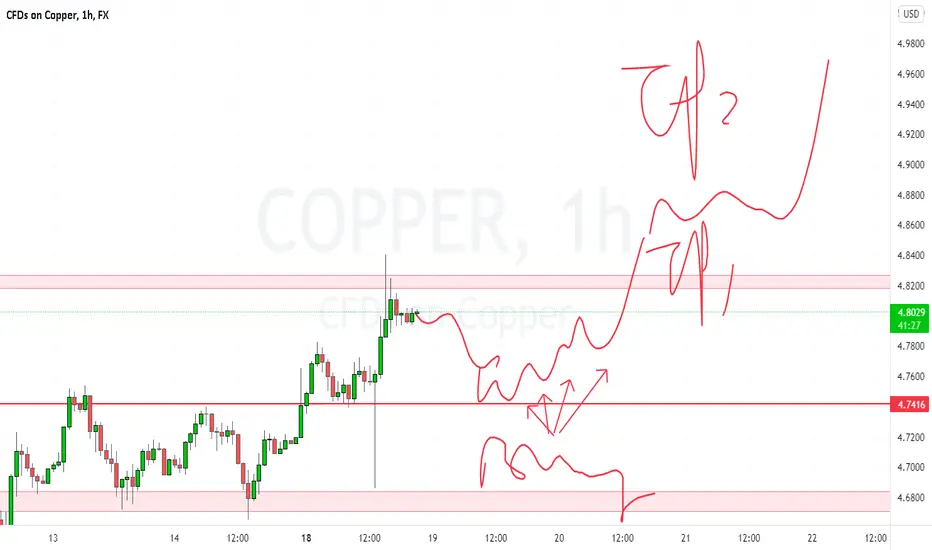
New strategy upgradeHi traders, this is my personal trading idea only. Please give an AGREE/ LIKE if you agree with my TRADING PLAN. My chaos drawing is not to predict and guess the further, it is my plan where we are on the chart and how we shall trade on what we see. My trading strategy is Price Auction - PA using Price movement only, your comments are highly welcome. Trade well & Good luck guys.
3I would like this idea on my public profile only, I don't mind if it's not in the trading view ideas section.


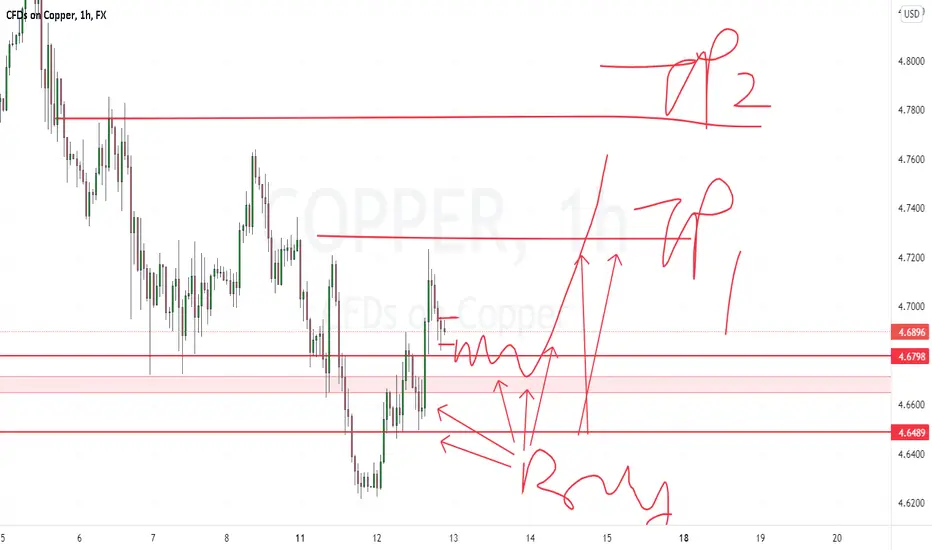
New strategy upgradeHi traders, this is my personal trading idea only. Please give an AGREE/ LIKE if you agree with my TRADING PLAN. My chaos drawing is not to predict and guess the further, it is my plan where we are on the chart and how we shall trade on what we see. My trading strategy is Price Auction - PA using Price movement only, your comments are highly welcome. Trade well & Good luck guys.

New strategy upgradeHi traders, this is my personal trading idea only. Please give an AGREE/ LIKE if you agree with my TRADING PLAN. My chaos drawing is not to predict and guess the further, it is my plan where we are on the chart and how we shall trade on what we see. My trading strategy is Price Auction - PA using Price movement only, your comments are highly welcome. Trade well & Good luck guys.
Jamie Gun2Head - Selling the Retest on CopperRetest of previous support now turned resistance. Looking for 3.6%.

Dr Copper: lifting its head (again)?Crossing above key resistance
A bullish trend direction is applicable above 4.70.
Crossing below this level will negate the bullish view.
Upside price momentum supports the bullish trend direction.
RSI leaves some room for further upside price potential.

Copper looks interestingIt seems we have an ascending wedge formation on the 3h timeframe
Further confluence would be to
1.Wait for the break of the structure
2. Look for a lower timeframe structure for dirty (it could be a flag, triangle or even a smaller wedge)
It's a long way down patience pay
There's enough time to plan the trade and trade the prepared plan

Rising wedge formation #CopperA rising wedge seem to be developing on the 4h approaching the upper boundary at a key level of resistance
Once price gets to the upper boundary we have a high probability bid goin' short


Copper overbought Copper has been in a huge uptrend due to global demand primarily in automotive but other sectors as well.
However, rising interest rates and geo political tensions will put a strain on trade and cause a sell off in commodities.
The technical pattern is rising wedge. It could take a few months for this to play out.

Inverse HeadnShoulders ?Looking for inverse HnS. Only entering on wedge break out and setting stops to BE, if neckline does not break (as I did today already^^)

The Copper Standard$1.20 worth of Australian 10c coins consists of 75% copper 25% nickel
Which means
12 x 10c AUD Coins = approx 2 Troy oz = (Cu = approx AUD) $6.31 x (2ounces x 0.75) + (Ni = approx AUD) $1.83 x (2oz x 0.25) = ($9.46 AUD + 0.92 AUD per 2 Troy oz) / 2 oz = 10.3763/2= $5.18 AUD
so if my math is correct, (and it is hard to get info on these metals in AUS, so figures are approximate) that means $1.2 AUD of 10c pieces is worth $5.18 AUD in metal
…Go figure
Shrapnel is now KING! Now I understand penny pinchers.
Ha ha haaa!

Is copper set to breakout towards 5.x ?Copper weekly chart show it is about to break upper trend line. There are many factors affecting copper price but technically it is going up towards $5.x

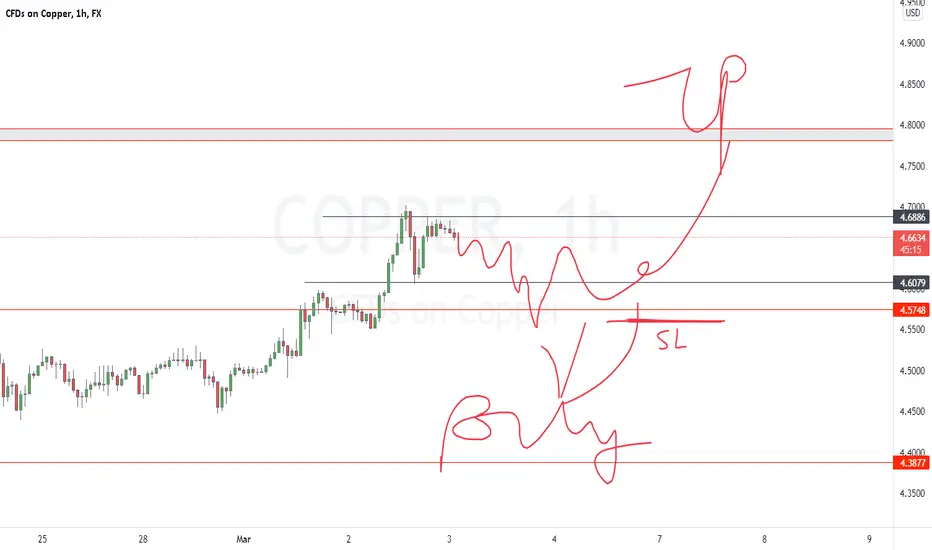
New trading strategy upgrade - CopperHi traders, this is my personal trading idea only. Please give an AGREE/ LIKE if you agree with my TRADING PLAN. My chaos drawing is not to predict and guess the further, it is my plan where we are on the chart and how we shall trade on what we see. My trading strategy is Price Auction - PA using Price movement only, your comments are highly welcome. Trade well & Good luck guys.

WTFWhat's driving copper right now? Is this anticipation of worldwide inflation or something? I can't make sense of this. Is this related to oil? Someone helo me.

Ichimoku: Survey COPPER You believe that? Ichimoku: Survey COPPER You believe that?
if you like my strategy, please strictly control the single loss between 1-2%. We have played many games in the market. The investment itself is very low-risk, and irrationality is the biggest risk.
My trading behavior report is available at the link below.
I can analyze the market in a short time, involving foreign exchange, encrypted currency, commodities and stock indexes.
Quality needs your long-term follow-up verification.
Your support and comments are the driving force of my update! and Thank you

Copper is ready for higher pricesCopper's been trading tightly above the 50d/200dsma and is joining the commodities boom seen in agriculture and energy
Here's a view of the weekly chart with the 50 week moving average. That tightness in price action is exactly what you want to see before a major move higher. Measured target is at least mid 5s

New trading strategy upgrade - CopperH traders, this is my personal trading idea only. Please give an AGREE/ LIKE if you agree with my TRADING PLAN. My chaos drawing is not to predict and guess the further, it is my plan where we are on the chart and how we shall trade on what we see. My trading strategy is Price Auction - PA using Price movement only, your comments are highly welcome. Trade well & Good luck guys.
copper 45 min assumption(short term)flat pattern assumption, expecting the next leg.
Copper price has been ranging for a while.
