Copper prices are facing bullish pressure, further upside! Copper prices are facing bullish pressure from our first support in line with our 38.2% fibonacci retracement and 78.6% fibonacci extension where we could see a bounce above this level. Ichimoku cloud and EMA are showing signs of bullish pressure, in line with our bullish bias.
XCUUSD trade ideas

Copper prices are approaching support, potential bounce Copper prices are approaching our first support in line with our 50% fibonacci retracement and 78.6% fibonacci extension where we could see a bounce above this level. Ichimoku cloud and EMA are showing signs of bullish pressure, in line with our bullish bias.

COPPER (XCU/USD) – Week 15 – Expecting the price to drop.Last week, Copper continued to lack volatility and moved sideways the whole week.
In the coming days, we expect the price to start falling and finish this complex correction, reaching the liquidity pool area that we highlighted on the chart.
Trade with care.
Best regards,
Financial Flagship
Disclaimer: The analysis provided is purely informative and it should not be used as financial advice. Remember that you need a plan before you start trading; so, take this knowledge and use it as a guidebook that will ultimately help you understand the market and easily predict your next move.

Copper bullish biasPossible technical scenarios for copper to reach 4.3 in the next week. Stop-loss at 4.0

Copper prices are facing bullish pressure, potential bounce Copper prices are facing bullish pressure from our first support in line with our 50% fibonacci retracement and 78.6% fibonacci extension where we could see a bounce above this level. Ichimoku cloud and EMA are showing signs of bullish pressure, in line with our bullish bias.

Copper prices are facing bullish pressureCopper prices are facing bullish pressure from our first support in line with our 61.8% fibonacci retracement and 100% fibonacci extension where we could see a bounce above this level.

Copper prices are facing bullish pressure, potential bounce Copper prices are facing bullish pressure from our first support in line with our 78.6% fibonacci retracement and 100% fibonacci extension where we could see a bounce above this level. Stochastic is testing our support at 7.55 as well where we could see a bounce above this level.

Copper prices are approaching support, potential bounce Copper prices are approaching our first support in line with our 78.6% fibonacci retracement and 100% fibonacci extension where we could see a bounce above this level. Stochastic is testing our support at 7.55 as well where we could see a bounce above this level.

Gold is approaching support, potential bounce Copper prices are testing our first support in line with our 78.6% fibonacci retracement and 100% fibonacci extension where we could see a bounce above this level. Stochastic is showing signs of bullish pressure as well, in line with our bullish bias.

Copper is testing support, potential bounce Copper prices are testing our first support in line with our 50% fibonacci retracement and 78.6% fibonacci extension where we could see a bounce above this level. Stochastic is showing signs of bullish pressure as well, in line with our bullish bias.

Copper prices are testing support, potential bounce Copper prices are testing our first support in line with our 50% fibonacci retracement and 78.6% fibonacci extension where we could see a bounce above this level. Stochastic is showing signs of bullish pressure as well, in line with our bullish bias.


Trade 2 - XCUUSD - Long Pattern fulfilledPrice = uptrend
Bullish Pattern fulfillment suggests further upside is possible soon
Order has been placed, awaiting trigger

Copper prices are approaching support, potential bounce
Copper prices are testing our first support in line with our 38.2% fibonacci retracement and 100% fibonacci extension where we could see a bounce above this level. Ichimoku cloud is showing signs of bullish pressure as well, in line with our bullish bias.

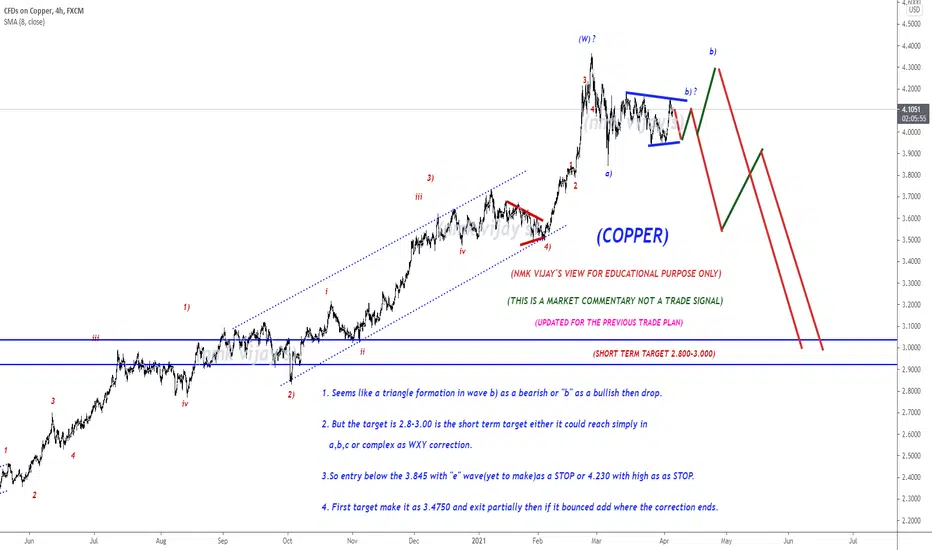
COPPER-Seems like a triangle either in b) or "b" ?Dear friends,
Don't follow me blindly...what i am sharing here, is my knowledge not signals
I am sharing my view through Elliott waves from past 4 yrs....i learned tons and tons here and market taught me lot and still teaching and i am listening to the market...and i am getting a lot of PM's regarding NEGATIVE COMMENTS from my friends...i am sharing here my view for a educational purpose and i am still a learner and i am sharing not my only my view and my experience if u PURELY LISTENNED to my MARKET COMMENTARY... i am not a market mover...just i am keep changing my view according to the PRICE ACTION and i written detailly about that in market commentary...there is no short cut to earn money and cant make a fast cash...if u do that also it may go like that....
My ambition is to create an awareness to the traders, to promote the education not to do BLINDLY...If u look my past 4 yrs chart and now...i fine tuned or refined my strategy...and still looking for finetune...so if u r following my trade plans as a signal its not my fault...If you are not encouraging also not mind but dont discourage...if you are not comment also dont leave the negative comments, if you are not motivate also dont demotivate...because NAGATIVE is more powerful than POSITIVE...i wont care about such comments...because of your comments i wont stop anything in MY PRACTICE...it will take time and to digest such comments for first 2-3 days and again i rebuilt my positive activity and my view and then again i keep start my sharing...i dont need a roadblocks in my journey. If it happen also i need to cross that and i continue...but that crossing time is DELAY for my journey to reach my GOAL...so try to be a friend...just learn or leave .if you didnt like a page in your story book just turn that... Don't look that, Like that dont look my chart...just skip that...thanks lot ...here some quotes by BRUCE LEE...
1. I fear not the man who has practiced 10,000 kicks once, but i fear the man who has practiced one kick 10,000 times "
2. A GOAL is not always meant to be reached, it often serves simply as something to AIM at
3. Those who are UNAWARE they are walking in darkness will never seek the light
4. To hell with circumstances i create the opportunities
5. I don't teach you anything. I just help you to know yourself
6. Always be yourself, express yourself, have a faith in yourself, do not go out and look for a successful personality and duplicate it.
7. Don't fear failure... in great attempts it is glorious even to fail
8. Absorb what is useful, reject what is useless, add what is specifically your own
9. Notice that stiffest tree is most easily cracked, while the bamboo or willow survives by bending with the wind
10. The successful warrior is the average man with laser-like FOUCS -
Market Commentary:
LEARNING ELLIOTT WAVES IS LITTLE BIT TOUGH (FOR ME IN BEGINNING) BUT I TOOK IT AS A CHALLENGE AND THAT IS NOT IMPOSSIBLE ALSO...
First have an look for the positional trend i shared here previous....if you are a follower of me...and sometimes i will share the counter trend trade also in 15 mins and 1hr...but that is risky ones...so if the trend is bearish or bullish, if i am expecting the correction...book the profit there and wait the correction to end and again go with the trend....DONT TRADE THE COUNTER TRADE SETUP...you will took loss too...try to identify the short term pull back and the long term pull back after that took small lots in the short term PB with strict stop and go with big lots in the trend side that is long term. I WONT TOOK ALL THE TRADE PLAN SHARED HERE...
Read the market commentary inside the chart what i shared here carefully and try to learn Elliott waves...otherwise its tough to understand the market commentary and my analysis. I wont give a entry, stop loss and take profit in my chart...it is only for EDUCATIONAL PURPOSE and i am sharing how i am analyzing the pair and labeling them according to the Elliott wave theory...I AM JUST SHOWING THE TREND HOW IT MAY GO AND MY VIEW(it may wrong too)..so DON'T FOLLOW BLINDLY MY CHART..take this as a reference and if it correlate to you strategy took the trade as per your strategy...DON'T ASK ABOUT YOUR RUNNING TRADES i wont comment on them and I WONT SUGGEST TO TAKE MY TRADE SETUP.
I am a technical analyst based on trendline, channel, fib retracements, expansion, stochastic for divergence, EMA's and MA's are finding the pull backs and MAJOR IS ELLIOTT WAVES...those mentioned above are using as a TOOLS only. I am not a fundamental, sentimental trader...but only the fundamental will boost my technical analysis to reach my target or sometimes it will go against me and then i will manage the trade according to the Elliott waves alternate views...Each and every trade plan i am sharing here has a alternate view and i am sharing only the most probabilities(70-80%) here...sometimes the other (20-30%) may market do..then i will change the wave counts and labeling according to the price action.
All labeling and wave counts done by me by manually and i will keep change according to the LIVE MARKET PRICE ACTION. So dont bias, hope on my trade plans...try to learn and make your own strategy...Following is not that much easy...I AM NOT RESPONSIBLE FOR ANY LOSSES IF U TOOK THE TRADE ACCORDING TO MY TRADE PLANS....THANKS LOT..CHEERS
Copper prices are facing bullish pressureCopper prices are facing bullish pressure from our first support in line with our 38.2% fibonacci retracement and 100% fibonacci extension where we could see a bounce above this level. Ichimoku cloud is showing signs of bullish pressure as well, in line with our bullish bias.

Copper prices are approaching resistance, potential reversal Copper prices are facing bearish pressure from our first resistance in line with our horizontal swing high resistance, 61.8% fibonacci retracement and 100% fibonacci extension where we could see a reversal below this level. Stochastic is approaching resistance as well, in line with our bearish bias.

COPPER (XCU/USD) – Week 14 – Messy middle.Last week, Copper moved slowly in-between the resistance and the support.
In the coming days, we anticipate that the Copper price will gain some small bullish steam until it will hit the $4.2 level. Afterward, we expect the resistance area to do its job and the bullish correction to continue dropping towards the liquidity pool area.
Trade with care.
Best regards,
Financial Flagship
Disclaimer: The analysis provided is purely informative and it should not be used as financial advice. Remember that you need a plan before you start trading; so, take this knowledge and use it as a guidebook that will ultimately help you understand the market and easily predict your next move.

COPPER (XCU/USD) – Week 13 – Important resistance ahead.Copper traded low all throughout this past week and at the moment looks like it is heading towards our resistance area.
In the coming days, we are expecting the Copper price to increase until it will hit the $4.2 level. Thereafter, we anticipate the resistance area to hold and push the price down towards the liquidity pool, in order to finish the correction that started at the beginning of March.
Trade with care.
Best regards,
Financial Flagship
Disclaimer: The analysis provided is purely informative and it should not be used as financial advice. Remember that you need a plan before you start trading; so, take this knowledge and use it as a guidebook that will ultimately help you understand the market and easily predict your next move.

Copper prices are testing support, potential bounceCopper prices are facing bullish pressure from our first support level, in line with our 61.8% fibonacci retracement and our graphical support area and 61.8% fibonacci extension, where we could see a bounce above this level to our first resistance target. Stochastic is approaching support as well, in line with our bullish bias.

Copper prices are approaching support, potential bounce Copper prices are facing bullish pressure from our first support level, in line with our 61.8% fibonacci retracement and our graphical support area and 61.8% fibonacci extension, where we could see a bounce above this level to our first resistance target. Stochastic is approaching support as well, in line with our bullish bias.

Copper prices are testing support, potential bounceCopper prices are facing bullish pressure from our first support level, in line with our 50% fibonacci retracement and our graphical support area where we could see a bounce above this level to our first resistance target. A break above our upside confirmation level could provide the bullish acceleration to our first resistance target.

Copper prices could see a further upside Copper prices are facing bullish pressure from our first support level, in line with our 23.6% fibonacci retracement, graphical support area where we could see a bounce above this level to our first resistance target. A break above our upside confirmation level could provide the bullish acceleration to our take profit target.
