XDBUSDT trade ideas

$XDB is Super BullishMarket Cap is just $10 million
Holders don't want to sell
Whales Accumulating
First Target - $0.0162
World Cup feature


$XDB long term Bullish$XDB is trading on a critical support level.
A break of $0.0044 will send the coin to $0.0025 Oct. 6th low
There is a high volume now compared to the past. Trend change may occur soon.
Would be great to go long after confirmation of daily close above 20 SMA with the 1st target of the Oct. 11
Fundamental:
Community update on 31st Oct.
-Tokenomics clarification and further token burn (Token annual emission clarification -20years 20 billion max supply)
-Updates about the current status of the mainnet
-Updates on their decentralized exchange and staking to encourage community to hold their coins without dilution.
-Information about the tokenized assets of AS Roman football club
-Out of court settlement of inter Milan issue and new contracts between the two parties (Clarification required); issue resolved or not?
-Onboarding of new institutions to the mainnet; possibly giant institutions maybe announced today
-Introduction of new developers
My opinion is to buy this coin and hold for long time (2024/25) as it does not matter if you buy at $0.0026 or $0.0078 (Not financial advise) as the more usecases evolved soon and other giant institutional clubs/companies start using this platform the price may grow to $1.

XDB Inverse H&SInverse H&S / potential bottom at 0,06 played out well yesterday for #XDB #DigitalBits
We now would like to see an 4h uptrend. If we can continue the uptrend my targets are:
tp1: 0,01226
tp2: 0,01668
tp3: 0,01958

Hey! 22% Profit!!!Hey did you enter the trade seeing my idea?? I said 50-50 chance, which is converted into 100 now😝
We have reached our target of 0.0058!! Now XDB is going to face some resistance between 0.0058 - 0.0065
If it can stay above 0.0065 then we can expect 0.0073 - 77 which will work as the hardest resistance......🤑
Btw trade safe, stop gambling
Here is the analysis post before this trade was made

Time for some risky ScalpEntry is 0.0048
Stop Loss 0.004
Target 1- 0.00535 (25%)
Target 2- 0.0058 (remaining 75%)
This is very risky, a 50-50 chance so trade at your own risk because stop loss price will consider a 14% loss. And Target 2 will give 24% profit.
Important: You can use 0.00555 as TP 2 if you want because that is also a resistance
Don't forget to follow if my idea is helpful for you. Happy Trading

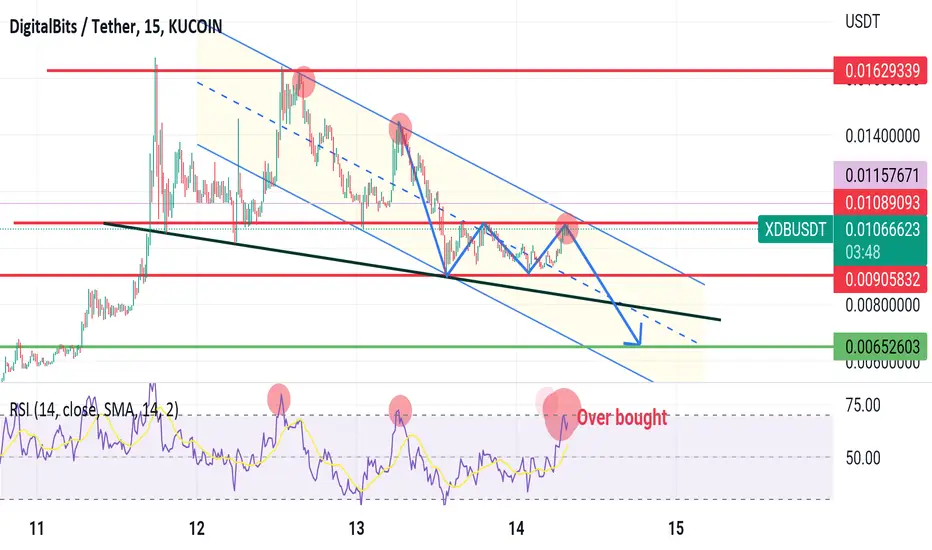
Be aware about the potential risk!As you can see last two times when the rsi reached over bought area, the price action moved down heavily. So it is not a good time to trade long in XDB. It is on the way to the earth from moon. So trade safe
Maybe a upward movementIn my previous analysis, I said about ABC correction. At first I was able to identify possible Correction pattern, and later I updated it. But my first one was correct and second one was wrong. Bad luck😐
Now as you can see the marked support levels are
0.0060 - 0.0064
0.0044-0.0048
0.0034- 0.0038
And next Resistance Levels are
0.0084- 0.0087
0.0124-0.0130
0.016
These suppot and resistance are for long term prospective. The daily RSI and MACD is looking bearish so in long term prospective, we can see it at 0.0044 even at 0.0034.
But if you look at the short term view (4H) you can see it is on a good support level. Personally I am holding my previous buys and I will be buying again for the target of 0.0087 which is almost 30% above the current support. In this trade, I am using 0.0054 as my stop loss. The risk reward ratio is very good here I can get 30% profit against a 10% loss. But Remember this trade has a 60% chance of being successful. You can wait for a clear confirmation to enter this trade.
And yes Don't forget to do your own analysis.

End of wave 5?In some of my previous analysis, the wave 3 was shorter. But basically in elliot impulse moves, the 3rd wave is the biggest wave so if we try to redraw, we can see this elliot impulsive move which is most probably ended now. And now we are in ABC corrective patter.
This analysis is from a totally different prospective in comparisn with my previous one. And you know if two analysis says price will bull then the possibility becomes higher.
Here is my previous one, click and. Check the post. Don't forget to like and follow😁

Ready for a Wave C? Or still in wave B?In my orevious analysis I said we are reaching 0.0087 from 0.0063 soon and target reached before 12 hour. I also told about a mistake Which was mafe by me identifying the wave 3 of elliot impulse.
but now we have identified the correct wave and now we are ready for a ABC correction where the wave A and B is maybe already completed and now we will go for wave C from here. The MACD cross in 4H timeframe gives me the confirmation that we will go for the wave C.
Even if the price goes further down to the 0.0068 level. We should see a wave C from there.

A Risky Trade setup.The risk reward ratio is goodin this trade, but it is risky.
Target is 0.0081 and stop loss is 0.00705
Entry is 0.0073
Always do your own analysis before you enter any trade as it is not a financial advice.
Good Luckk

Waiting for Wave C in 15min timeframeThis chart is a little updated from my previous one. After completing 12345Elliot wave, now we are in ABC corrective wave where we are now confirmed about the wave A and B. Now we are waiting for wave C. Personly I am targeting 0.0097-0.0098 in wave C.
If we look at the RSI, it will be in the over sold territory in next 1/2 hour.Then we will be ready for wave C.
Impotant: Wave B is sightly confirmed, not 100% yet. But where ever the wave B is, we must go for a wave C.
But in worst case scenario, sometimes wave C does not come true so there always a little bit risk but I am 75% sure about the wave C.
Always Do your own analysis before you enter any trade, this is not a financial advice. Just a prediction based on Elliot corrective wave, trend line support and RSI divergence.

A penny again?Here is some correction in ABC wave from my previous analysis. We are going to break above the trend line if volume keeps increasing and can easily reach 0.01

Up or Down?RSI looks bearish, Retesting trendline resistance for the 4th time and some significant volume increase in last 2 hour. I really can't tell what is going to happened from here, maybe a break above

ABC Corrective wave?In my previous analysis, I told that we are going to 0.0065. And yes it reached 0.0067 then pumped.
Now you can see the price movement has comoleted a 12345 ellito impulse and now it is the time for ABC correction.
RSI is also at over sold terratory which signals possible bullish scenario.
I think we will reach 0.0081 first, then some pullback and then up to 0.0095.
Always do your own anysis before you enter any trade, this is not a financial advice. Just a prediction. Happy trading

XDB back to 0.012 again?Well XDB has created a descending channel and following it, we may see it around 0.012 🤔
It has been a hot coin since last two days. Comment what do you think

$XDB (Digitalbits) back to 0.02 short term?XDB announced that they are not able to do payments for Italian soccer league (about 85 Million USD sponsoring contacts). Once they solve this situation (???), do you think we can bounce back to 0.02 USD or even more?


XDB Long at $0.25Price action for XDB from March 14, 2022 to the present has been pretty remarkable. From a Wyckoffian perspective, we observe a hyperdermic distribution after the buying climax (BC) on March 23. The red arrows point to volume spikes. In these 3 instances they illustrate heavy selling. It’s possible that we have observed a local selling climax (SC) on April 7. If it was a SC, it’s likely the price will enter a trading range. The first level of significant resistance is around $0.34; this corresponds to the price level at which the last significant amount of selling started.
I have opened a long position at $0.25 and expect the price to pause around $0.34.
Wyckoff abbreviations: preliminary supply (PSY), buying climax (BC), automatic reaction (AR), sign of weakness (SOW), last point of supply (LPSY), selling climax (SC).
This is not financial advice. I am not your financial advisor. This is my opinion.

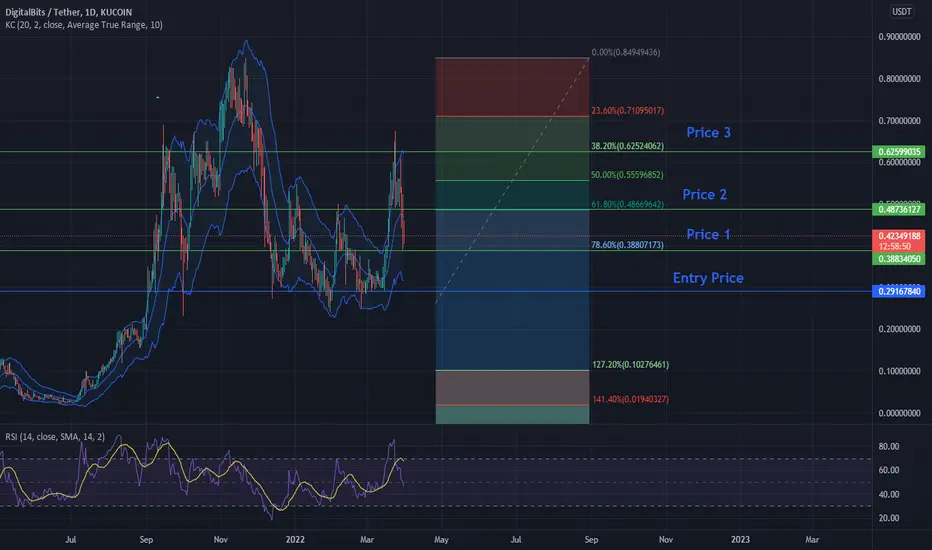
Swing Trade - Use the volatility to your advantageThe cryptomarket is historically volatile and by using this volatility to our advantage in trading are we able to make big gains.
Entry Price: 0.291
Price 1: 0.388
Price 2: 0.487
Price 3: 0.625
The price is expected to drop further and reach the price level of 0.256, at this level is the price expected to bounce following the low of the KC.
This prediction is made through studying the price movement in the past which has given us higher high which combined with the RSI having speed downwards and the volatility given in the chart would this price bounce be likely to happen.
No Financial advice. Education purpose.
Quick XDB Scalp?Here is my idea on a quick XDB scalp, let me know what you guys think. I fully support the DigitalBits project and own a nice bag myself.
