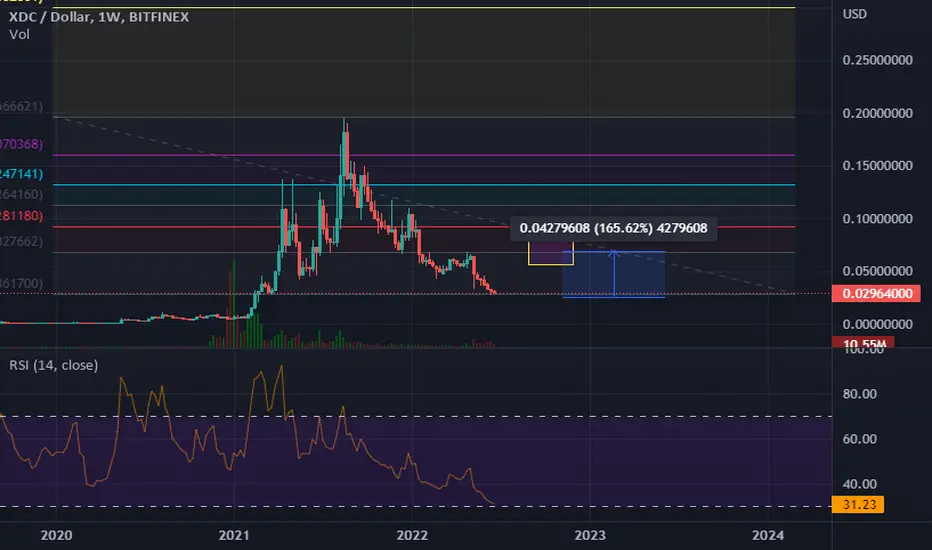
XDC risk of $0.013 before recoveryXDC may still see a price reach between $0.05 to $0.06 by mid 2023
XDCUSD trade ideas

XDC Networks - Smart Money ConceptsNot looking to how for the markets as a whole but some coins look worse than others. another 97% downside in store for this poor guy, better get out while you can or get ready to DCA onthe ride down.
#xdc #xdcnetworks #xrp #ripple #cryptocurrency #crypto #bitcoin #ethereum

XDC XINFIN Descending Broadening Wedge Bullish Reversal IncomingXDC has been in this long correction consolidation as have most of the other cryptos in this bear market. It seems like XDC has found a bottom or is finding a bottom. This descending broadening wedge pattern that formed after a major bullish run is a great pattern and will result in a nice upside move to start XDC's next run up to possibly $3 on this next run. The descending broadening wedge breakout will result in a measured move of at least $.27 cents. XDC has been gaining alot of popularity lately in the crypto community and I think XDC is going to jump up into the top 10 or 20 very soon. Its fundamentals are amazing as well. Dont sleep on this one guys this is probably the easiest 100x there is in my mind. I show in the chart that XDC top will be around December 2023, I dont know if that is exactly when it will happen, it could be faster or it could be into 2024. Regardless XDC is about to melt faces and Ive been saying that for a long time. I will leave statistics below about how this descending broadening wedge will/should play out, its a direct copy and paste from CENTRALCHARTS.
A descending broadening wedge is bullish chart pattern (said to be a reversal pattern). It is formed by two diverging bullish lines.
A descending broadening wedge is confirmed/valid if it has good oscillation between the two upward lines . The upper line is the resistance line; the lower line is the support line.
Each of these lines must have been touched at least twice to validate the pattern.
NB: a line is said to be "valid" if the price line touches the support or resistance at least 3 times.
This implies that the descending broadening wedge pattern is considered valid if the price touches the support line at least 3 times and the resistance line twice (or the support line at least twice and the resistance line 3 times).
A descending broadening wedge does not mark the exhaustion of the selling current, but the buyers’ ambition to take control. The divergence of the two lines in the same direction (increase in price magnitude) informs us that the price continues to fall with movements that are increasingly low in magnitude. The sellers manage to make the price rebound on the resistance line but lose control after the formation of a new lowest point. The highest point reached during the first correction on the descending broadening wedge’s resistance line forms the resistance. A second wave of decline then occurs of more magnitude, signalling the sellers' loss of control after a new lowest point. A third wave forms afterwards but the sellers lose control again after the formation of new lowest points.
During the formation of a descending broadening wedge, volumes do not behave in any particular way but they increase strongly when the support line breaks.
FORMATION OF A DESCENDING BROADENING WEDGE AFTER A PEAK
This type of pattern appears during the correction in a bullish movement, it is a bullish continuation pattern. Resumption of the bullish movement after correction.
The break in the resistance line definitively validates the pattern.
The price objective is given by plotting the wedge’s maximum height onto the breaking point
NB: pullbacks are harmful to the pattern’s performance.
Statistics of the descending broadening wedge after a bullish movement
- In 79% of cases, the exit is bullish.
- In 23% of cases, a descending broadening wedge occurs in a consolidation movement.
- In 81% of cases, the pattern's price objective is achieved when the resistance line is broken.
- In 40% of cases, the price makes a pullback in support on the descending broadening wedge’s resistance line.

XDC XDC fractal for in a potential bullish run up if Bitcoin retraces or XDC price action moves off of fundamental utility/big buyer moving price

XDC heading towards $0.05?XDC heading is still on course to test the $0.06 price level by mid 2023, the best case for XDC breaking above $0.05 during 2022 would be this double bottom pattern playing.
Also note that MACD is show a possible trend reversal, market XDC may be turning bullish

XDC IS ABOUT TO POP! XLM, XDC, XRP FOLLING SAME PATHXDC as well as XRP, and XLM are ready to take off. The entire alt-coin market is preparing for a huge move as well as Bitcoin. The whole crypto market is about to blow everyone's mind. The bearish sentiment out there is overwhelming, we've reached max fear. Everyone and their dog thinks this is a suckers rally and we're heading lower and why I believe this is the perfect setup to create the greatest FOMO of history. So many people who have been screaming SHORT, BTC $5k, BEAR MARKET RALLY, RECESSION BLAH BLAH BLAH will be left behind in this run, purposely may I add. Also BLACKROCK the largest asset manager in the world, with $10 Trillion under management , has started a private fund and partnered with Coinbase to allow an onramp for their institutional investors. Institutional investors don't spend 1 or 2 million investing, they dump hundreds of million and billions into markets. Anyways hold onto your hats we're about to take off.


Next step upI see XDC to push up and touch the 0.03220 price mark in the next push up, and then retracing back to the 0.02970.

XDC XDC Network idea 5 July 2022XDC XDC Network idea 5 July 2022 - we will likely still drop below $0.02 before exiting the bear market

XDC BACK TO $0.01 (£0.0082)- XDC is a ISO20022 compliant crypto, it will do very well long term, however due to bitcoin being the leader I believe XDC will also fall and also a recession is coming aswell.
- If XDC goes to £0.0082 £1,000 gets you around 121,951 XDC coins.
- 1st Target 4.618 $0.81 (£0.67) 81 X RETURN
- 2nd Target 34 FIB LEVEL $5.65 (£4.66) 568 X RETURN
- 1,000 X 81 = £81,000
- 1,000 X 568 = £568,000
- NOT FINANCIAL ADVICE!

XDC XDC Network idea 28 June 2022XDC XDC Network idea 28 June 2022 - we may see a small dump to the $0.014 price range before moving up towards the $0.07 price range
If we do not hit the $0.07 during 2022 then we would likely only see that price during mid 2023 as we approach the LTC halving event

XDC Network 26 June 2022XDC Network 26 June 2022 - could possibly dip lower but understand XDC may change lives in the months to come

XDC XDC Network idea 23 June 2022XDC XDC Network idea 23 June 2022 this is my mid term price prediction for XDC
XDC USD : BULLISH DIVERGENCE, DESCENDING CHANNEL = BREAKOUT!XDC XINFIN USD Is at the bottom of the descending channel, this I believe is the bottom for XDC. This is a major accumulation zone, and where I am accumulating. There is major bullish divergence on the MACD which indicated to me that a big move is incoming. I believe because we have had 5 or 6 touches in the channel that this channel is pretty much done and the breakout is coming now after this low of 3.5 cents. We may have one more wick down to 3 cents but I believe this correction is over and the breakout is coming, and the breakout is to the upside which I am verifying with the bullish Divergence on the MACD. Without this bullish divergence then it would be 50/50 to breakout out eh downside or the upside, but because of the bullish divergence on the MACD i am almost certain that this will bust out to the upside. This is a great area to accumulate in my opinion. This is not financial or trading advice this is just my opinion. if you find this content useful then please leave a like, comment, and follow me for more analysis and updates. Thank you

XDC XINFIN USD Falling Wedge & Bullish Divergence = Breakout!XDC looks like the bottom is in, maybe a few wicks down but overall the bottom is in and now its time for a breakout. The falling wedge is at its apex and there is nice Bullish divergence on the MACD with XDC setting lower lows while the MACD is setting higher lows. Something is coming and I believe its throughout the entire crypto space. I think the entire market is about to see a massive wave up thats going to leave 90% of people in the dust because they are bearish, but lets be honest this happens every single time. The market moves in the opposite direction as the crowd otherwise no one would get rich off the market and everyone would know when to buy and when to sell. This is not financial trading advice, this is just my opinion. Follow me for more updates and if you have any questions or opinions you would like to share then please leave them below. Thank you and good luck!

XDCJust another incredible buying opportunity for another one of my favorite projects, Xinfin Network. I am extremely bullish on XDC longterm please DYOR.

$XDC First Target hit$XDC First Target hit - lets see, if we can hit the 2nd Target 0.0675$ after a small consolidation phase

$XDC Breakout on the 4h Chart$XDC with a strong #HeikinAshiRangeBreakout on the 4h chart. Next targets for #XDCNetwork can be 0.0647$ & 0.0675 #TradingView #cryptocurrecy #fintwit #cryptotrading #altcoin

XDC Xinfin - FIFTH WAVE INCOMING TARGET 4 DOLLARS These fractals are playing out in the entire market. There is a massive 5 wave coming and I even believe that it will be much more powerful than the 3rd waves similar to commodity markets. The indicator I am using is the Williams Fractal Indicator. This indicator has call the macro bottoms in XDC multiple times and the tops as well. It looks like May will start the rally. This is not trading advice just my opinion.

XDC poised for big movesThe trend is being quickly exhausted on the 4h and 8h time frame. It's bottomed on the daily. When trends bottom on the daily this indicates big moves. The trend hasn't bottomed on the 4h and 8h just yet so there might be a little pullback before we see a bullish trend on a more macro-scale.

XDC poised for big movesThe trend is being quickly exhausted on the 4h and 8h time frame. It's bottomed on the daily. When trends bottom on the daily this indicates big moves. The trend hasn't bottomed on the 4h and 8h just yet so there might be a little pullback before we see a bullish trend on a more macro-scale.
Fixed
Trend exhaustion bottomed on the Daily and 4h. The trend is being exhausted on the 8h.

XDC is going to melt faces.Enormous potential upside. this .30 is on the low end of the move. the last time i charted this it ran up 1000% more than expected, i wouldnt be surprised to see this breaking $2,00 when the market brings it closer to equilibrium.

XDC LOOKS HOT FOR LONG TERM !XDC looks hot for long term. XDC serving like XRP and XLM. I think enoughly good project. XDC and 200EMA relationship is obviously clear.
