The opportunity of storage XEC The opportunity of storage XEC
The entry point is 0.00024-0.00029$
First target 0.00026$
second target 0.00031$
third target 0.00034$
Forth target 0.00039$
XECUSDT trade ideas

$ZECEverything you need to know is indicated above in the chart you can choose to play by it at your own risk
Note:Apply proper risk management
$Laja currency$

Hope you guys listened XEC shit coin wants 100
Was correct on my 189 target but still showing no life support
Should tank harder
Take care and God speed

eCash (XEC) - September 21Hello?
Welcome, traders.
By "following", you can always get new information quickly.
Please also click "Like".
Have a nice day.
-------------------------------------
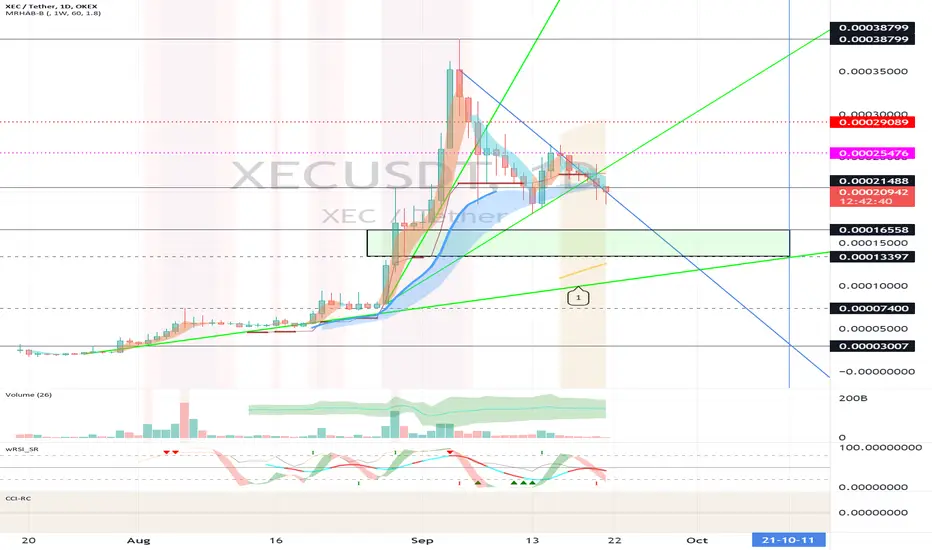
(XECUSDT 1D Chart)
If the price declines from the 0.00021488 point, it is likely to turn into a short-term downtrend, so trade cautiously.
In order to turn into an uptrend, the price should be maintained at 0.00021488-0.00035476.
The uptrend line (1) is an important uptrend line on the current chart.
Also, I think that the 0.00013397-0.00016558 section is divided into a mid- to long-term uptrend and a downtrend.
Therefore, even if it declines from the 0.00021488 point, it is expected that the uptrend will continue if it finds support in the 0.00013397-0.00016558 range and rises.
------------------------------------------
We recommend that you trade with your average unit price.
This is because, if the price is below your average unit price, whether it is in an uptrend or in a downtrend, there is a high possibility that you will not be able to get a big profit due to the psychological burden.
The center of all trading starts with the average unit price at which you start trading.
If you ignore this, you may be trading in the wrong direction.
Therefore, it is important to find a way to lower the average unit price and adjust the proportion of the investment, ultimately allowing the funds corresponding to the profits to regenerate themselves.
------------------------------------------------------------ -----------------------------------------------------
** All indicators are lagging indicators.
Therefore, it is important to be aware that the indicator moves accordingly with the movement of price and volume.
However, for the sake of convenience, we are talking in reverse for the interpretation of the indicator.
** The MRHAB-O and MRHAB-B indicators used in the chart are indicators of our channel that have not yet been released.
(Because it is not public, you can use this chart without any restrictions by sharing this chart and copying and pasting the indicators.)
** The wRSI_SR indicator is an indicator created by adding settings and options to the existing Stochastic RSI indicator.
Therefore, the interpretation is the same as the traditional Stochastic RSI indicator. (K, D line -> R, S line)
** The OBV indicator was re-created by applying a formula to the DepthHouse Trading indicator, an indicator disclosed by oh92. (Thanks for this.)
** Support or resistance is based on the closing price of the 1D chart.
** All descriptions are for reference only and do not guarantee a profit or loss in investment.
(Short-term Stop Loss can be said to be a point where profit and loss can be preserved or additional entry can be made through split trading. It is a short-term investment perspective.)
Pump and dumped People don't understand Mathematics
and really thought this coin would go to a dollar without looking at the total supply and what the mcap would be
This chart is the definition of ugly even thou there isn't enough data on it, still looks horrendous and disgusting
Short it for financial freedom
Thanks

Showing weakness Next target at 186$ or 0.000186
Such shit coin even failed to rally through an inverse
Short it with speed
Take care
Inverse spottedInverse head and shoulders spotted on this shit coin
Long this and make a quick scalp profit
Looks like we are going to get a scam pump here and I'm longing this
Not financial advice be extremely careful this could dump like bitconnect
Take care

Double top, need to wait for retestBase on current tech analysis, need to wait if double top pattern works for a short or retest and disables the pattern for a range or run.

Showing weakness and wants 0.0000000001Looks weak and struggling by the big Dawgs
Not financial advise but I'd short the hell out of this
This coin scamming people like this is an indication of euphoria
Target 0

Let it goSo many traps and manipulation and noobs falling for this hype piece of shit coin
Please be careful and take care
I've been warning you all about this hype
This thing to a dollar? come on people use your brains.
That would only be possible if this was being used on a global scale, literally everyone would have to be using this on a daily basis and you think this project shit coin will be the one?
Get real
Target 0
[Update] propability of breakout on bullish momentum 240Hello traders, XEC / USDT is in a bullish movement with higher and higher highs.
Strong potential that the price increases with first objective on the next resistance zone.
It is plausible that it will breakout to seek the next resistance if validation occurs and correction is expected on its uptrend line.
This is not investment advice but a recommendation for use.
Thank you for taking the time to read my analysis.
I hope you enjoyed it.
Comment your ideas in the space dedicated in description.
Good luck with your trades, stay in your investor memory.
If you like my posts, mash the like button👍
Please FOLLOW me, thank you!

XEC Tether TrapShort it
Bull Trap here by the Tether Dawgs
Trying to Trap in as much noobs here
Take csre
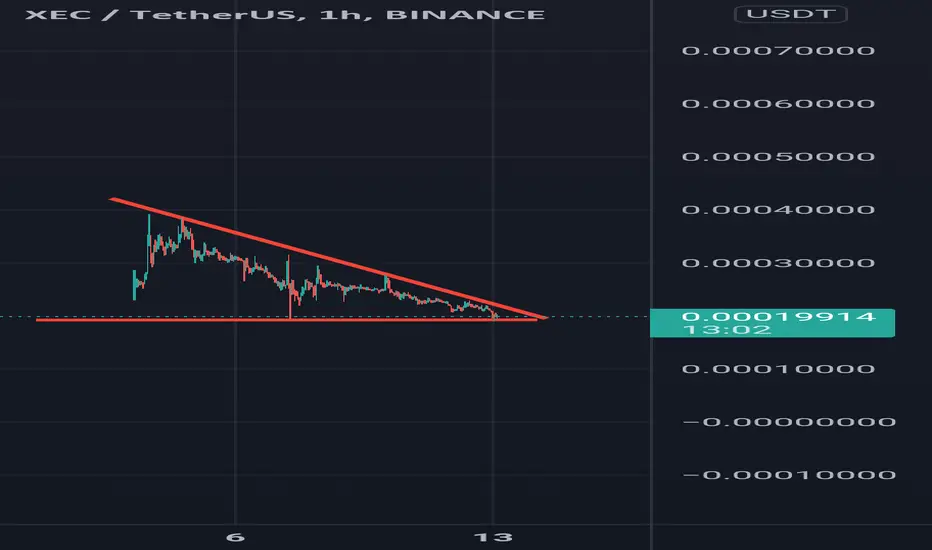
XEC usdt update triangle complete and Fibonacci level 0.786 is support this is good support i think this is near bark out

DisgustingThe big Dawgs have dumped on the noobs..
Take care.
Decending triangle and a massive one at play here.
Careful.

Xec Usdt (E-Cash)support, resistance and possible targets are indicated on the chart. Not investment advice

Floor Price Conviction of eCash XECHi traders and investors. It seems that a floor price is being accepted by the market.
I guess XEC's true market price at its present stage of development. Do agree?

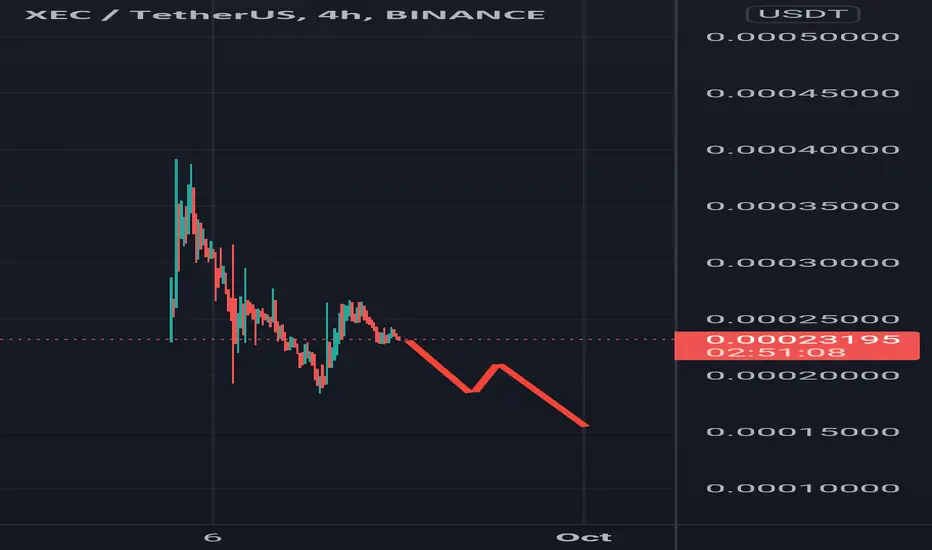
XEC Easy ShortTether may orchestrate a pump again but with the way the world is going right now, a lot of people are going to run for cash and not shit coins like xec with the supply limit. Normies tend to look at how low the price is and not how high the market cap is for such shit coin. Take care and God speed.
.
.
.


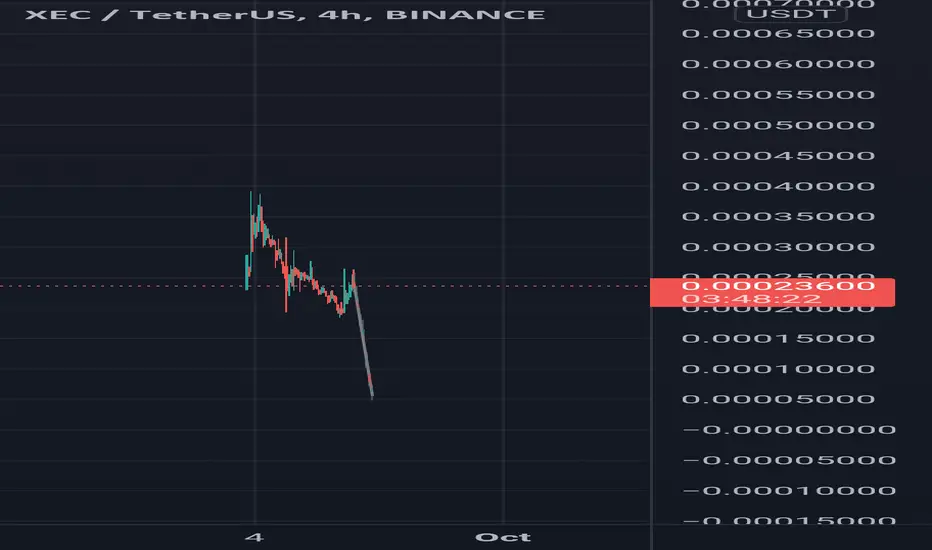
@adoringBird81859 this my prediction on XECUSDT you asked for.Remember this is not financial advice. Use your own head and think before every trade.


XEC LONGXEC is ready for another fly after break of the trigger it can grow again
good luck
give me your idea

