XEM Is Back !
21 ema about to cross 34 ema on 1d chart. Bottomed out, no longer in downtrend.
55 and 133 ema is crossing on 4h chart.
XEMBTC trade ideas

XEM 600% potential trade in longterm, bulls in charge!!Hello Traders.
Looking at XEM 1W chart we can clearly see a breakup downtrend line.
Indicators are bullish, I predict MACD bullish cross next week, RSI its going up from oversold zone.
As always Tips in BTC are very welcome.

xem btc new weekly cycle begansee the chart look at the indicators what happened before and the price
you see? something is just started this week
dyor


XEM NEW CYCLE IS READY ...BUYNákup: XEM/BTC
Buy zona : 3600-3800sats
Target 1 ) 4000 sats
2) 4200 sats
3) 4500 sats
If continue bullish
4) 5000sats
5) 5500 sats

XEMBTC UPDATEXEM has broken through a 4hr resistance but did not continue up to test the next resistance. It is now heading down to retest the previously broken resistance(now support). If it holds here and bounces I believe there is some good potential for gains to the targets I have set out here. 53% + to the peak of the previous bull run in and i believe there will be some good opportunities to swing trade this on the way back up.
Watching closely!

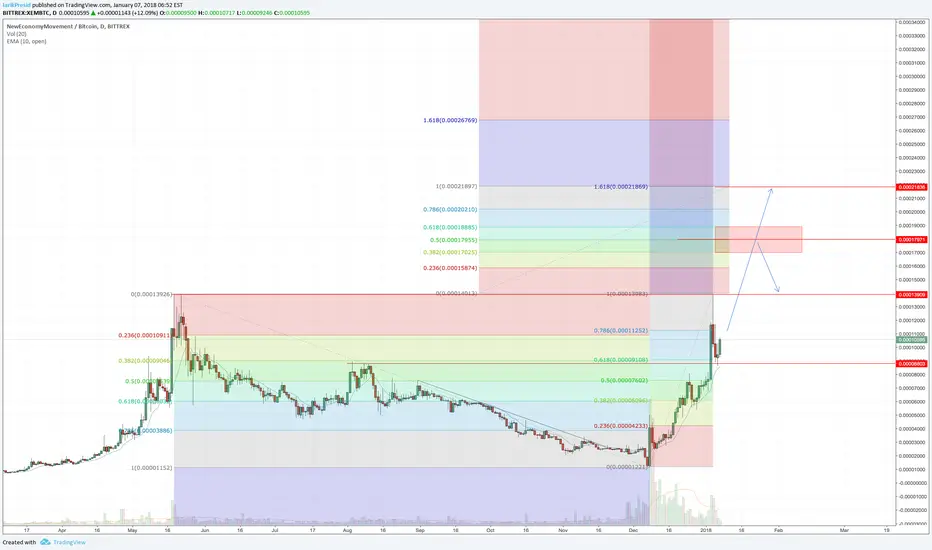
NewEconomyMovement (XEM) Getting Ready (380% Profits Potential)NewEconomyMovement (NEM / XEM). This is the coin that we will be visiting today.
I will be sharing with you the trade instructions, charts, indicators and signals, as well as some text about the different reasons why we trade altcoins.
This is a very strong project, with a great team and lots of action always going on. Looking at the charts reminds of the last time I traded it, easy money, always, this time around we can earn even more.
So let's start this trade by looking at the 2017 daily chart. This chart goes back to the beginning of March 2017, you can see XEM's last two bull run:
- Here you can see XEM long term.
- The red square represents the price range at which XEM usually takes off before a bull run. It happened twice already, the third time the top was low, compared to the first two, but the fourth time is yet to come. This is the next wave that we want to ride all the way up.
- Magenta price is the top. Both runs reached the same all time high.
- The black dotted lines represent the bottoms.
- These are just some basics, we will be taking a closer look later on...
Let's look at the same chart above but with weekly candles... It gives a clearer view, and it is also good for your learning and entertainment:
NewEconomyMovement (XEM) Trade Analysis by Alan Masters
TRADE INSTRUCTIONS
Buy-in: 0.0000330 0.0000410
Targets:
SHORT - MID
(1) 0.0000460
(2) 0.0000508
LONG
(1) 0.0000547
(2) 0.0000708
(3) 0.0000969
(4) 0.0001155
(5) 0.0001392 (All time high)
(6) 0.0002075 (New all time high)
(7) 0.0003181
Trade strategy: Aim for profits. Buy within buy-in range and wait for your targets to sell. If the price of Bitcoin crashes once more before XEM takes off, do not worry about it, wait longer until the next altcoins market bull run starts and sell for profits. So just buy & hold to later sell on target.
CHARTS, SIGNALS & INDICATORS
- On the daily chart, I can see very strong bullish signals coming from the MACD indicator.
- The overall structure of the chart is a bit of sideways, with tendencies of going bullish.
- Many of the same signals & indications that are available in our other analysis can be spotted in the XEM charts.
- Please allow time for this trade to develop.

XEMBTC 5TH WAVE5th elliott wave comming, aiming at fib retracement 1.168 and 0.382 from wave 1 and recent ath
-TP @ 0.00004035 btc

XEMBTC 370% + 2000%+XEMBTC 370% + 2000%+
Hello again!
Good news again!
You can ask me why I love the Crypto market?
For the fact that even in the most bearish weather you can find good suggestions.
And now such a proposal is NEM.
If buyers start their offensive from now on, we can get 370% +
If the bears continue the pressure, then a new opportunity opens before us, and then we can calculate up to 2000% of the profit and possibly more.
I want to make only one warning !!!
The graphs I presented are weekly and may take up to 2-3 months to reach our goal.
For those subscribers who are not ready for such a long journey, I will make new schedules for shorter timeframes. And I hope that this coin will bring us a lot of joy!
Good luck and good trading!

XEMBTC Bittrex. Continue up trend. The growth potential of this asset has not been exhausted, therefore, we will receive further profit.
Next level for sell - fib 1.618 (price 0.000218)
XEMBTC (NEM Long Term)XEMBTC: NEM:BTC or XEM (#NewEconomyMovement / Bitcoin (BITTREX:XEMBTC) ) BITTREX:XEMBTC
Buy:92-96-
Sell: 102-112-130 (0.000130)
(stoploss: 86)
Short term BULLISH.....>>>


XEMBTCAnother coin I've made good gains on recently is XEM.
It has broken out of the downtrend, found support and started making it's way back up.
About to close above a 4hr resistance and possibly continue back up to retest the next resistance.
53% gain from where it is now to the previous peak.

$XEM $XEM.X - New Economy Breaking out?Taking a look at XEM on the daily chart and we may be seeing a classic bollinger breakout opportunity though may be a little early to tell but there are some good signals coming off the chart and on smaller time frames:
Bullish Signals:
The bollinger bands have squeezed and are starting to part which means volatility is coming back and we have a bullish candle starting.
10 period moving average has crossed over the 20 period
RSI is over 50 and trending up
Stoch line is trending up
This pattern repeats on smaller time framed.
Bearish Signals:
Stoch blue line is parting from the red, could show the trend starting to reverse.
We are at the top of the current bollinger band showing resisitance
We are seeing resistance at the 50 period moving average on the daily.
Overall i believe we will continue on a bullish trend here and may have a band riding scenario. May see a short retracement since where at the top band, bounce off the 10 period (red) moving average an continue forward. IF this is a classic bollinger bullish breakout and volume spikes up, possible gains.
I think im going to take a position here look to buy in.

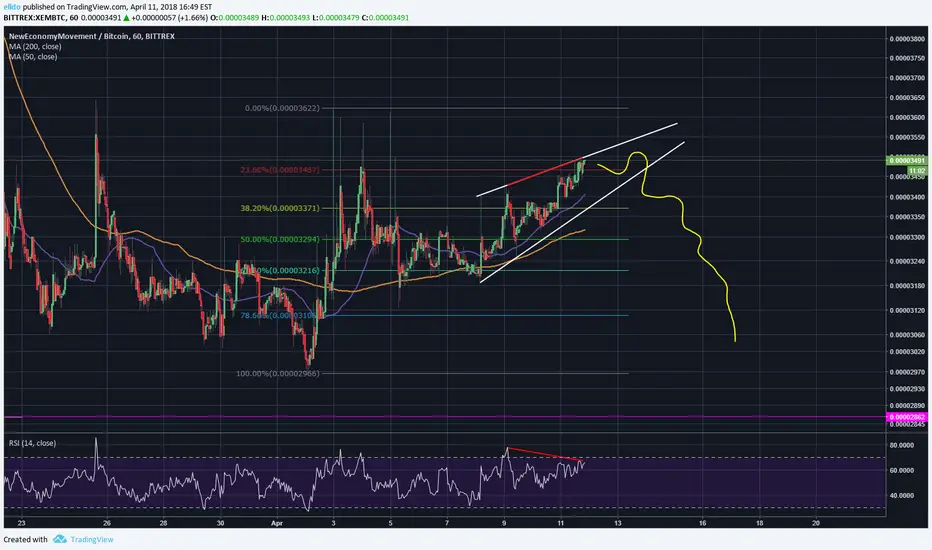
XEM - another possible moveWe are getting a nice bearish signals. There is a consolidation in rising wedge formation in 1H chart with a clear bearish divergence marked red line.
So I am expecting something like this, but everything depends on the next BTC 0.84% movements.
I am bullish now, but if we break the downtrend line of this wedge then I go short.
Good luck!
XEM supports, resistance, trend lines, and fib4hr chart on new economy movement. Buy and sells zone. good luck. RSI is hitting the oversold territory, and macd is running bull with some room to run!
NEM(XEM) will be tradable on Coinspark In April
"Join the first world-class quality blockchain and cryptocurrency conference on May 4-5, 2018 in Amsterdam, Netherlands"
"Catapult NEM (version 2.0 of NEM) will come sometime in May 2018"
Good buy and sell zone are in between the yellow line and fib lines that are closest together.

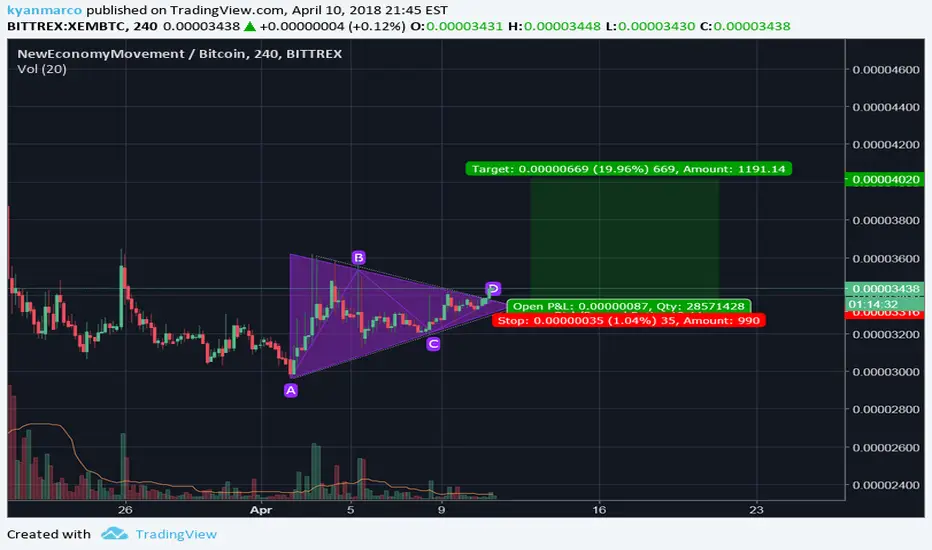
XEMBTC - Trade SetupRighto you are looking at XEMBTC, 4HR Chart Binance.
This is another beautiful trading opportunity.
The price forms a triangle pattern that will be breaking above.
Please ensure to put stop-loss below the last wick.
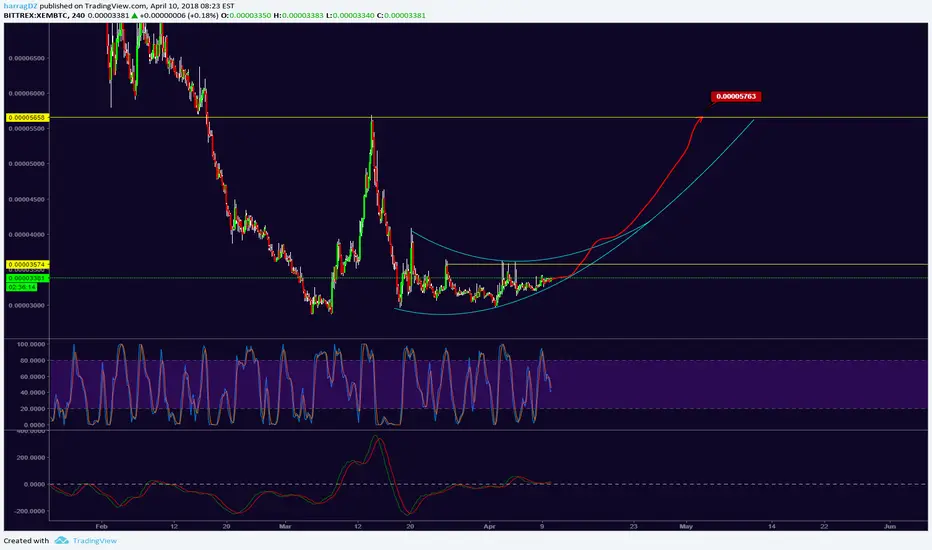

XEM seems to have reached the bottomXEMBTC decreased very hard also after the previous hack scandal. It seems to have reached the bottom although a bull run on BTC can bring it to a temporary new low. However it is curently overing between MA20 and MA50 and if it holds we can see it move to MA250 in the next days.
Enjoy!

NEM - Bullish divergence and market cycleXEM/BTC is currently trading on a very strong support which shows a very good opportunity to go long. This shows that NEM has almost completed its market cycle. There's also a bullish divergence on RSI, another good signal to go long. If this support doesn't hold, next one is at ~2200.
Now regarding fundamentals, NEM has a scheduled release to their version 2.0 of Catapult NEM on May 31st or earlier.

NEM XEM DOUBLE BULLISH DIVERGENCE ON MACD INDICATORIN 1D CHART NOW NEM IS GENERATING OF THE DATES FEB 21 AND MAR 13 AND THE ACTUAL PRICE
BUY AND LETS SEE THE BENEFITS!

