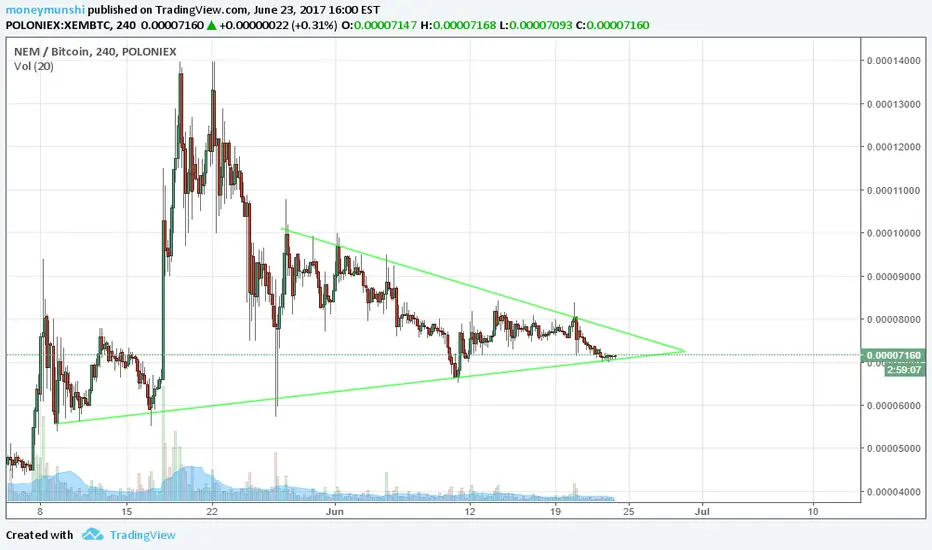
XEM Worth a review XEM
Establishing new area for support (highlighted)
Broke out from a previous strong trend line (highlighted)
Volumes are building up
possible scenarios
1. comes back down to test same support
2. continue it's way up to test the round numbers (more likely)
trade to your taste
Good luck everyone
XEMBTC trade ideas

Xem go upNEM Foundation Opens First Blockchain Center in Malaysia
BY JULIAN · PUBLISHED JULY 3, 2017 · UPDATED JULY 1, 2017
From Avi Mizrahi
The NEM cryptocurrency (XEM) is the sixth most valuable blockchain token in the world with a $1.5 billion market cap.
The NEM Foundation, creators of the NEM blockchain platform whose native cryptocurrency (XEM) is the sixth most valuable blockchain token in the world with a $1.5 billion market cap, today announced a strategic alliance with Australia’s Blockchain Global to expand NEM’s global reach.
The London Summit 2017 is coming, get involved!
The partnership’s first initiative will be to open a Blockchain Center in Kuala Lumpur, Malaysia, to serve as an incubator, accelerator, and co-working space. Scheduled to open in August 2017, the 10,000-square-foot Blockchain Center will house the NEM Blockchain Innovation Lab, a headquarters for research and development as well as regional support for organizations interested in using the NEM platform within their IT infrastructures.
Later this year, NEM plans to work with Blockchain Global to develop a cryptocurrency exchange for the NEM ecosystem. Blockchain Global previously built ACX.io, Australia’s largest Bitcoin exchange by volume.
Lon Wong
“We’re excited to partner with Blockchain Global in this rapidly evolving blockchain ecosystem,” said Lon Wong, president of the NEM Foundation. “This strategic alliance will fuel expanded reach, deeper collaboration, and multiplication of value as we journey towards developing blockchain hubs around the world.”
“We’re proud to work with the NEM.io Foundation, as we believe their blockchain technology platform is the future standard for mainstream enterprise and organizational infrastructures,” said Sam Lee, CEO of Blockchain Global. “The opening of a nonprofit blockchain center in Malaysia allows both Blockchain Global and NEM to pursue our missions to foster mainstream innovation and adoption internationally.”
The NEM Foundation is expected to spend around $40 million in the next year to fund its global expansion programs. $5 million will be allocated towards supporting blockchain companies incubated in the Blockchain Center.

Where to seek longs on XEMBTC?I'll try to catch some longs @4800, and @3600-3700sat. From 4800sat area bounce should be to 6000sat, and from 3600 easily to 4800-5000area. That scenario is only possible if we break 6000sat support level. On XEMUSD chart (historical data for daily candles imported to metatrader 4) i dont see any signs of positive reversal so price should go down to 0.05-0.1 area.

$XEM accumulation and profit.Saw an amazing gain on 20% sell. Looking at news and roadmap I'm looking to re-enter for 6-18 month long.

XEM Ichimoku Cloud BreakoutLooks like XEM is breaking out above the cloud in the 1 hour charts. Volume and RSI are also trending up. This is a buy signal. Next resistance to watch looks to be at 7210 where the cloud was last green.
-X

When do we moon?XEMBTC -0.57% is getting ready to shoot out of the atmosphere. There is so much good news coming up. However, like all diamonds in the rough there is relatively little coverage. No coverage means the general public isn't informed. If they aren't informed, they don't know to buy. Did you know that Coindesk doesn't cover XEMBTC? At the time of this post, there isn't a single post on XEMBTC or it's private blockchain counterpart Mijin. How I think it is going to unfold:
1) Ring ring ring - News of Catapult is released to the public and we start tangoing to resistance.
2) Drinks and party - After our market cap jumps up nicely, we decide to party a little and maybe put that down payment on the yacht. Drinks are on me baby. Since we are now inebriated at this point, it may take a bit to get to the rocketship.
3) Zoom zoom to the moon - At this point we are getting ready to hit an all time high. The good folks at NASA have informed us that the rocket ship is fueled and ready to go. They've have given us two thumbs up for lift off. Now I didn't do the math and don't know how long it will take to get to the moon, but once it's there I'll be checking to see if the moon really is made out of cheese.

Xem on Sale!Ya Xem fell a bit, still has two major supports behind it.
Crypto's on the rise baby, they've held well considering no real news lately.
Def consider some in your holdings for some reduction in variance, and some long term strong growth.
Green is a long term support,
Red is a secondary conservative support line.
Even if it dips below green for a bit, I still wouldn't be worried.
i like the MacD and Rsi, also the combo of them two is like the one two~! I'm thinking reversal in trend soon :D

Nem/Xem IdeaXem double bottomed at 6k. Any buy below 7k is awesome. Tp around 21k. July 9th will be important.


Is XEM going to hell or only to limbo?I think we may see flash crash here. And then slowly accumulation period. XEMBTC must in this case brake down 5400-5700 sat area for scenario of "limbo" 3000sat+ area should be good for accumulating longs on this pair ( In the same time USD capitalisation of NEM should go down to 500-900 milions area). After this limbo (or for FOMO buyers from 10000sat+ area "hell"), XEM should try to go much higher than ATH @14000sat (around 2,5billions USD capitalisation at that time). If area 5400sat+ holds, then we can see some bounce up to 10000-12000 sat area, time will tel which scenario will be in play:)

XEM - a few day bearish trend will continue for some time!!
if Break support 62 will down 4x
The effects of bitcoin, altcoin are reduced


XEM About to go UPI think Xem has reached Bottom of the Penant and is about go High
TP 1 : 75000
Best of Luck
NEMPlease like my blog post on steemit (link below) - I'm trying to build a steemit.com community and it pays me a little bit per like --- thank you soo much!
goo.gl


Bullish Symmetrical triangle on XEM (NEM)Bullish Pattern for New Economy Movement.
Symmetrical triangle, reaching for new ATH's.
Short term trade:
- Entry: 7629 Satoshi's
- Stop: 6872
- Target: 9967 (Might bounce off 10k / 0.382 Fib)

The mighty XEM will reboundXem is a very strong coin. With a lot of holders. Xem has been silent for a while. I expect strong bullish sentiment soon.
