XEMBTC trade ideas


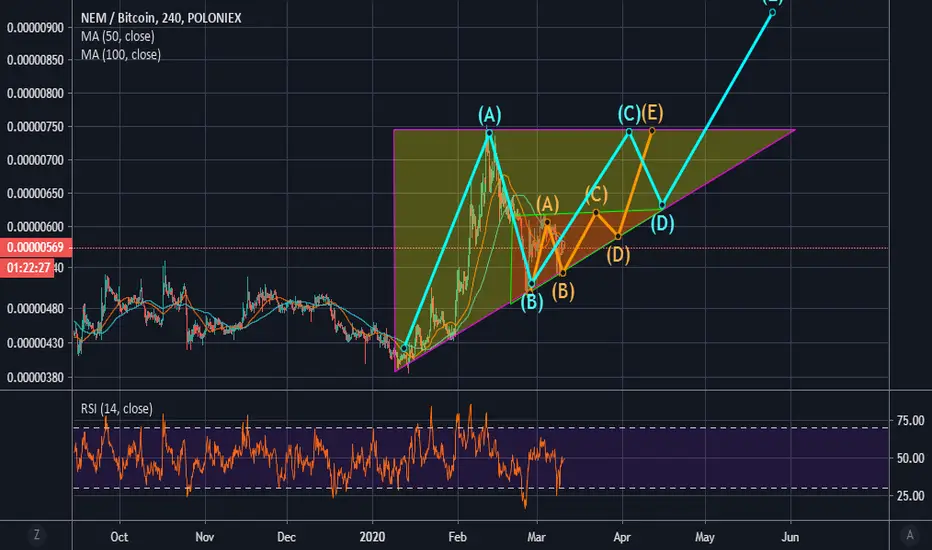
NEM / BTC - AccumulationFairly obvious accumulation zone.
Should be easy to buy the breakout. Take profit areas have been highlighted.

XEM. It is a slow starter but fast rider. We can say that XEM will soon go to level 0.00000984. Depending on the strength of buyers, future price behavior can be said by the nature of the breakdown Senkou Span B. For the first time in 2 years Tenkan-sen and Chikou span crossed on weekly timeframe.
In addition, excellent data on MACDs and averages.


XEMBTC -> absolutelly bullishADX and DI crossing and MACD crossing are imminent RSI is in a bullish area and broke all the resistances. Explosion at any time.


XEM/BTC. Retesting of the global accumulation range1. Global bottom.
2. Easy-to-identify accumulation phase and the retest.
3. Minimal risks.
4. R/R ratio is very nice.
5. The same is valid for XEM/USD.
Generally the project is doing well. There will be good fundamentals soon, so, buy the rumor, sell the news.
I'm holding some XEMs from 400-450 sat range, but it's just the beginning. The patience is the only way to the triumph.
Disclaimer!
Not a financial advice. You must do your own research and use it as the priority. Trading is risky, so trade responsible.
P.S. Some thoughts about the dominance.

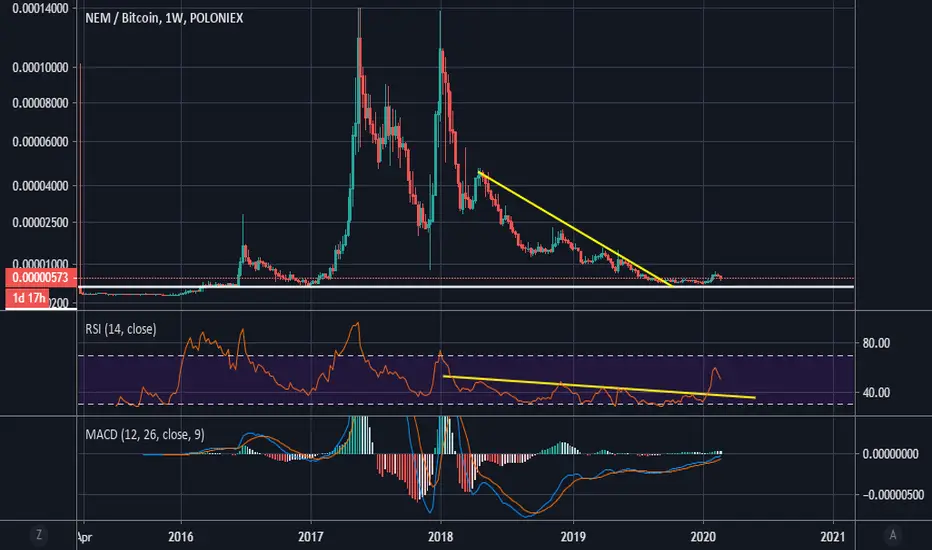
XEMBTCLooking at XEM or NEM on the weekly chart.
You think its impossible to get 1600% out of this long term trade. Its happened twice before. Both times bullish divs fired and the result was a 3000% run. Don't under estimate what the market can do.
Helly this ones for you :)

There is a trading opportunity to buy in NEMBTCTechnical analysis:
. NEM/BITCOIN is in a range bound and the beginning of uptrend is expected.
.The price is above the 21-Day WEMA which acts as a dynamic support.
. The RSI is at 43.
Trading suggestion:
. There is a possibility of temporary retracement to suggested support zone (0.0000054 to 0.0000038). if so, traders can set orders based on Price Action and expect to reach short-term targets.
Beginning of entry zone (0.0000054)
Ending of entry zone (0.0000038)
Entry signal:
Signal to enter the market occurs when the price comes to " Buy zone " then forms one of the reversal patterns, whether " Bullish Engulfing ", " Hammer " or " Valley " in other words, NO entry signal when the price comes to the zone BUT after any of reversal patterns is formed in the zone. To learn more about " Entry signal " and the special version of our " Price Action " strategy FOLLOW our lessons :
Take Profits:
TP1= @ 0.0000073
TP2= @ 0.0000100
TP3= @ 0.0000135
TP4= @ 0.0000217
TP5= @ 0.0000294
TP6= @ 0.0000451
TP7= @ 0.0000579
TP8= Free

There is a trading opportunity to buy in NEMBTCTechnical analysis:
. NEM/BITCOIN is in a range bound and the beginning of uptrend is expected.
.The price is above the 21-Day WEMA which acts as a dynamic support.
. The RSI is at 55.
Trading suggestion:
. There is a possibility of temporary retracement to suggested support zone (0.0000054 to 0.0000038). if so, traders can set orders based on Price Action and expect to reach short-term targets.
Beginning of entry zone (0.0000054)
Ending of entry zone (0.0000038)
Entry signal:
Signal to enter the market occurs when the price comes to " Buy zone " then forms one of the reversal patterns, whether " Bullish Engulfing ", " Hammer " or " Valley " in other words, NO entry signal when the price comes to the zone BUT after any of reversal patterns is formed in the zone. To learn more about " Entry signal " and the special version of our " Price Action " strategy FOLLOW our lessons :
Take Profits:
TP1= @ 0.0000073
TP2= @ 0.0000100
TP3= @ 0.0000135
TP4= @ 0.0000217
TP5= @ 0.0000294
TP6= @ 0.0000451
TP7= @ 0.0000579
TP8= Free

XEMBTC Elliot waves analysisAnalyzing XEMBTC pair using Elliot waves, we can see that the correction ABC of wave 3 has just been finished. Long.


NEM Textbook TD Setup For 300-400% GainsNEM has been in a massive downtrend since 2018, we have not had any of the pump experienced by many of the alt coins and may be in line for its share.
We have started the Month on a green one after two Td 9's, fisher has turned green
Targets are the fib lines along the way

XEM/BTCXEM/BTC is coming up to my first potential buy range. This a major level of untested support on the monthly. I would ladder my order to the bottom of this range, averaging my price down. If this first range breaks then I will be entering a more serious order in the second green range. It is vital that XEM holds the second range.
